

Hope you all are having a good weekend. Below, we will be previewing the upcoming week’s events and providing a portfolio update as usual.
Format for what is covered in this weekly preview:
A Look at the Indices
Key Upcoming Economic Events
Upcoming Earnings
Charts
Current Portfolio Holdings (Scroll here for current positions)
Sizing | Cost Basis | Timeframe | Planned Moves
Closing Thoughts (Scroll here for my market commentary)
I recommend checking out the most recent in-depth Monthly Portfolio and Performance Update below (the new post will also be published within the next day).

For all readers a reminder that a premium subscription includes:
Live Portfolio updates (All Buys and Sells) in Subscriber only Channels
Favourite set-up Ideas, Market Memos plus Full archive
Monthly in depth portfolio & performance updates
Annual Tier: Discord access for live trading account updates and AMAs.
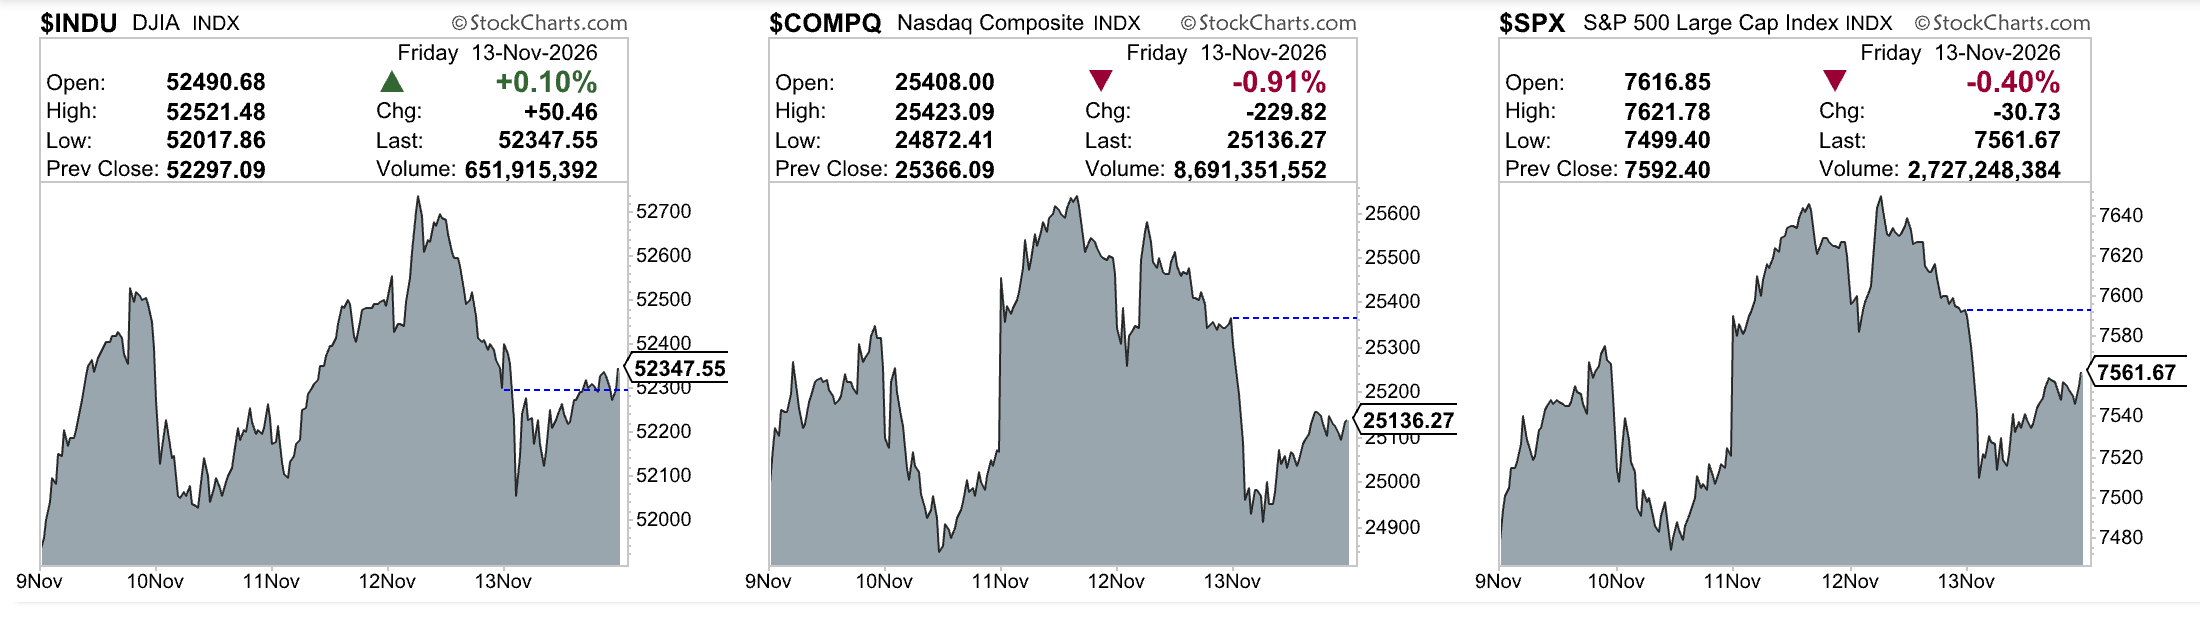
Indices
Dow Jones Industrial Average advanced +2.07% in the last week
S&P 500 advanced +2.51% in the last week
Nasdaq Composite advanced +2.27% in the last week
IWM advanced +1.41% in the last week
Key upcoming economic events
Monday, November 16
Empire State Manufacturing Survey (November)
Fed Chair Warsh opening remarks at the Productivity and Jobs Task Force Conference
Tuesday, November 17
Retail Sales (October)
Industrial Production (October)
Fed speakers: Waller and Williams
Wednesday, November 18
FOMC Minutes (October 27-28 meeting)
Fed speakers: Williams and Kashkari
Thursday, November 19
Initial and Continuing Jobless Claims
Philadelphia Fed Manufacturing Index (November)
Trump–Xi bilateral at APEC in Shenzhen, followed by a Trump–Xi–Putin trilateral
Fed speakers: Jefferson, Goolsbee and Barkin
Friday, November 20
University of Michigan Consumer Sentiment, final (November)
Monthly options expiration
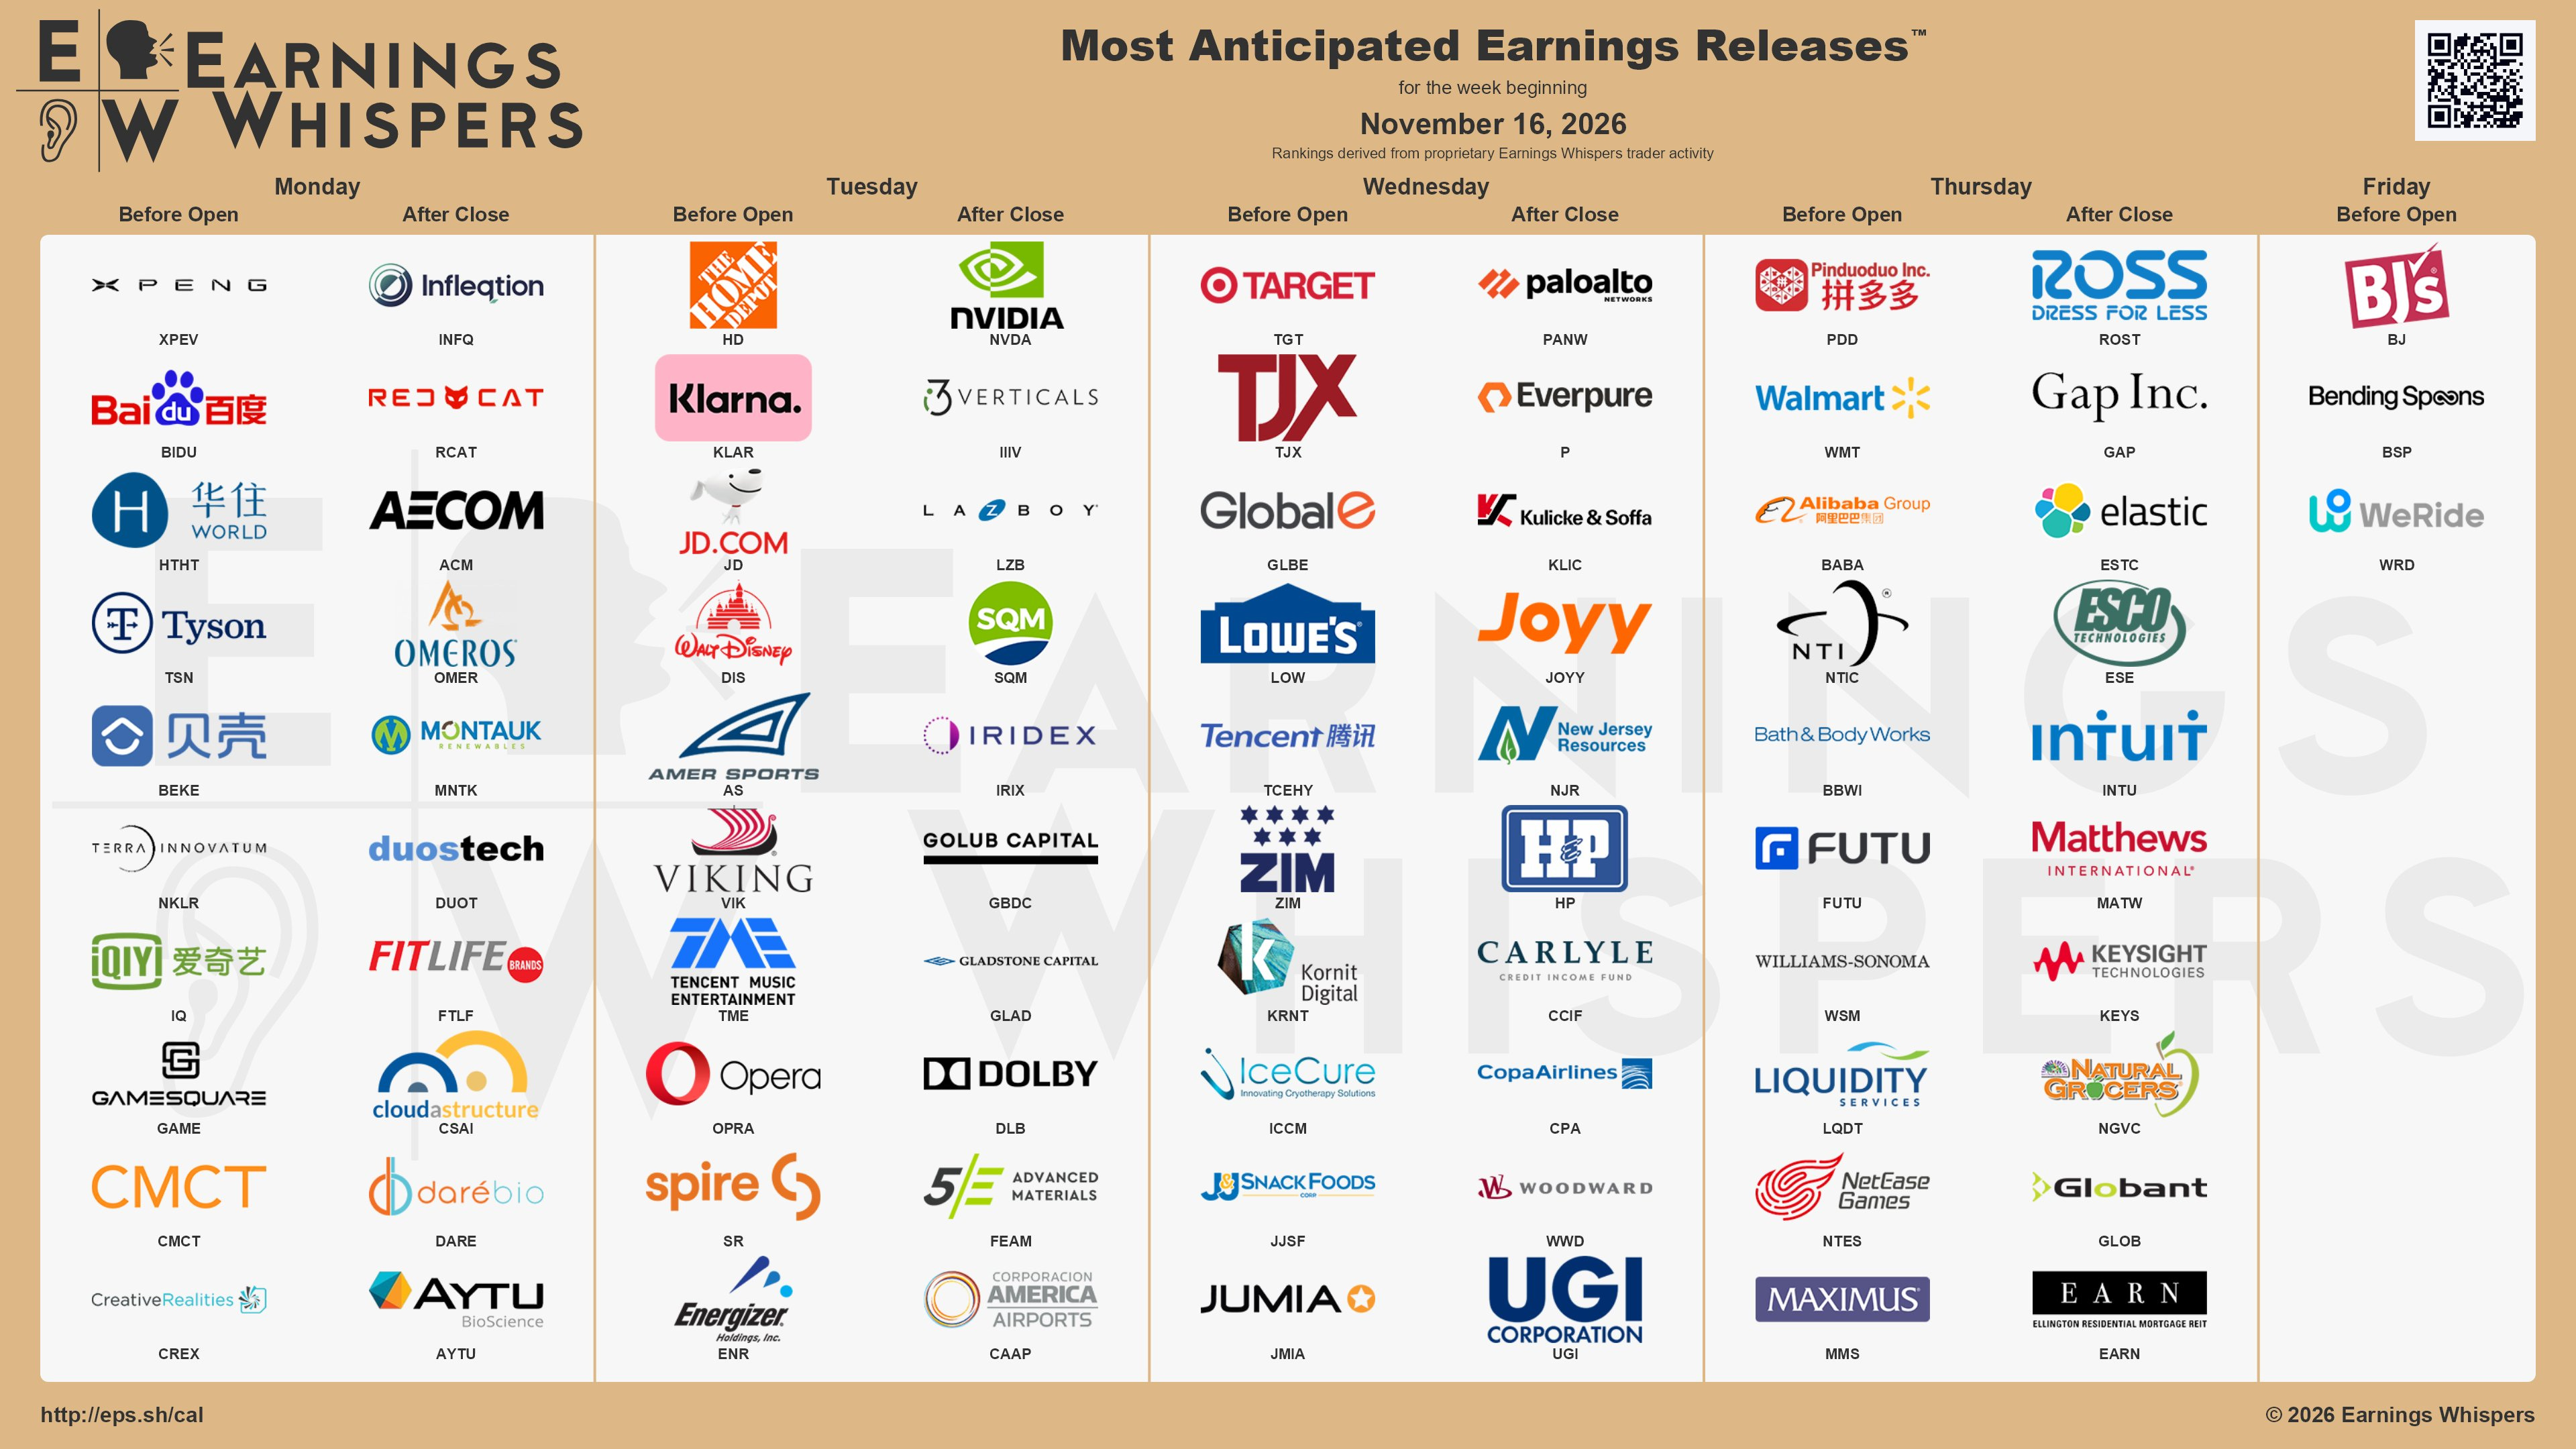
Upcoming Earnings
Below is the infographic by Earnings Whispers highlighting the schedule for this week:
Charts
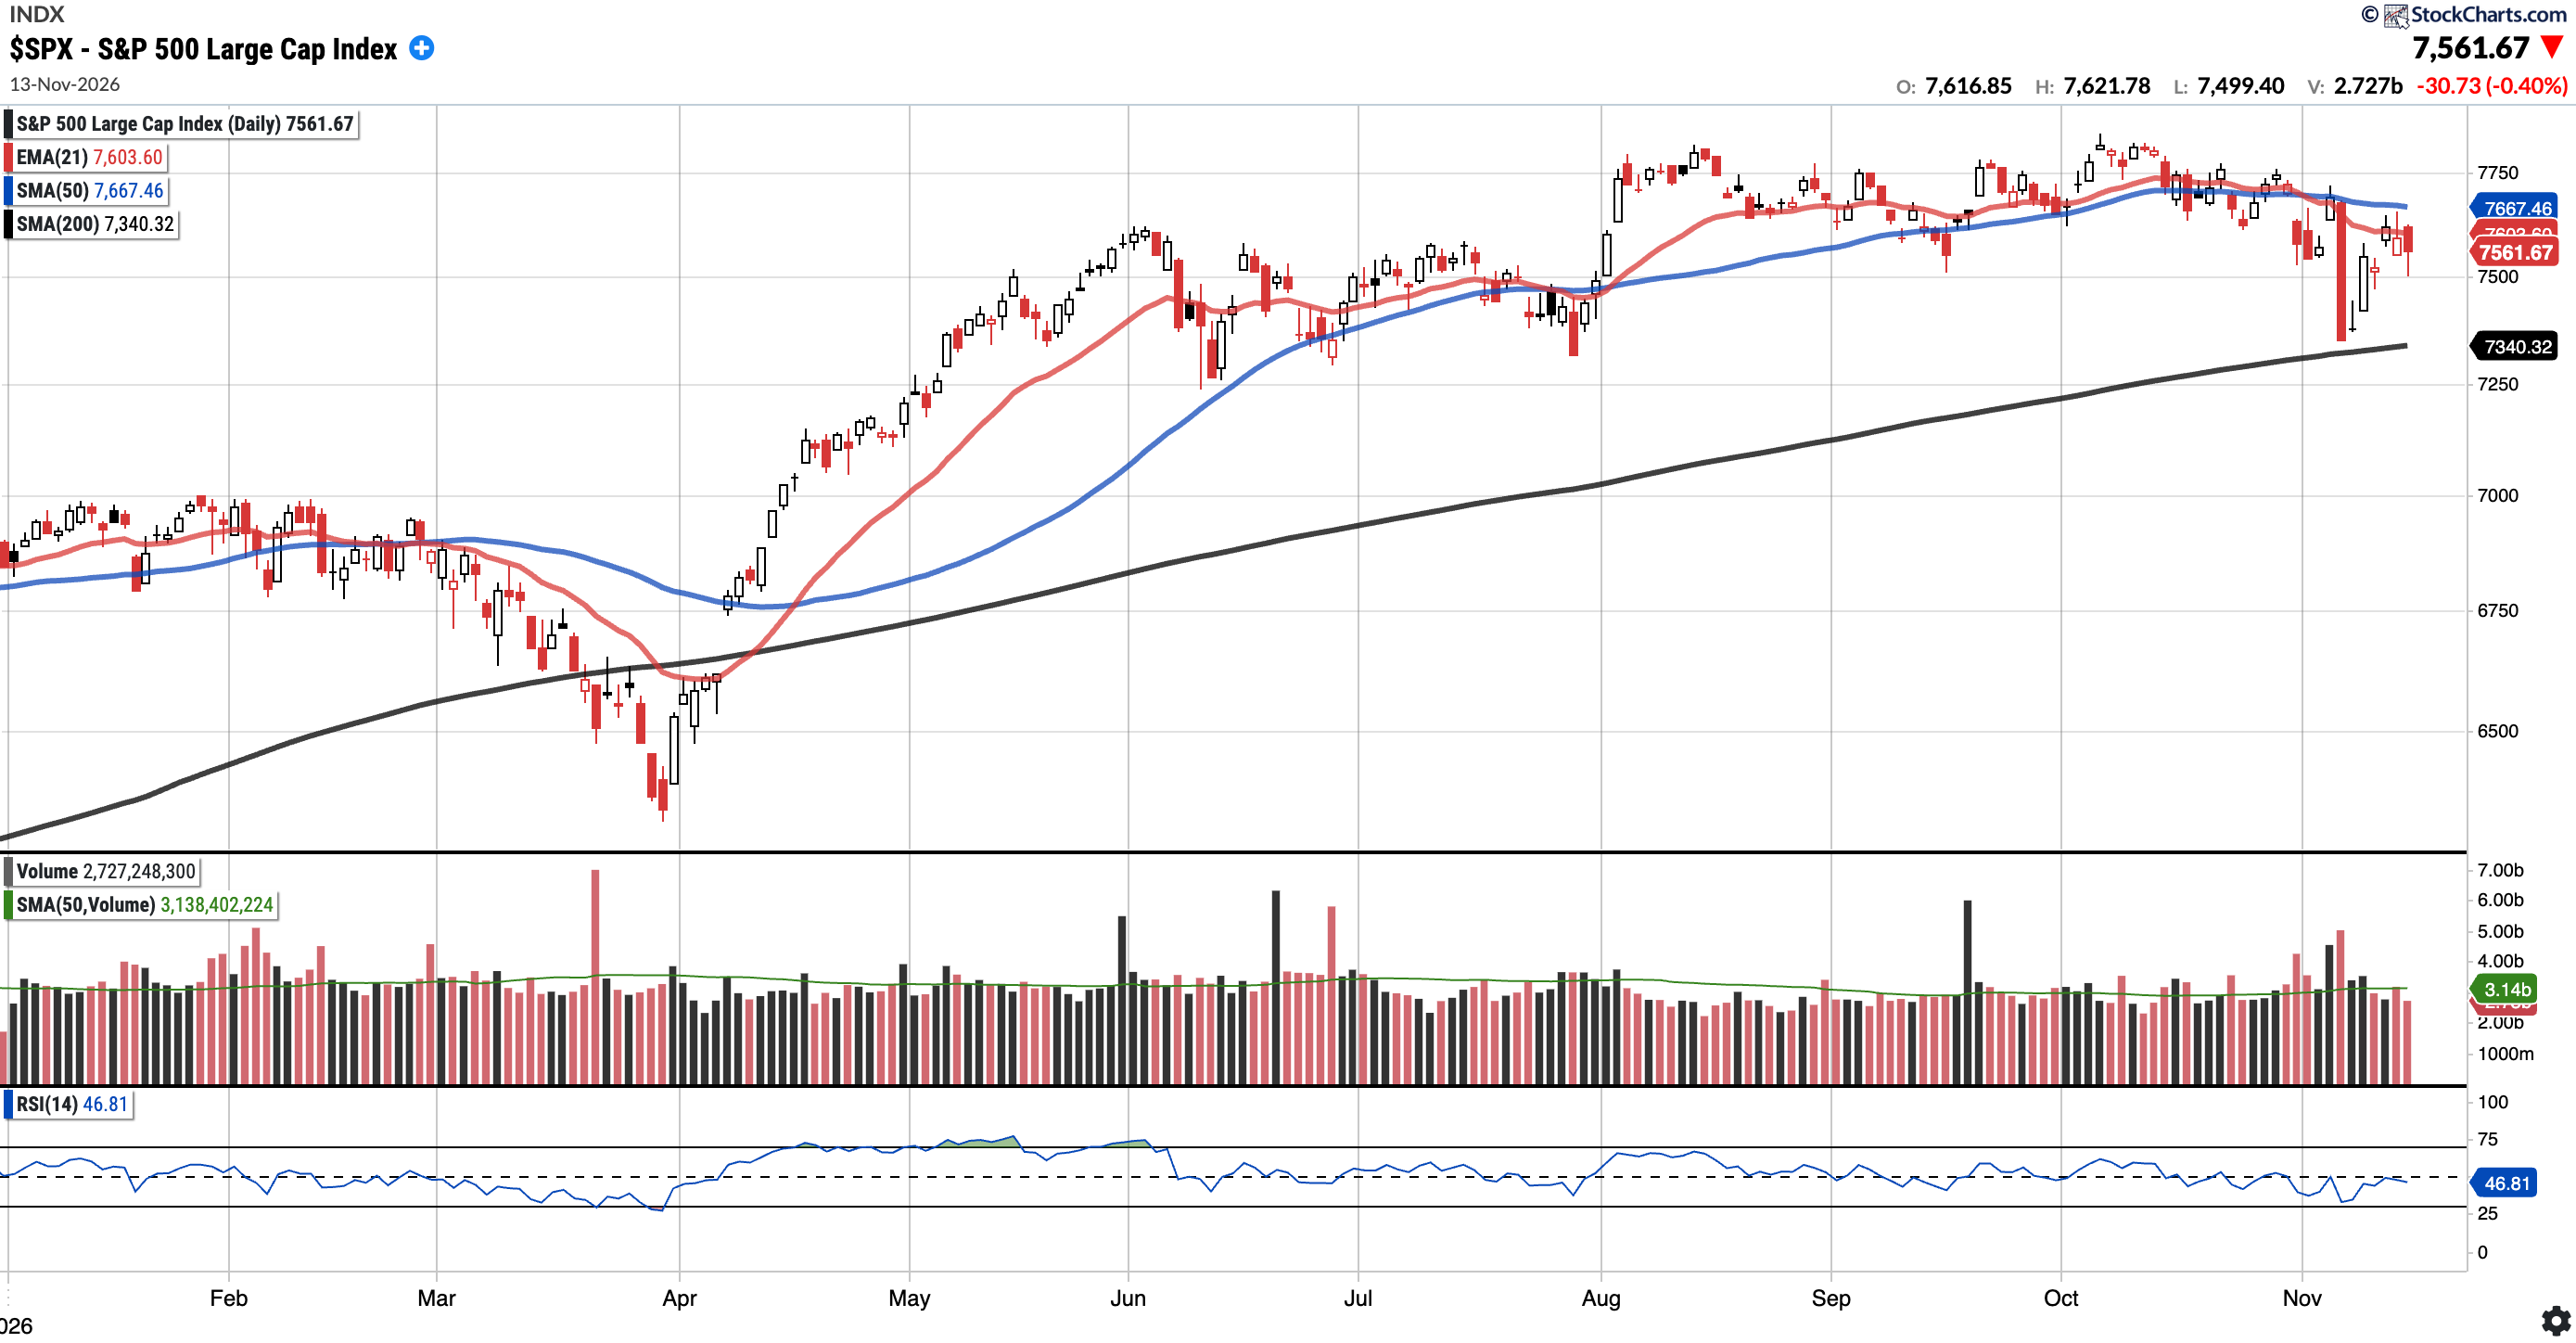
SPX
Currently trades at $7,561.67, 1.38% below the 50SMA and 3.02% above the 200SMA.
RSI 46.81
10.25% YTD
Distribution days in the last week: 1
Last week, the S&P 500 held above the 200-day SMA. Despite finishing this week up 2.51%, it closed below the 50-day SMA. Bulls will want to see the 21-day EMA ($7,604) and 50-day SMA ($7,667) reclaimed, with the 200-day SMA ($7,340) remaining key support below.
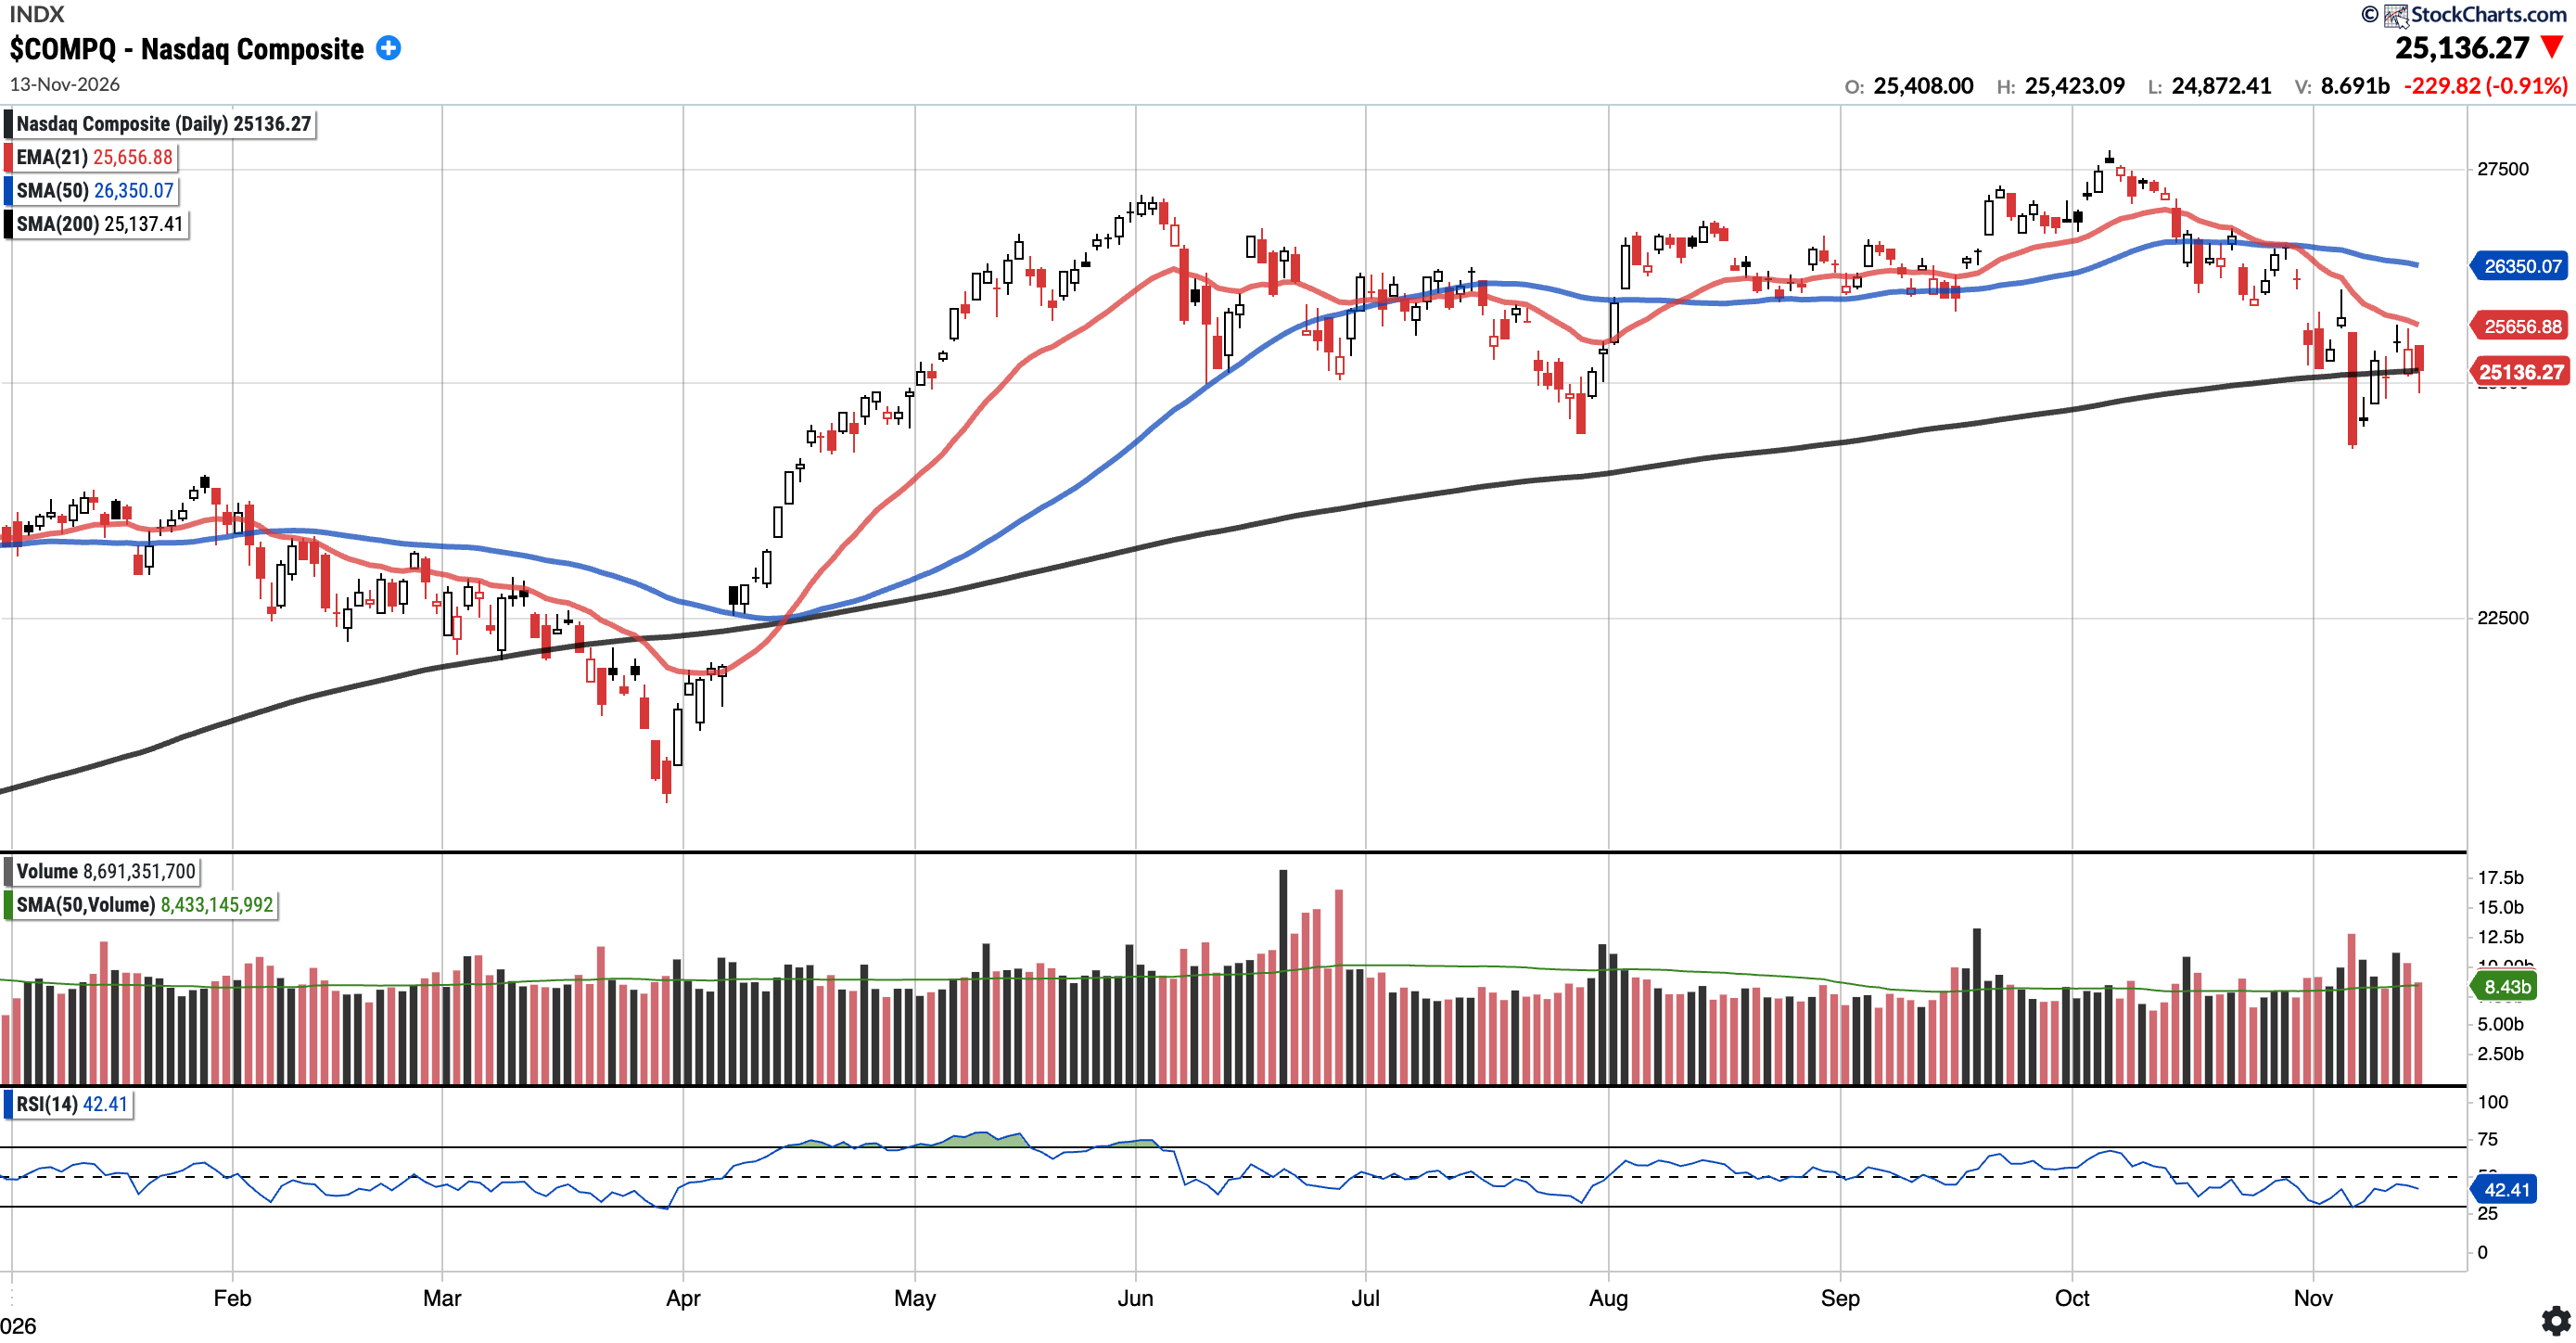
COMPQ
Currently trades at $25,136.27, 4.61% below the 50SMA and 0.00% below the 200SMA.
RSI 42.41
8.18% YTD
Distribution days in the last week: 0
COMPQ reclaimed the 200-day SMA on Monday before being rejected at the 21-day EMA on Wednesday. The index closed the week right on the 200-day SMA ($25,137). Bulls will want this level to hold on a closing basis, with the 21-day EMA ($25,657) as the next level to reclaim.
BTC (currently Long)
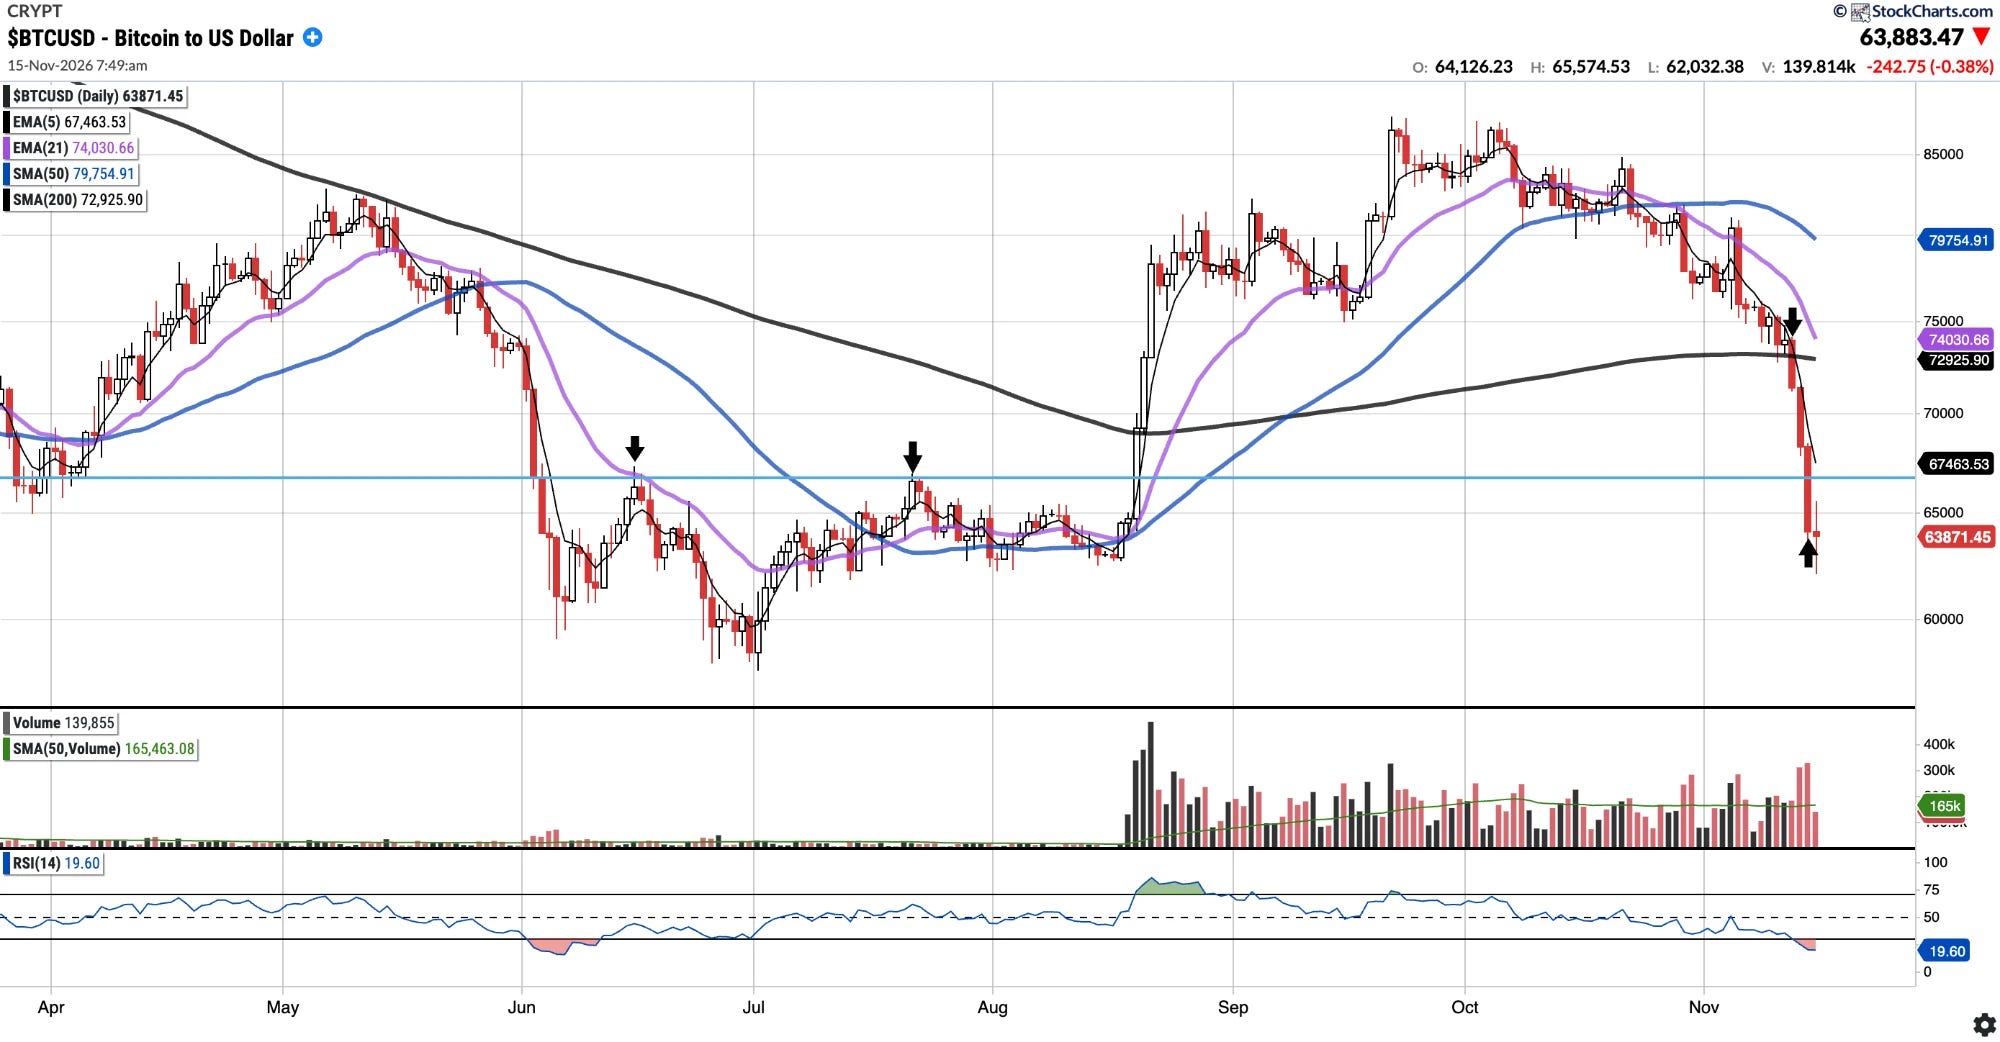
Currently trades at $63,900, 19.85% below the 50SMA and 12.36% below the 200SMA.
RSI 19.60
-27.99% YTD
As of Sunday November 15 at 2:49AM EST (7:49 AM UTC), BTC is trading at $63,883. Last week we noted that a loss of $75K would see the 200SMA as the next major support. Both gave way this week: BTC slipped below $75K early in the week and broke below the 200SMA on Thursday (see down arrow). The selling then accelerated, taking price through the ~$67K level that capped the June and July rallies (see arrows). Bulls will want to see ~$67K reclaimed. Failing that, the June–July lows around $58K are the next major support.
EEM
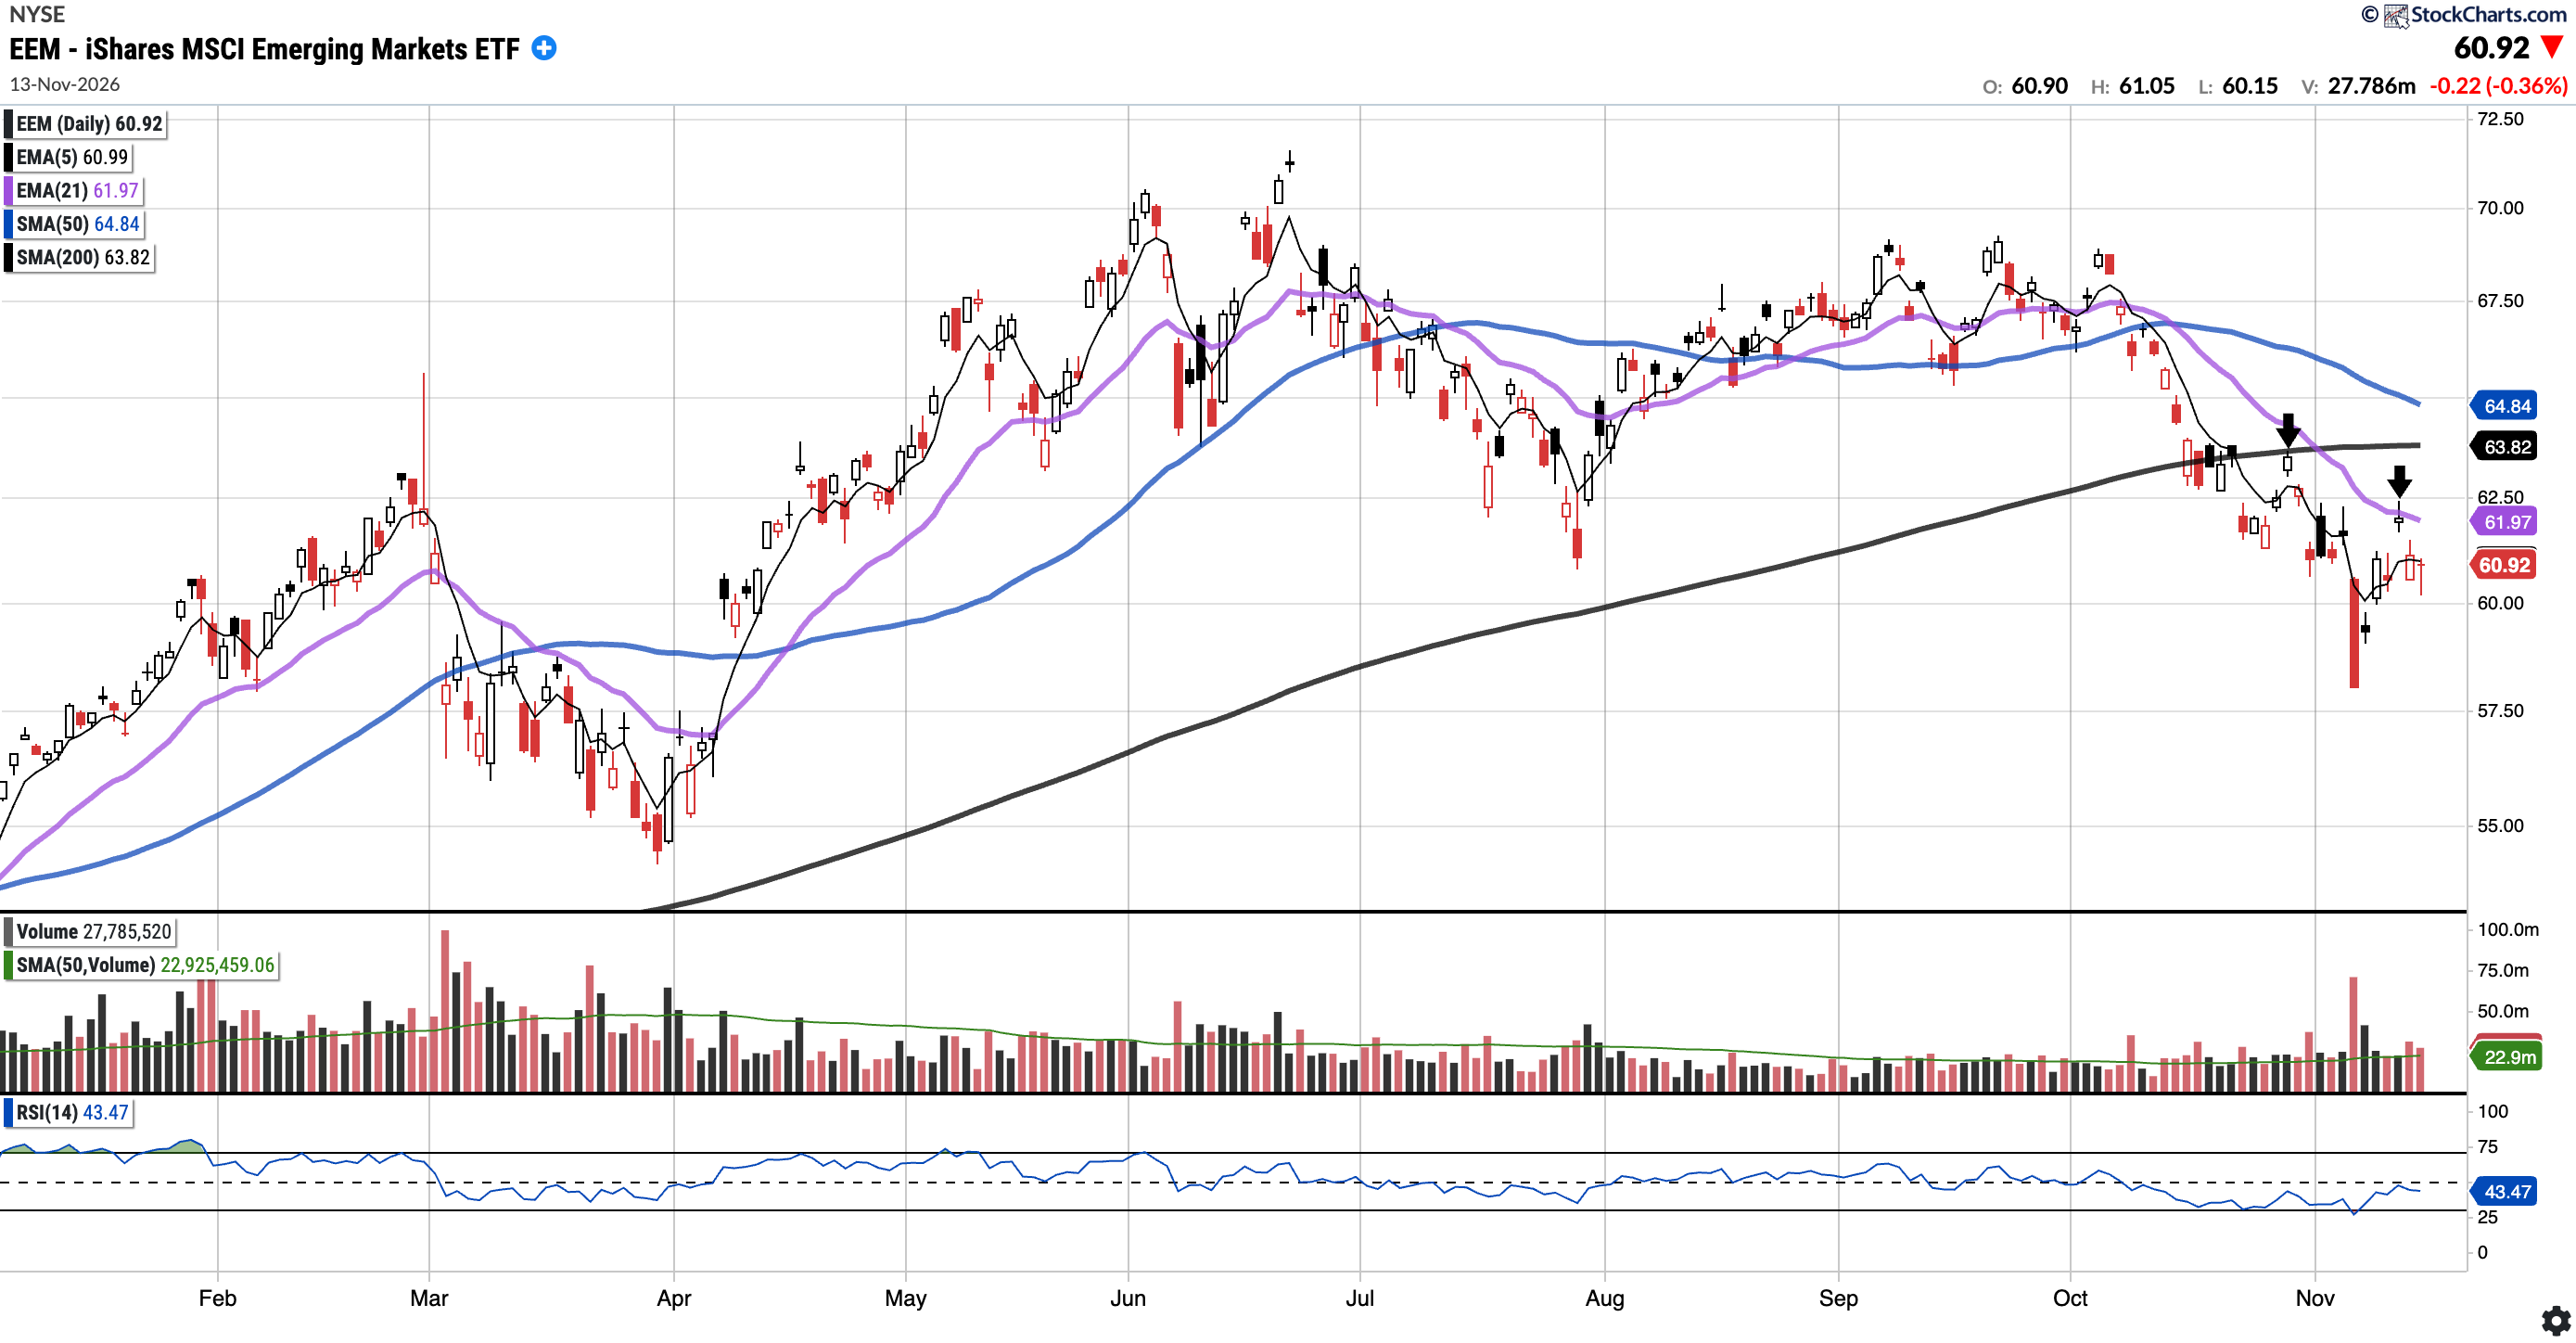
Currently trades at $60.92, 6.04% below the 50SMA and 4.54% below the 200SMA.
RSI 43.47
8.88% YTD
EEM rallied 2.68% and tested the 21-day EMA on Wednesday, but was rejected there (see second down arrow), much like the late-October rejection at the 200-day SMA. It remains below all of its key moving averages. The levels to reclaim are unchanged from last week: the 21-day EMA ($61.97) first, then the 200-day SMA ($63.82).
EWZ (Currently Long via IBZL)
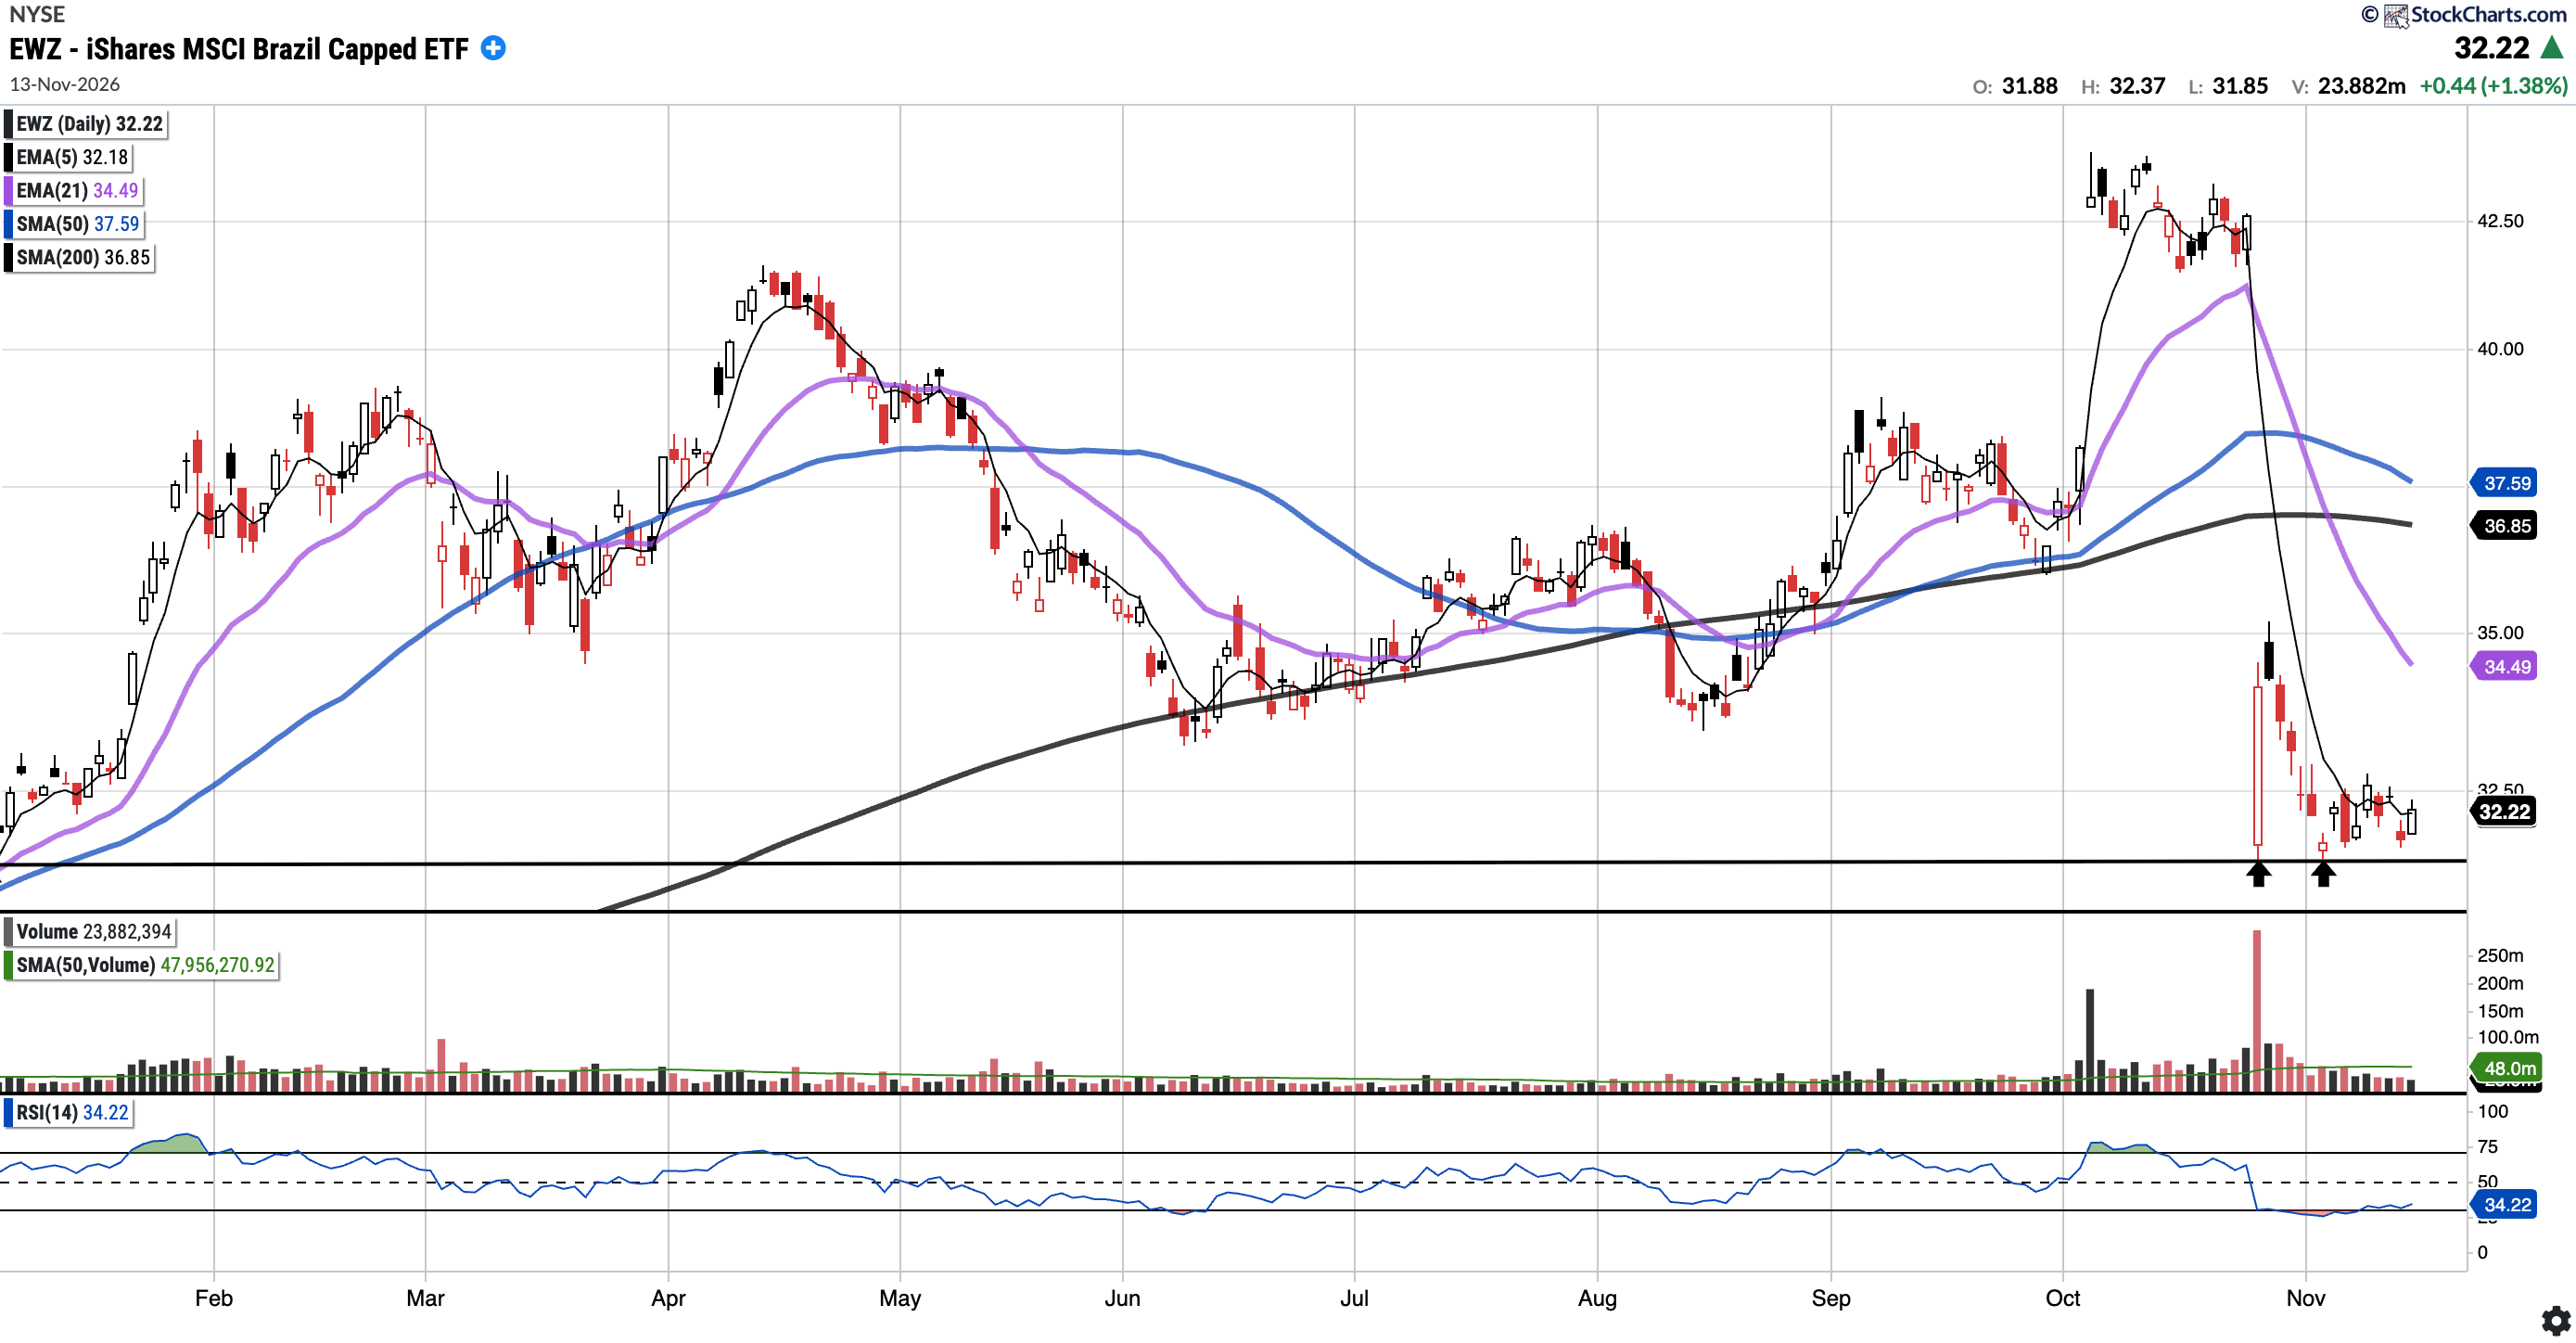
Currently trades at $32.22, 14.29% below the 50SMA and 12.56% below the 200SMA.
RSI 34.22
1.01% YTD
Whilst EWZ spent another week consolidating just above the ~$31.50 support (see arrows) it does not look especially constructive. Volume continues to dry up at roughly half its 50-day average. Bulls will want $31.50 to keep holding, with the 21EMA ($34.49) the first meaningful level to reclaim.
GOLD (Long Physical)
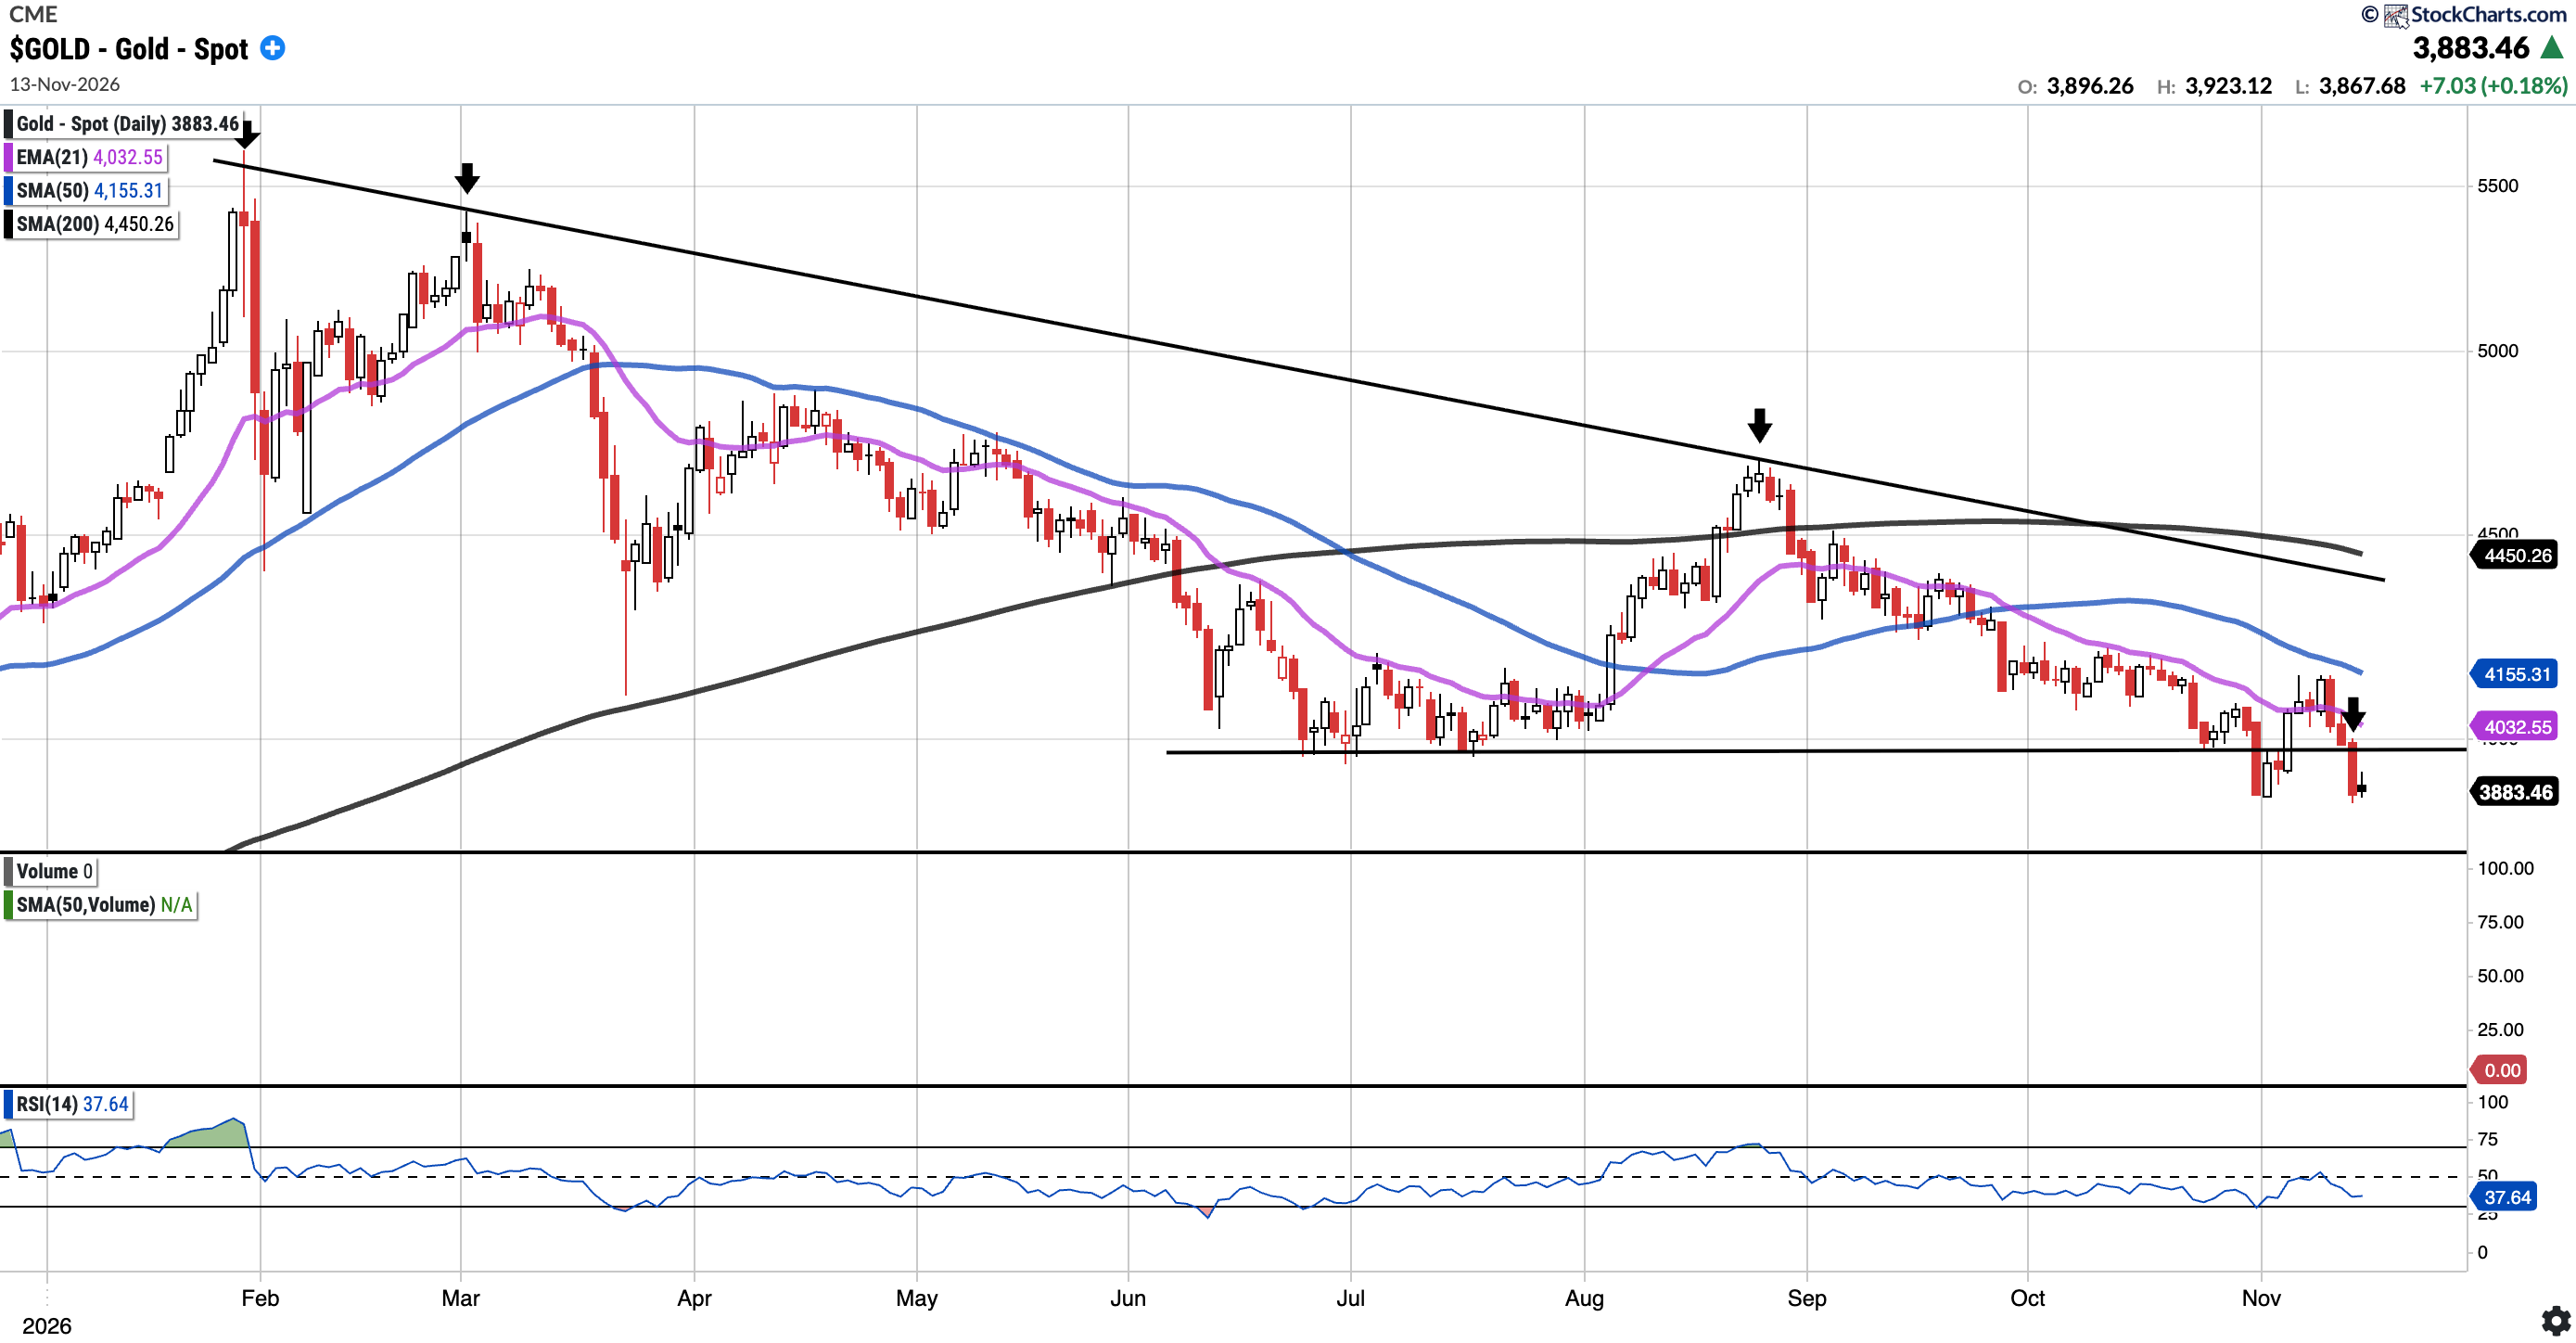
Currently trades at $3,883.46, 6.54% below the 50SMA and 12.74% below the 200SMA.
RSI 37.64
-10.17% YTD
Last week gold reclaimed the $3,950–$4,000 zone and closed right at the 21-day EMA. This week it was rejected at the 21EMA (see last down arrow) and fell back below the zone, closing down 4.57% on the week and back near its early-November low. Bulls will want to see $3,950–$4,000 reclaimed again, followed by the 21EMA ($4,032.55). The 50SMA and the descending trendline from the January highs sit further overhead.
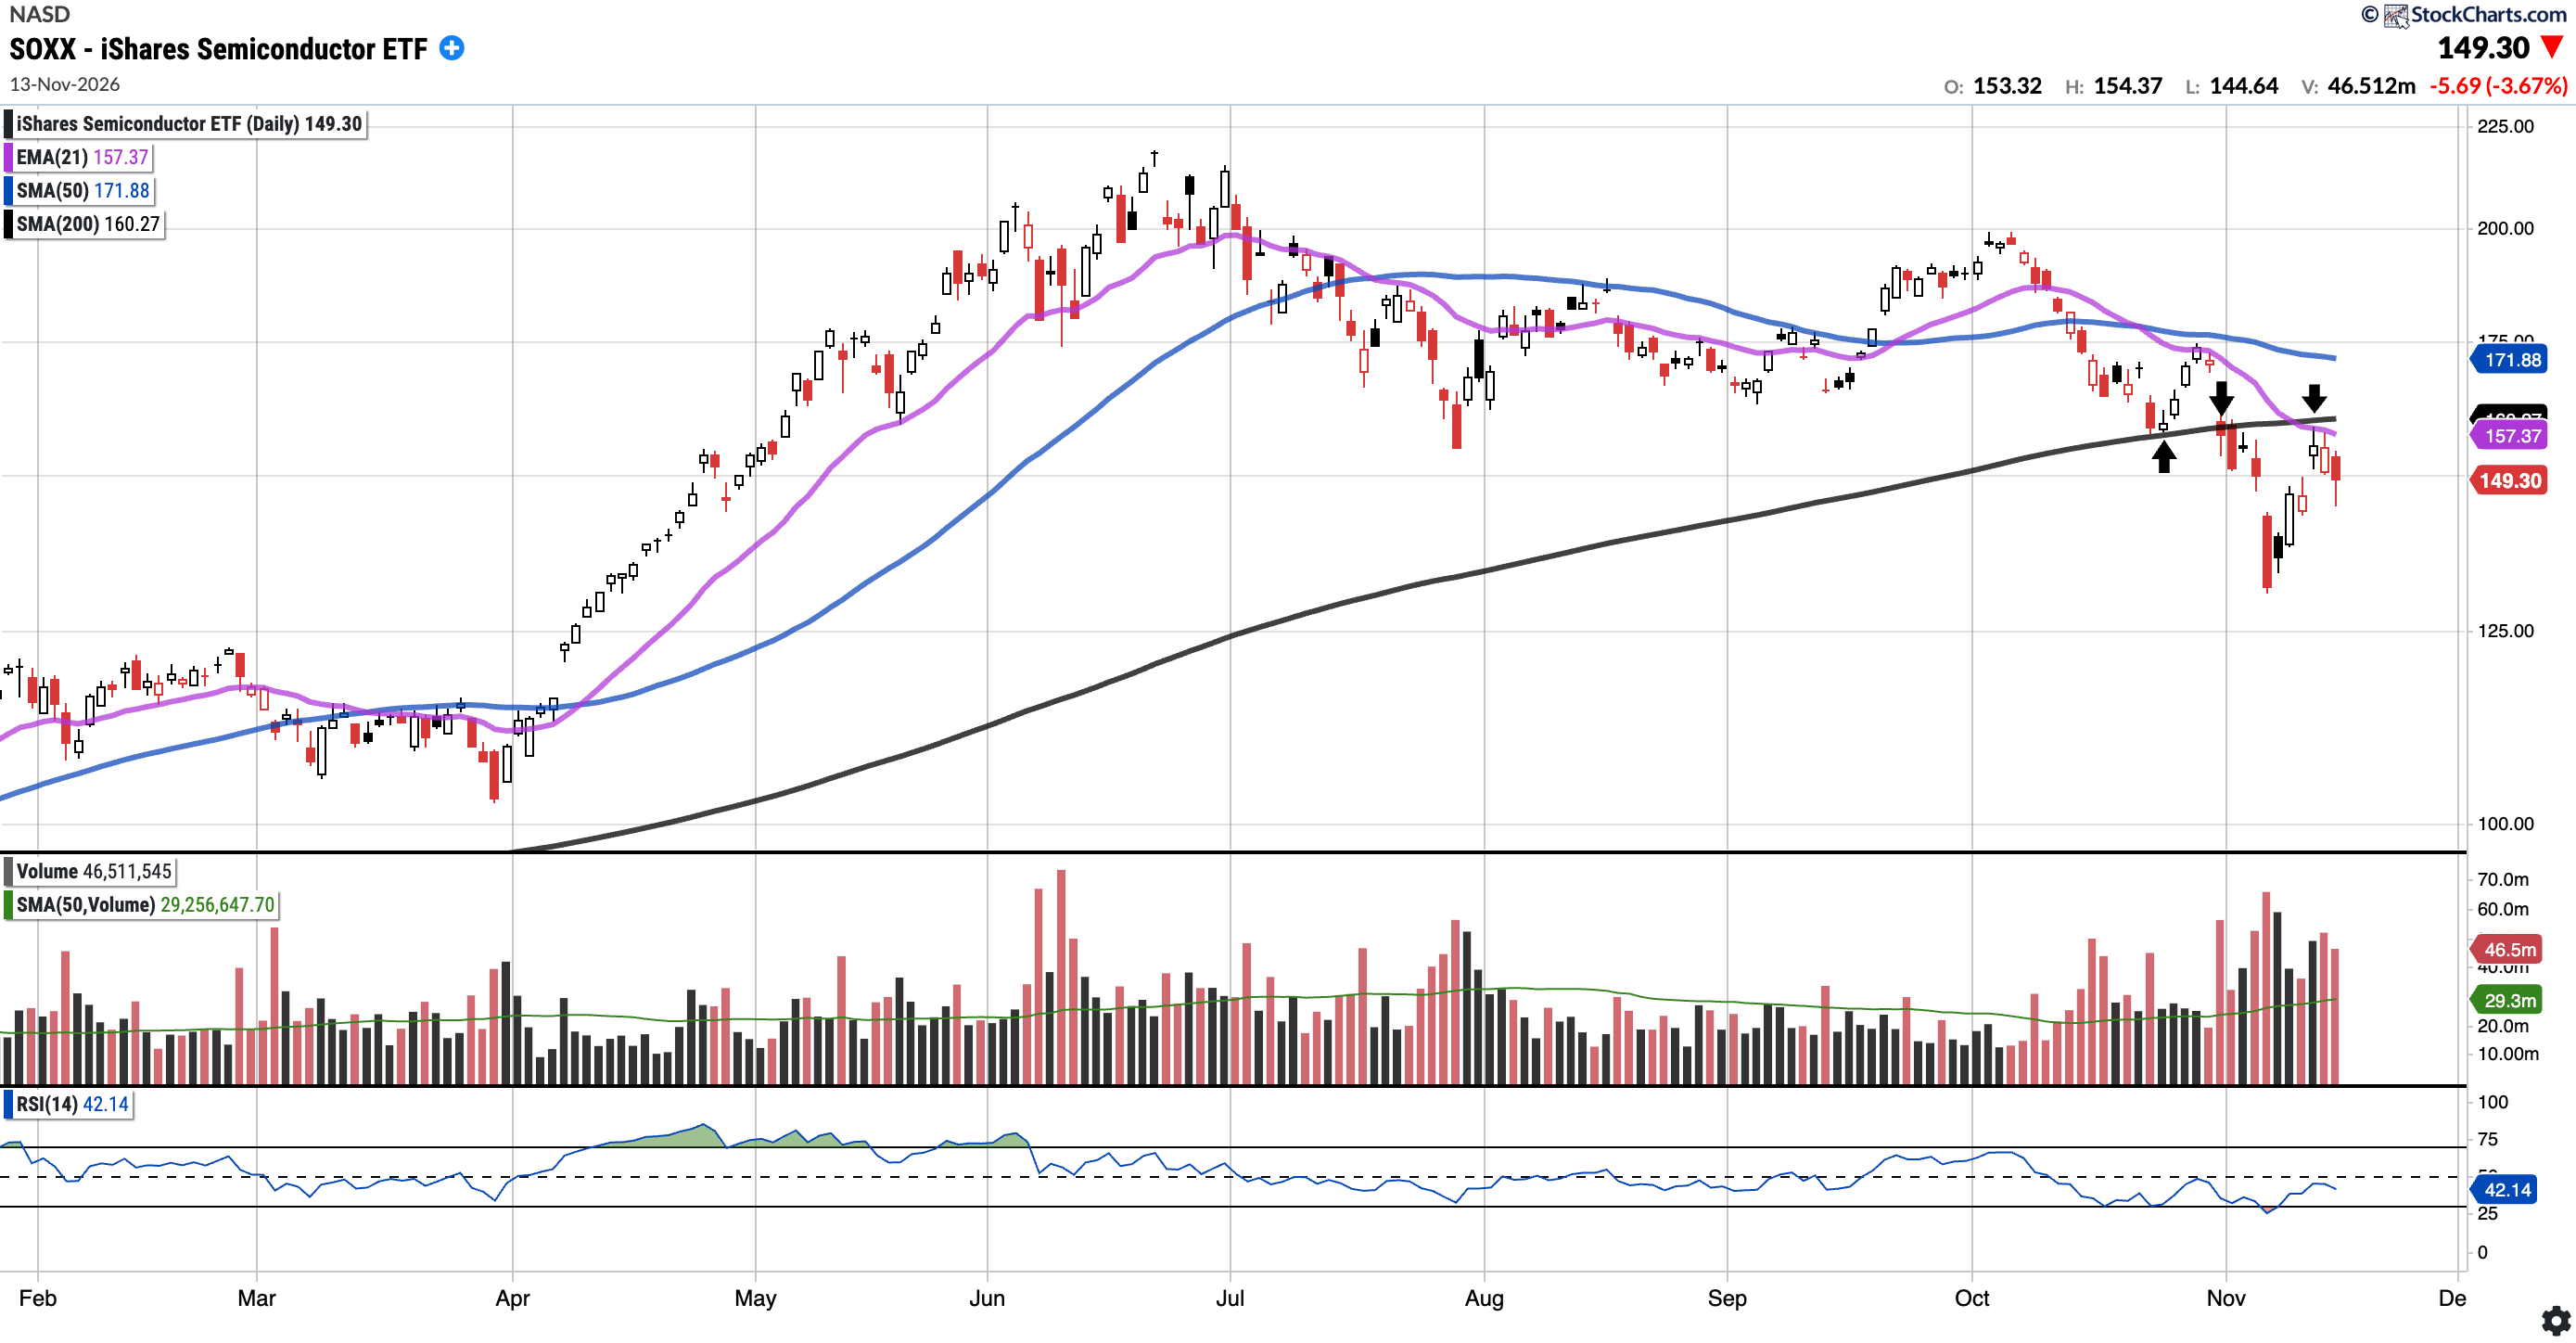
SOXX
Currently trades at $149.30, 13.14% below the 50SMA and 6.84% below the 200SMA.
RSI 42.14
43.03% YTD
Last week we noted the 21EMA and 200SMA were both around $160 overhead. SOXX rallied this week into that zone but was rejected there (see arrow), and Friday’s 3.67% drop came on above-average volume. Bulls will want to see a decisive reclaim of the 21EMA ($157.37) and 200SMA ($160.27).
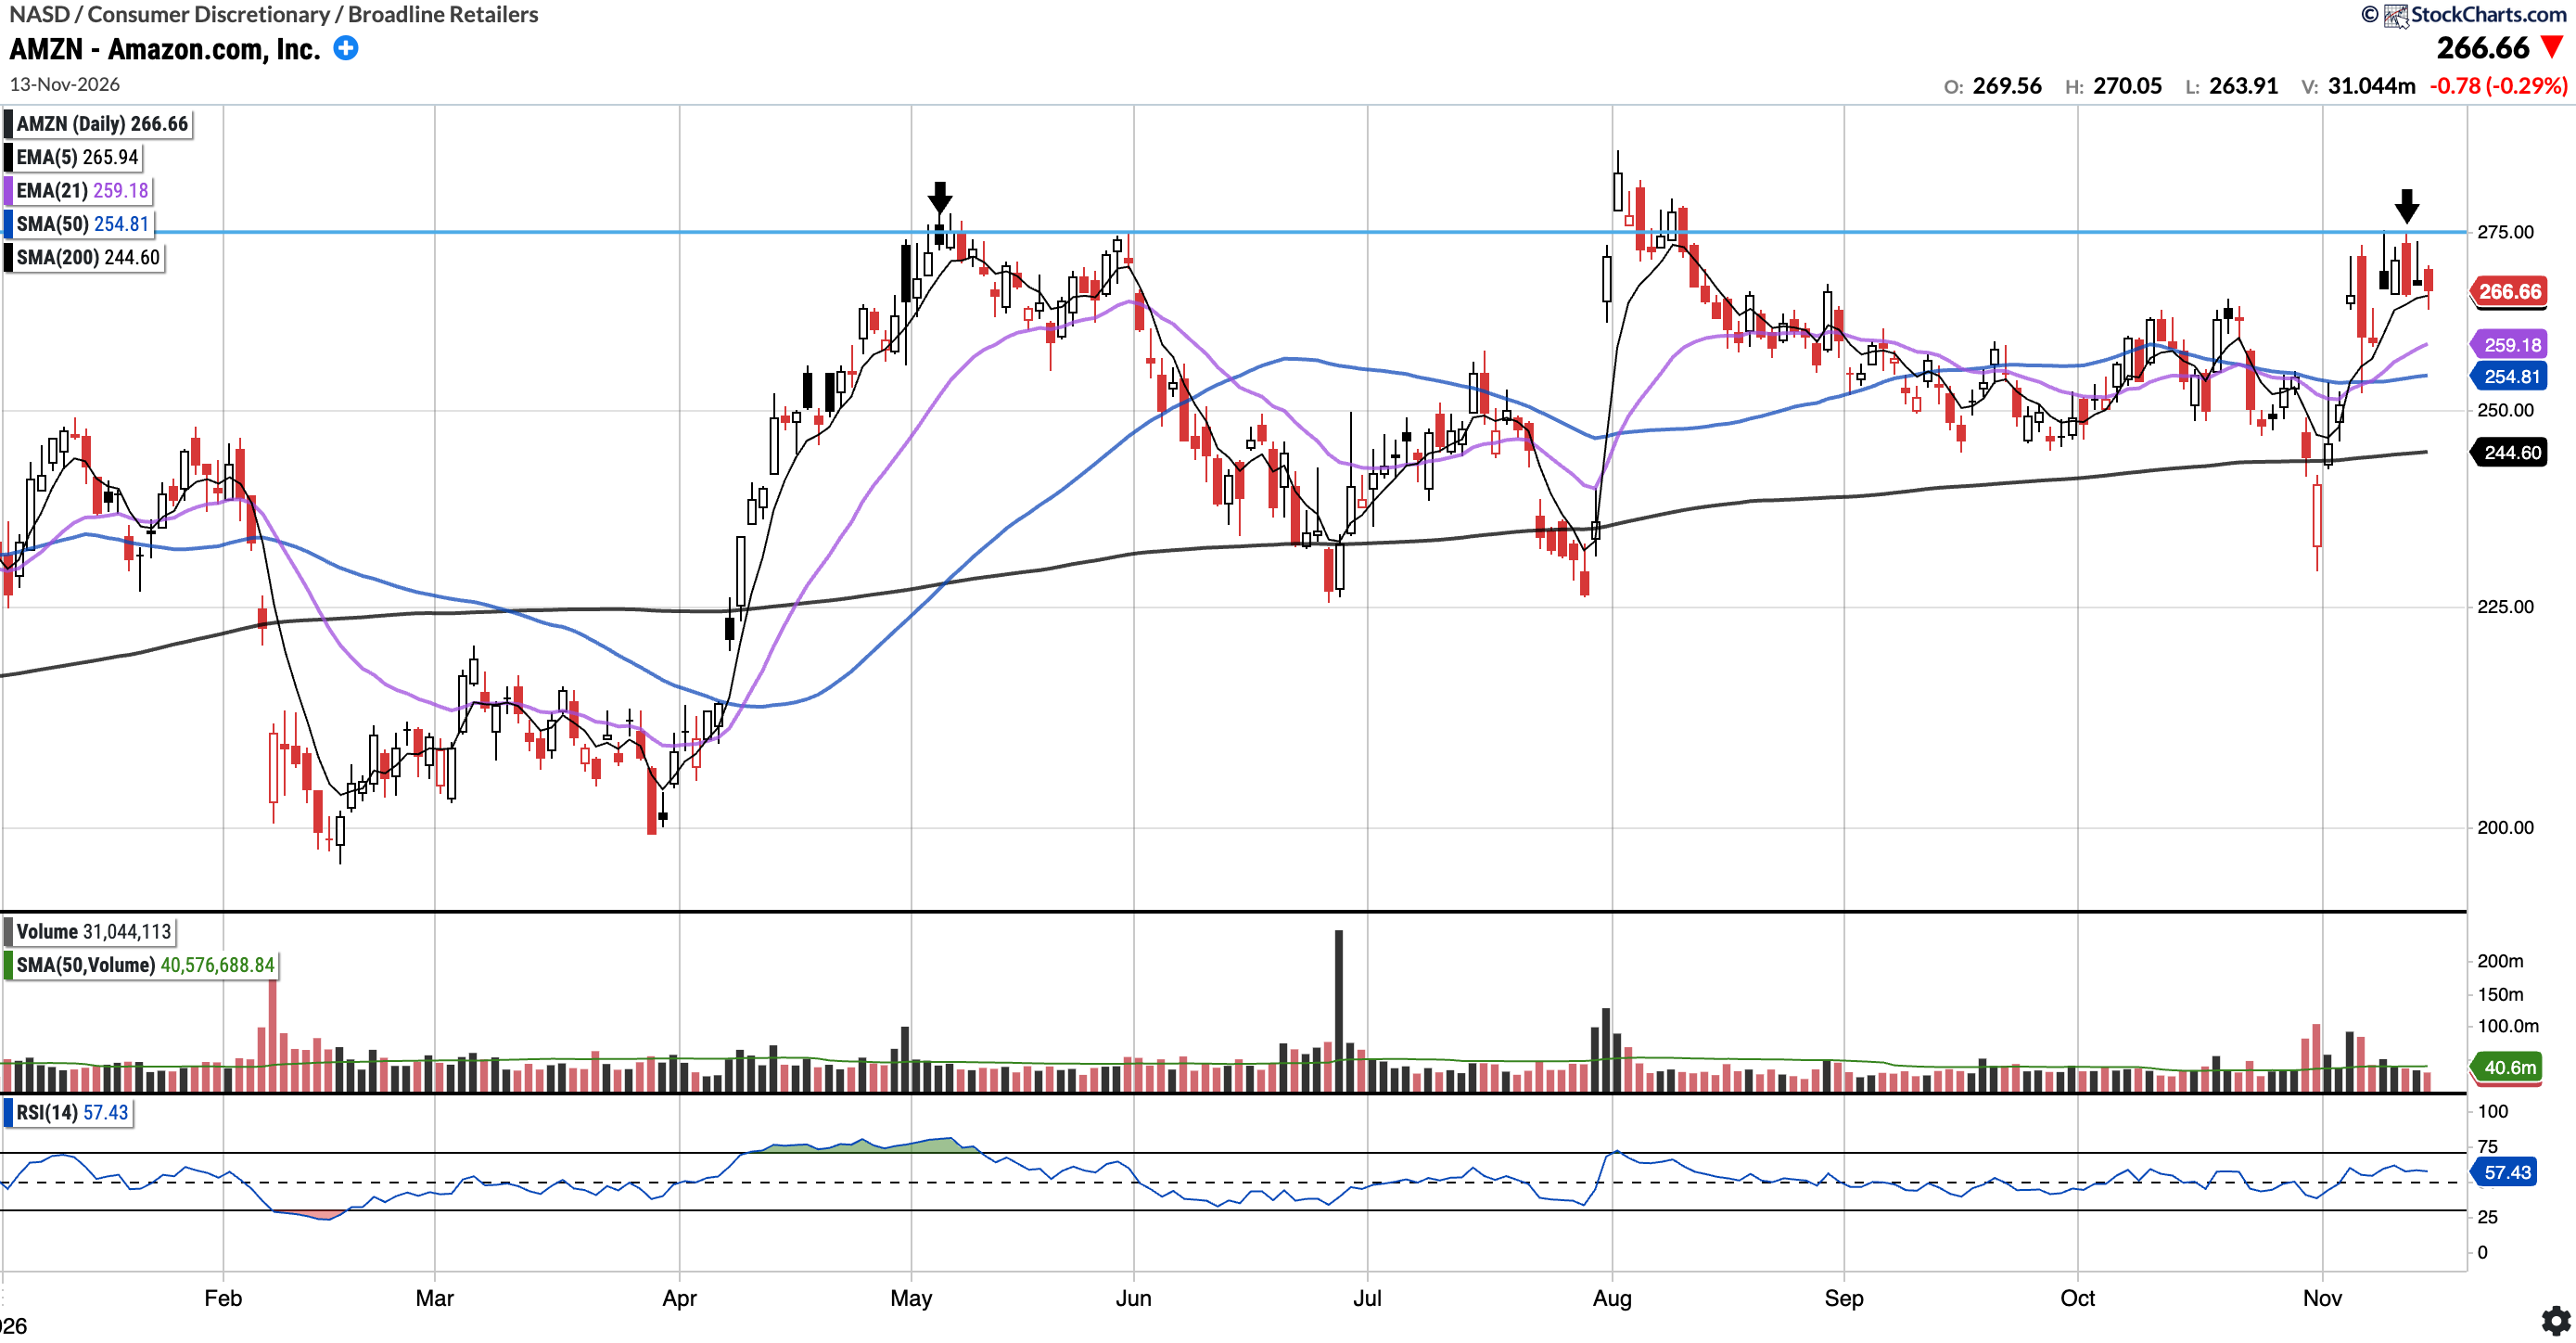
AMZN (Currently Long)
Currently trades at $266.66, 4.65% above the 50SMA and 9.02% above the 200SMA.
RSI 57.43
17.73% YTD
As flagged last week, the mid-$270s have been serving as resistance for AMZN (see arrow). Still, it closed the week up and above all of its key moving averages. Bulls will want a decisive close above $275, with the 21-day EMA ($259.18) and 50-day SMA ($254.81) as support on any pullback.
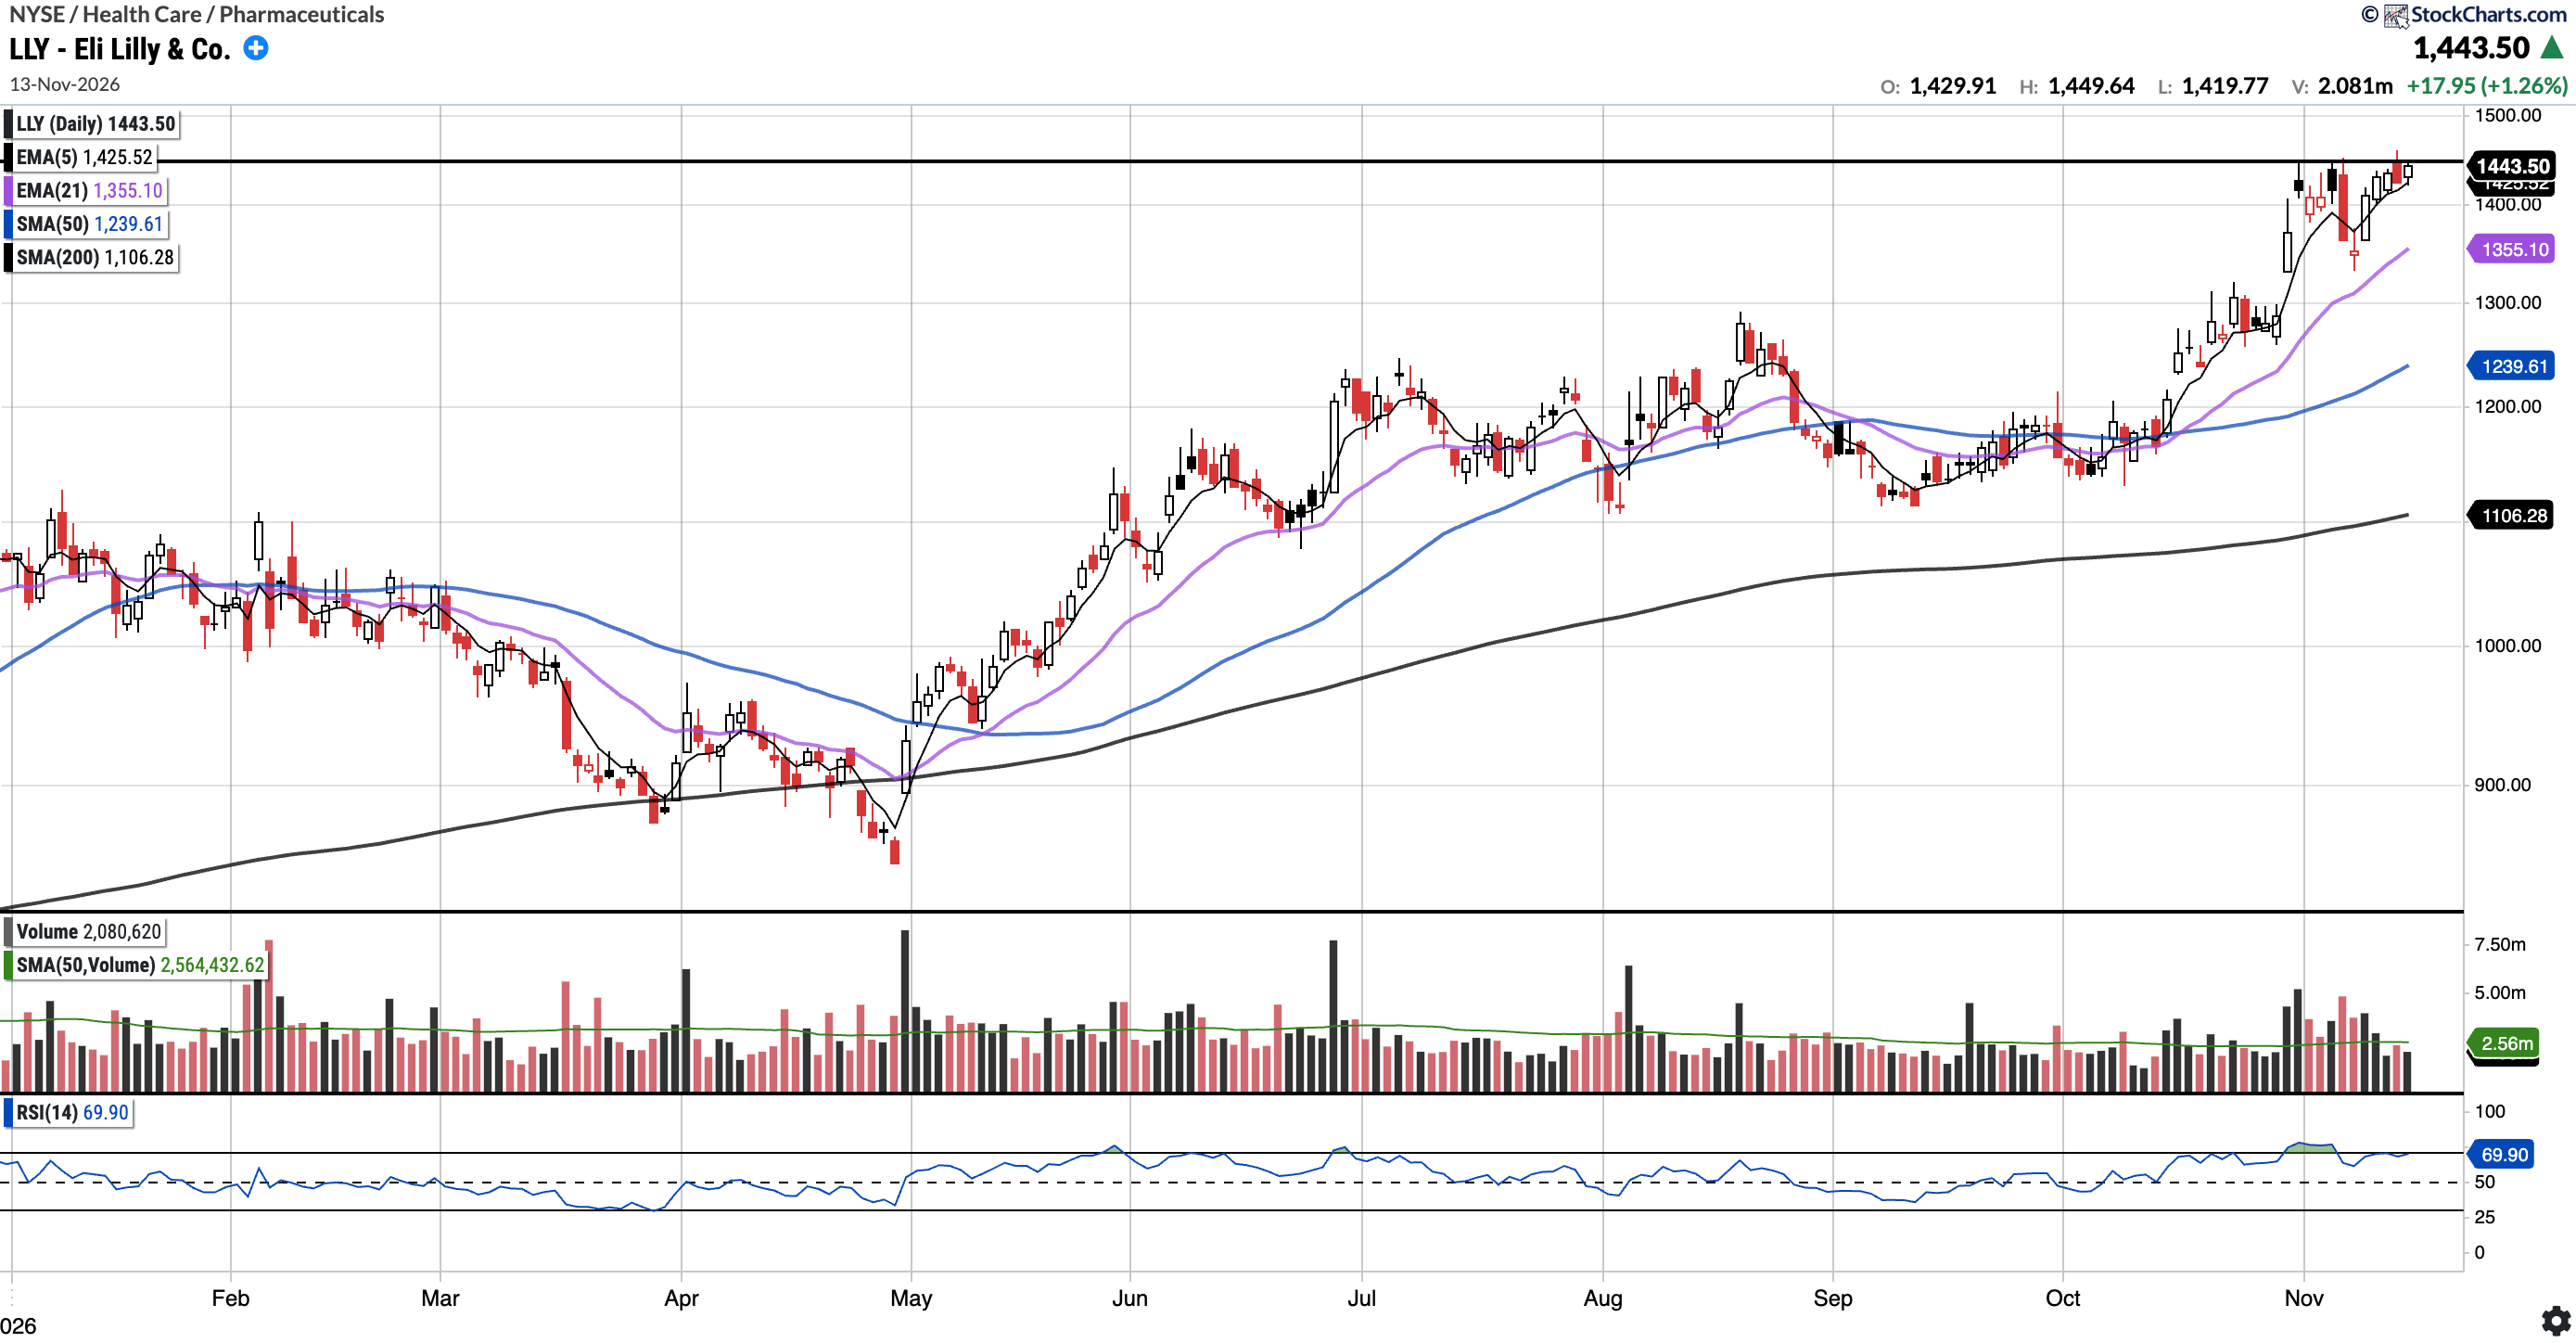
LLY (Currently Long)
Currently trades at $1,443.50, 16.45% above the 50SMA and 30.48% above the 200SMA.
RSI 69.90
34.42% YTD
LLY had another strong week, making a new intraday high of $1,460 on Thursday, but closing below the ~$1,450 level where it reversed last week (see horizontal line). We will be watching for a 5/21 EMA cross to the downside as a signal of a shift in momentum.
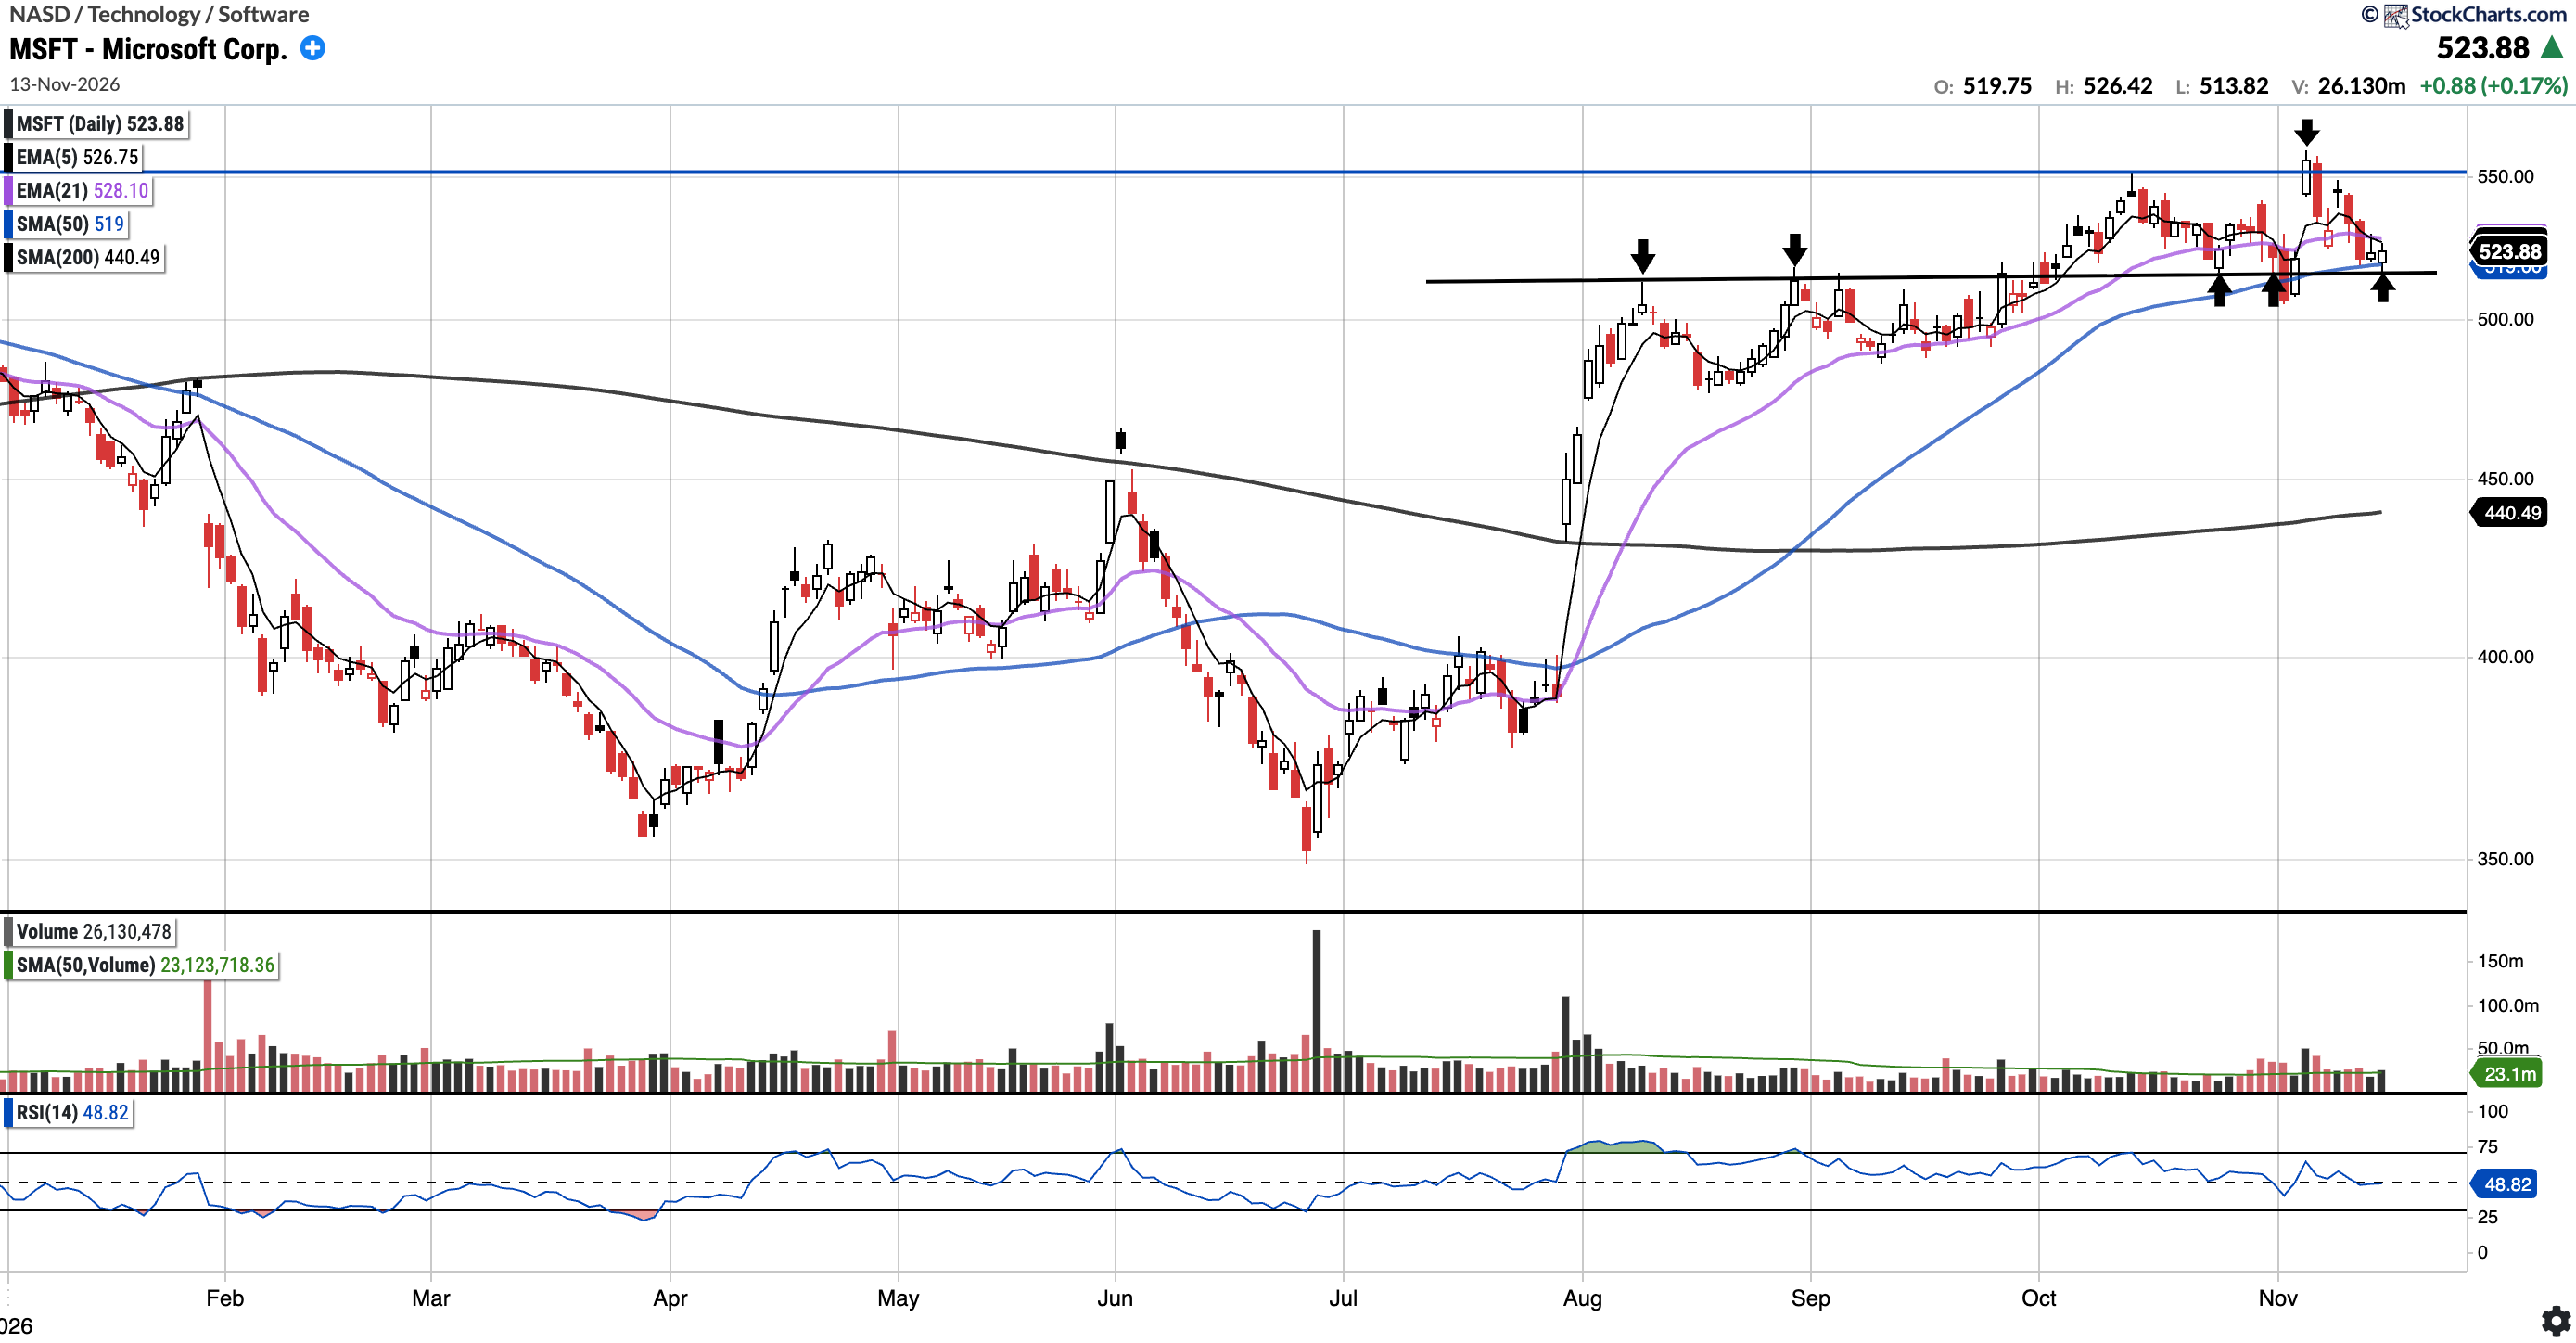
MSFT (Currently Long)
Currently trades at $523.88, 0.94% above the 50SMA and 18.93% above the 200SMA.
RSI 48.82
11.47% YTD
MSFT pushed back towards $550 on Monday but reversed, dipping below $515 and the 50-day SMA. Ultimately, price closed the week above both (see last up arrow), finishing the week down 1.27%. $515 and the 50SMA remain the key support zone. Bulls still want to see price close above $550.
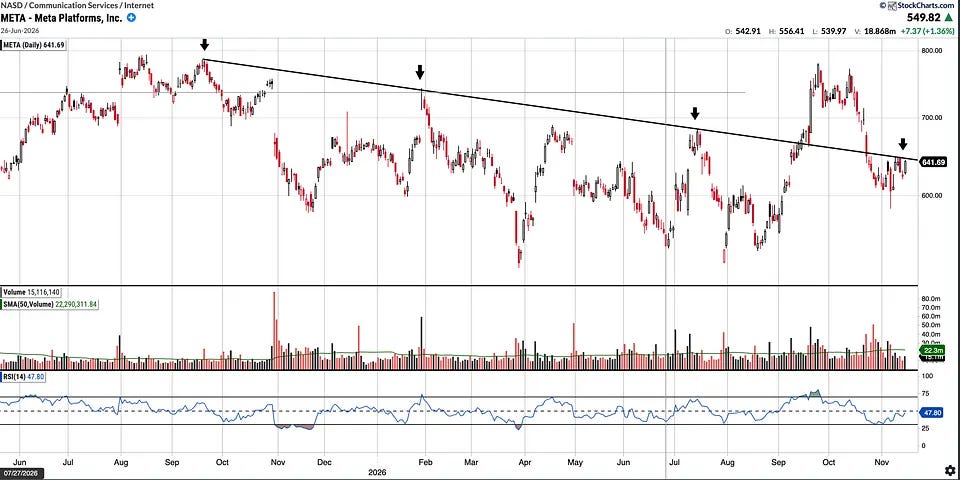
META (Currently Long)
Currently trades at $641.69, 5.59% below the 50SMA and 1.85% above the 200SMA.
RSI 47.80
-1.09% YTD
Whilst META was up 5.17% on the week, it continues to find resistance at the descending trendline from the September 2025 high (see arrows). META broke above the trendline back in September, but fell back below it in October. This week’s rally rejected right at it again (see last arrow). Bulls will want to see a decisive close back above the trendline.
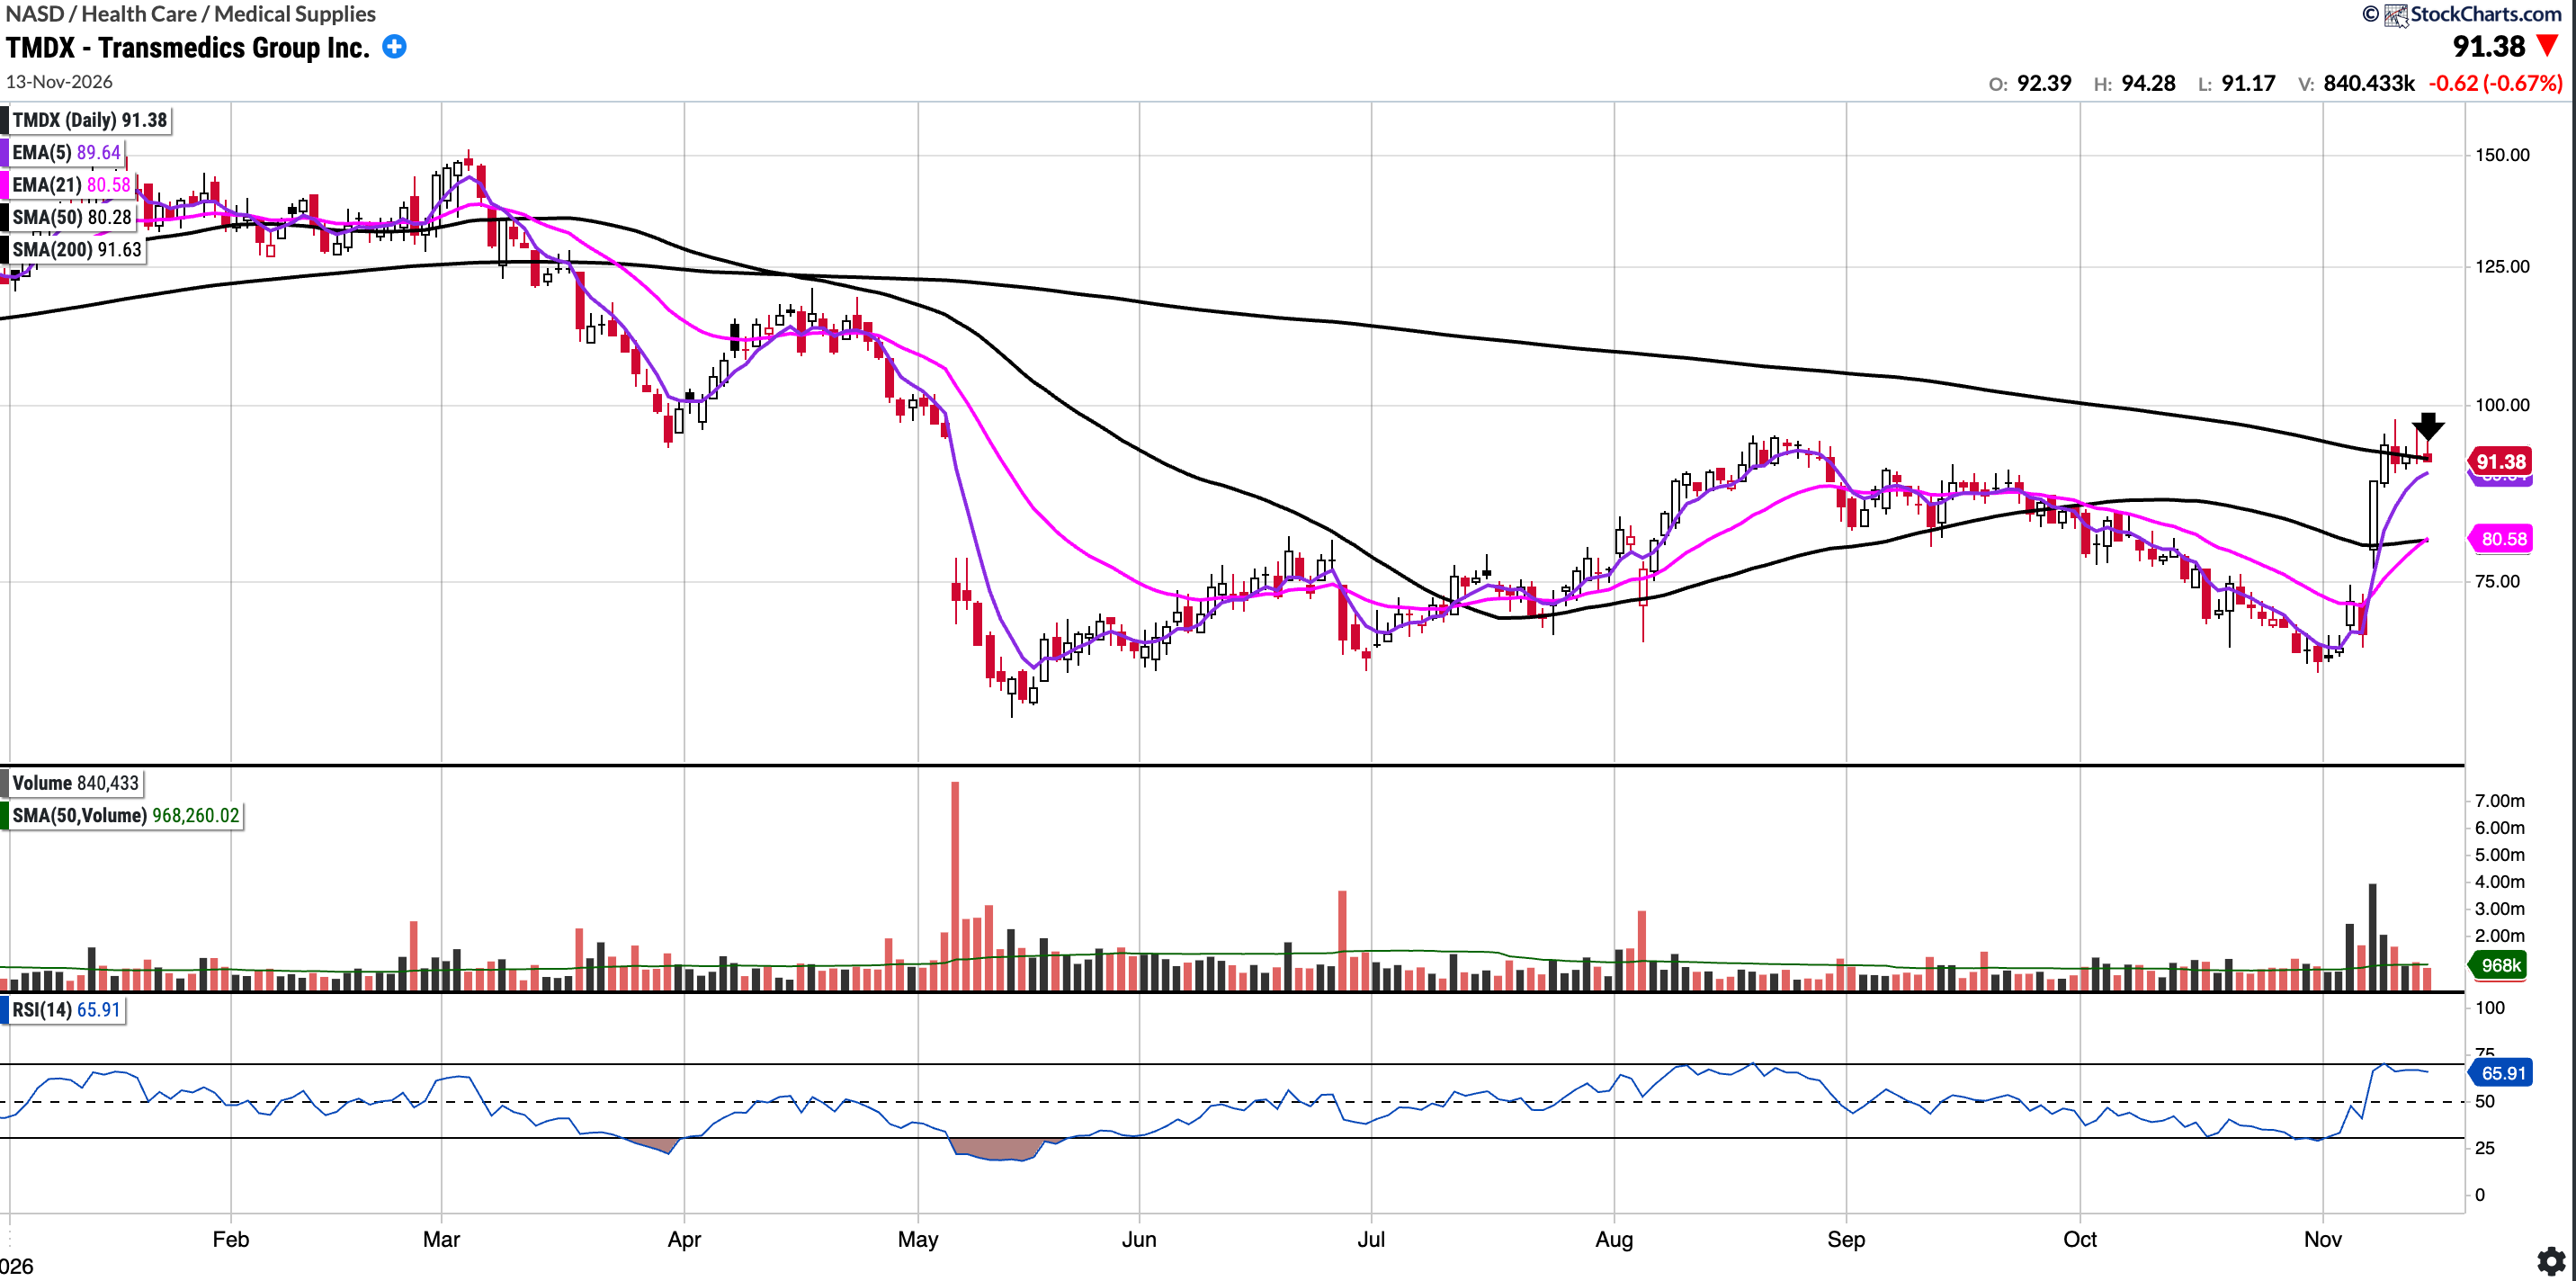
TMDX (Currently Long)
Currently trades at $91.38, 13.82% above the 50SMA and 0.28% below the 200SMA.
RSI 65.91
-25.52% YTD
TMDX has rallied off the lows following its strong earnings print, and spent this week trying to reclaim the 200-day SMA (see arrow), closing just below it. It is possibly in the early stages of a Stage 2 uptrend, but we would like to see the 200-day reclaimed and flipped to support. It could be an interesting one for the watchlist if and when it begins to trend.
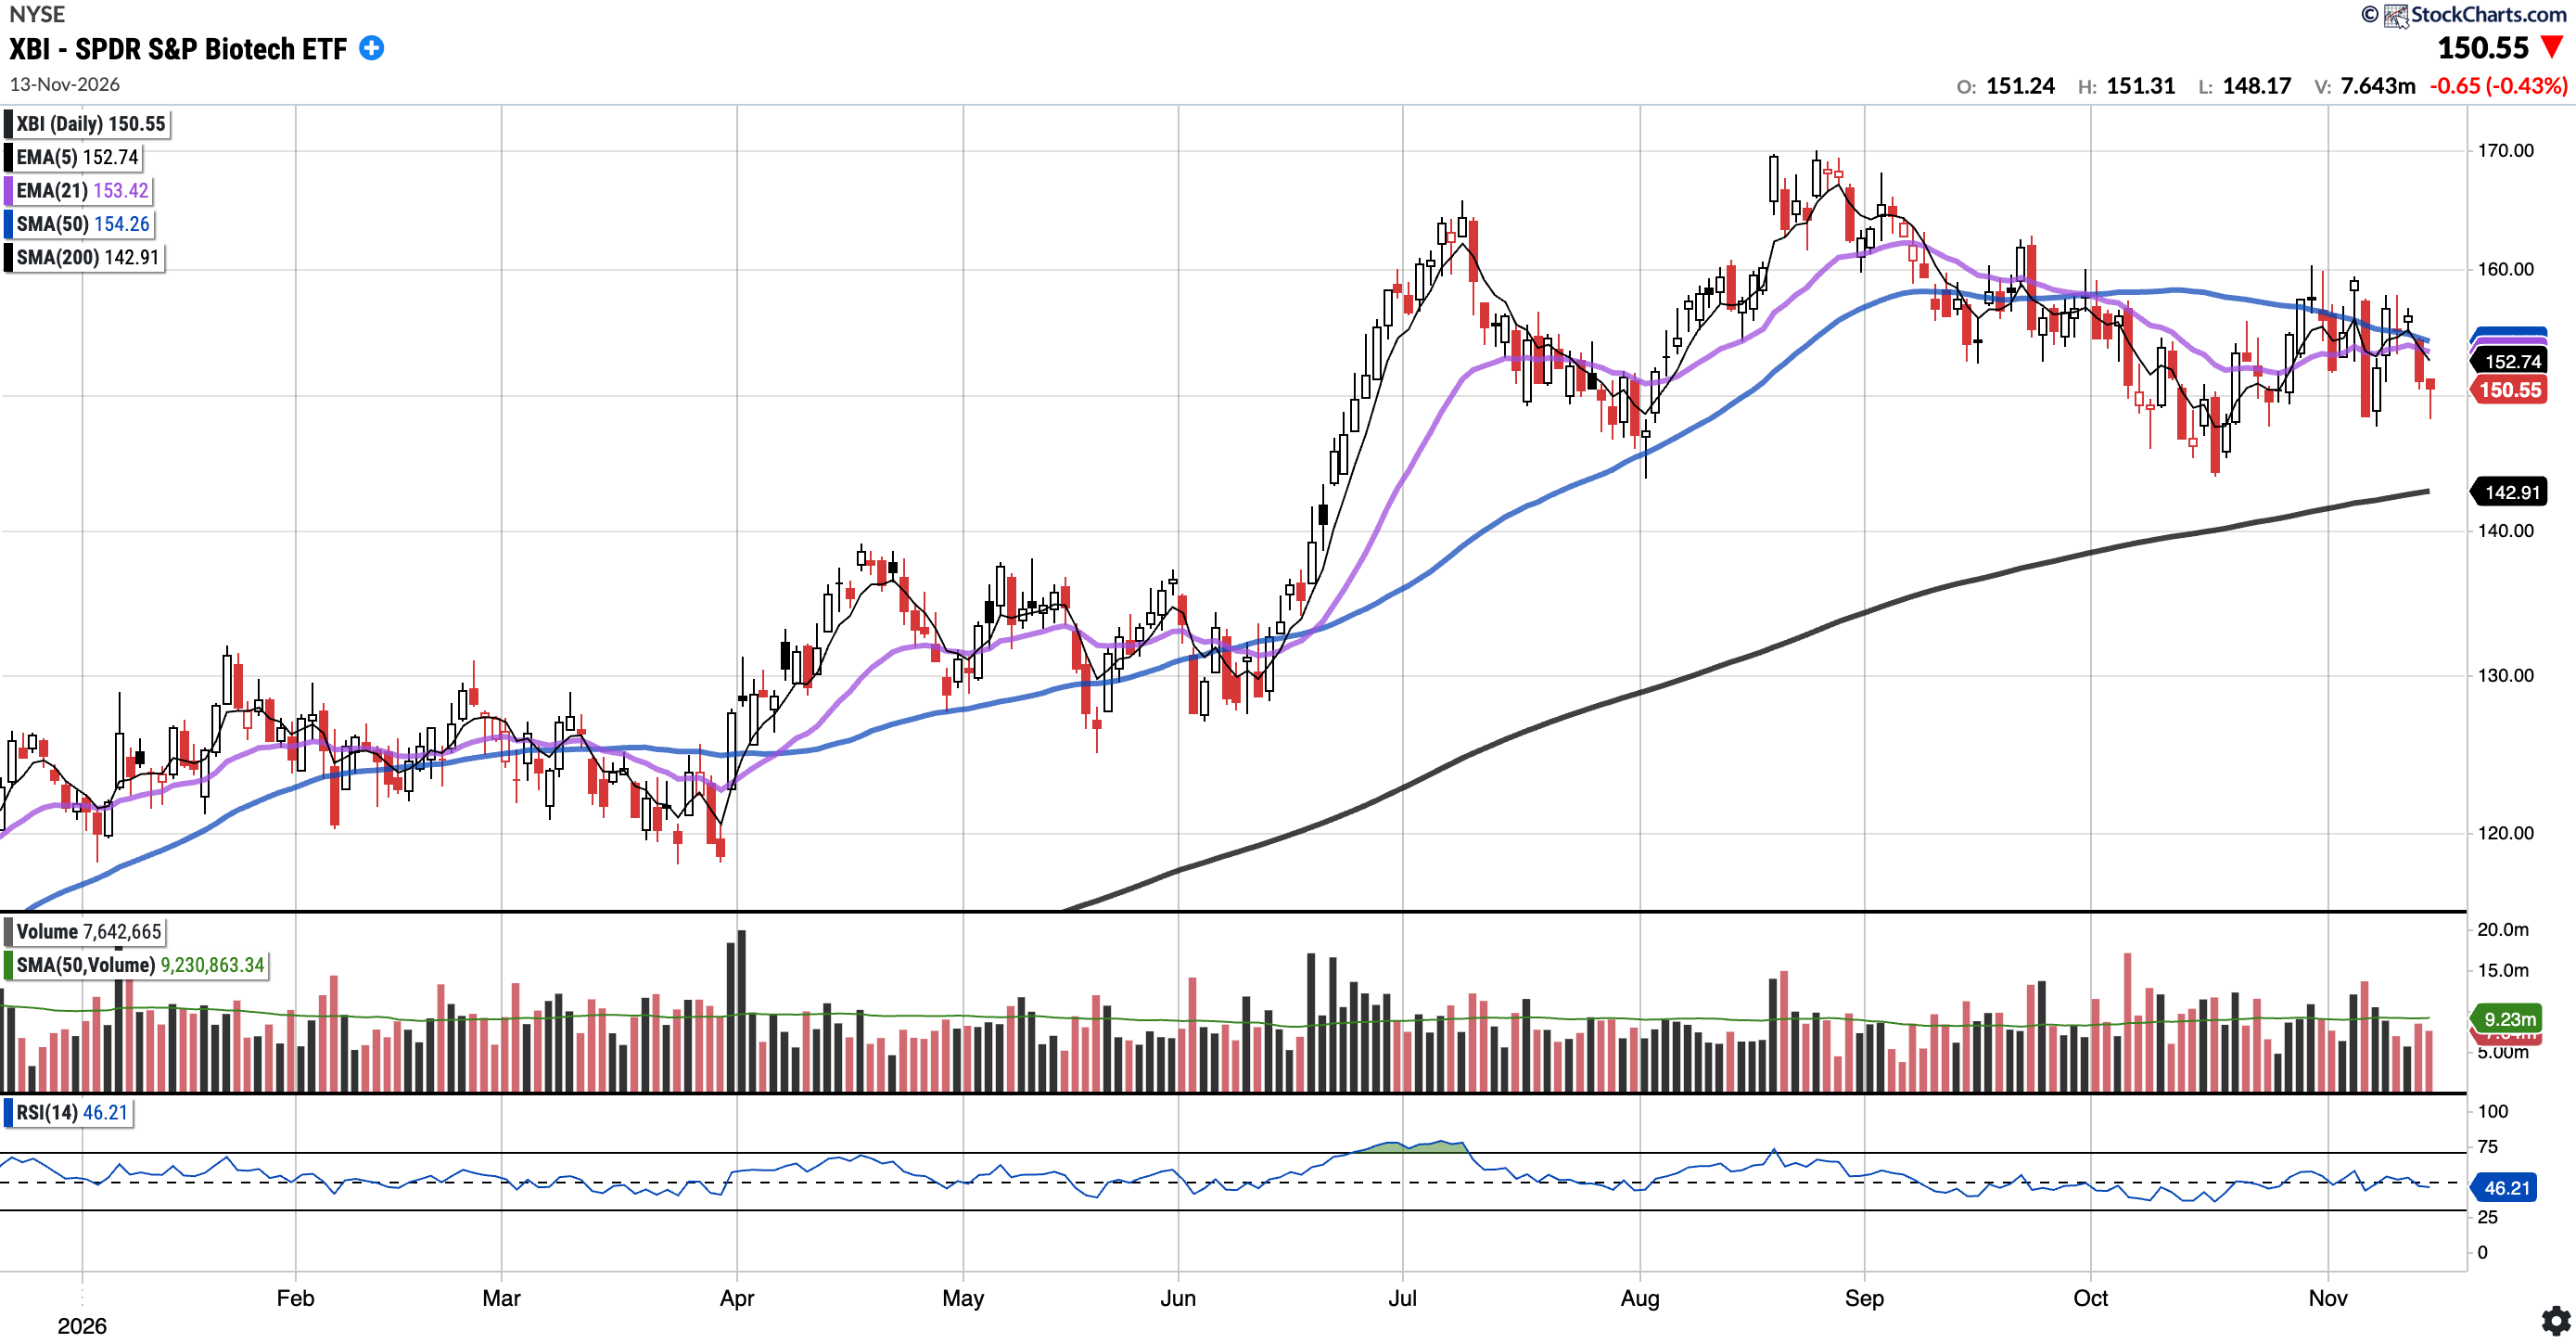
XBI
Currently trades at $150.55, 2.41% below the 50SMA and 5.35% above the 200SMA.
RSI 46.21
24.01% YTD
XBI reclaimed the $154 level flagged last week on Monday, but could not hold it. Thursday’s 3.27% drop took it back below $154 and its 21EMA and 50SMA, below all of its key moving averages. Bulls will want to see $154 reclaimed and held. Otherwise, the 200SMA ($142.91) remains the key support below.
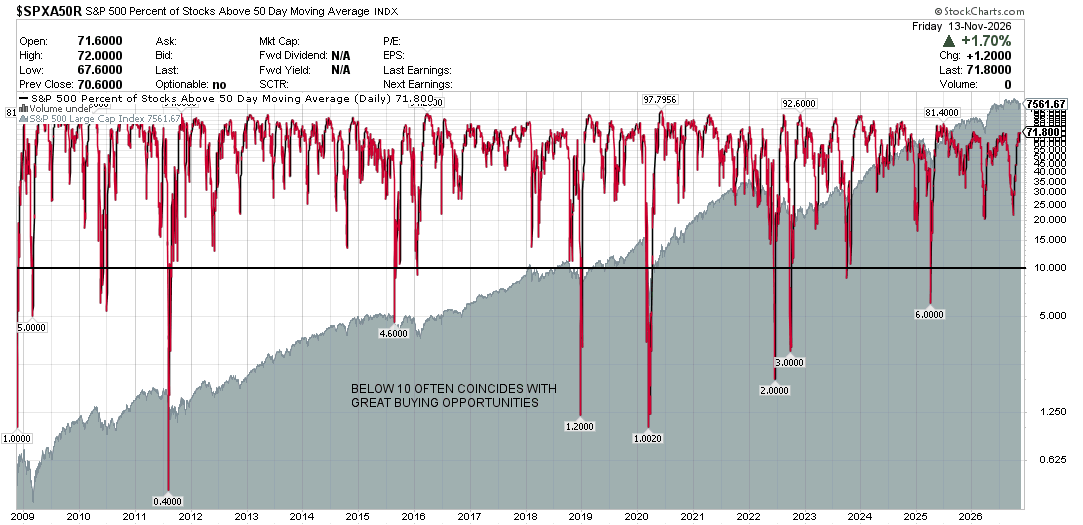
S&P 500 Percentage of Stocks Above the 50 Day Moving Average: Currently 71.80%
Breadth increased significantly this week, with the percentage of stocks above the 50-day moving average now at 71.80% compared to 62% last week.
Notable portfolio changes in previous week (all updated live in subscriber channels):
CRDO: Exited the position on round 4 for +13% weighted gain. 1st round was +50%, 2nd Round was +46%, 3rd round was 0% and 4th round +13%.