

Hope you all are having a good weekend. Below, we will be previewing the upcoming week’s events and providing a portfolio update as usual.
Format for what is covered in this weekly preview:
A Look at the Indices
Key Upcoming Economic Events
Upcoming Earnings
Charts
Current Portfolio Holdings (Scroll here for current positions)
Sizing | Cost Basis | Timeframe | Planned Moves
Closing Thoughts (Scroll here for my market commentary)
I recommend checking out the most recent in-depth Monthly Portfolio and Performance Update below.

For all readers a reminder that a premium subscription includes:
Live Portfolio updates (All Buys and Sells) in Subscriber only Channels
Favourite set-up Ideas, Market Memos plus Full archive
Monthly in depth portfolio & performance updates
Annual Tier: Discord access for live trading account updates and AMAs.
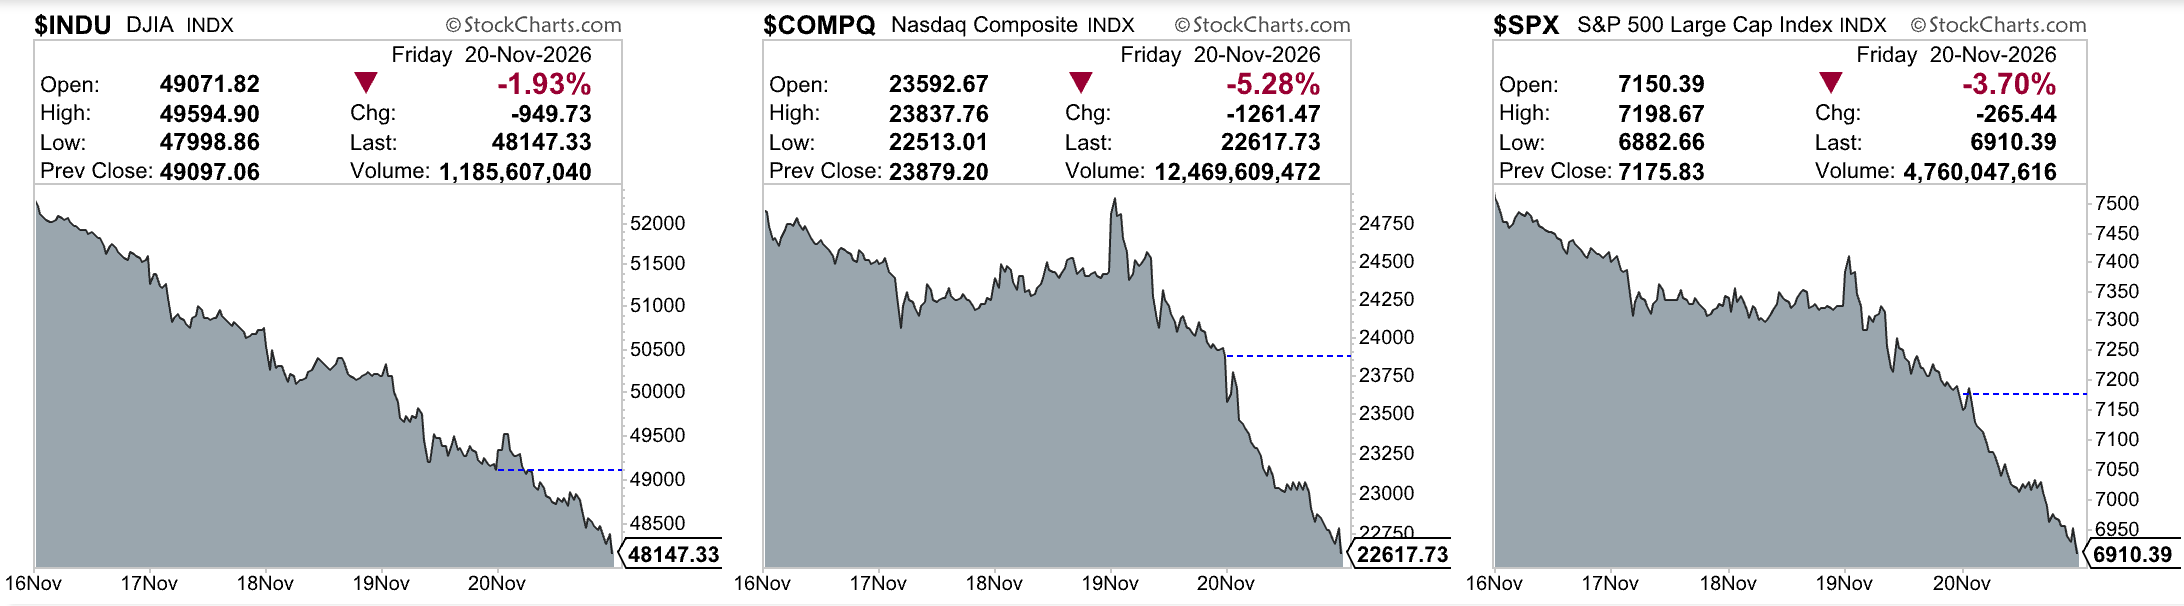
Indices
Dow Jones Industrial Average declined -8.02% in the last week
S&P 500 declined -8.61% in the last week
Nasdaq Composite declined -10.02% in the last week
IWM declined -7.54% in the last week
Key upcoming economic events
Monday, November 23
S&P Global Flash PMIs (November)
Fed speaker: Williams
Tuesday, November 24
Conference Board Consumer Confidence (November)
Wednesday, November 25
Personal Income and Outlays, including PCE (October)
GDP, second estimate (Q3)
Durable Goods (October)
Initial and Continuing Jobless Claims (brought forward for Thanksgiving)
Fed Beige Book
Thursday, November 26
US markets closed for Thanksgiving
Friday, November 27
US stock market early close at 1:00 PM ET
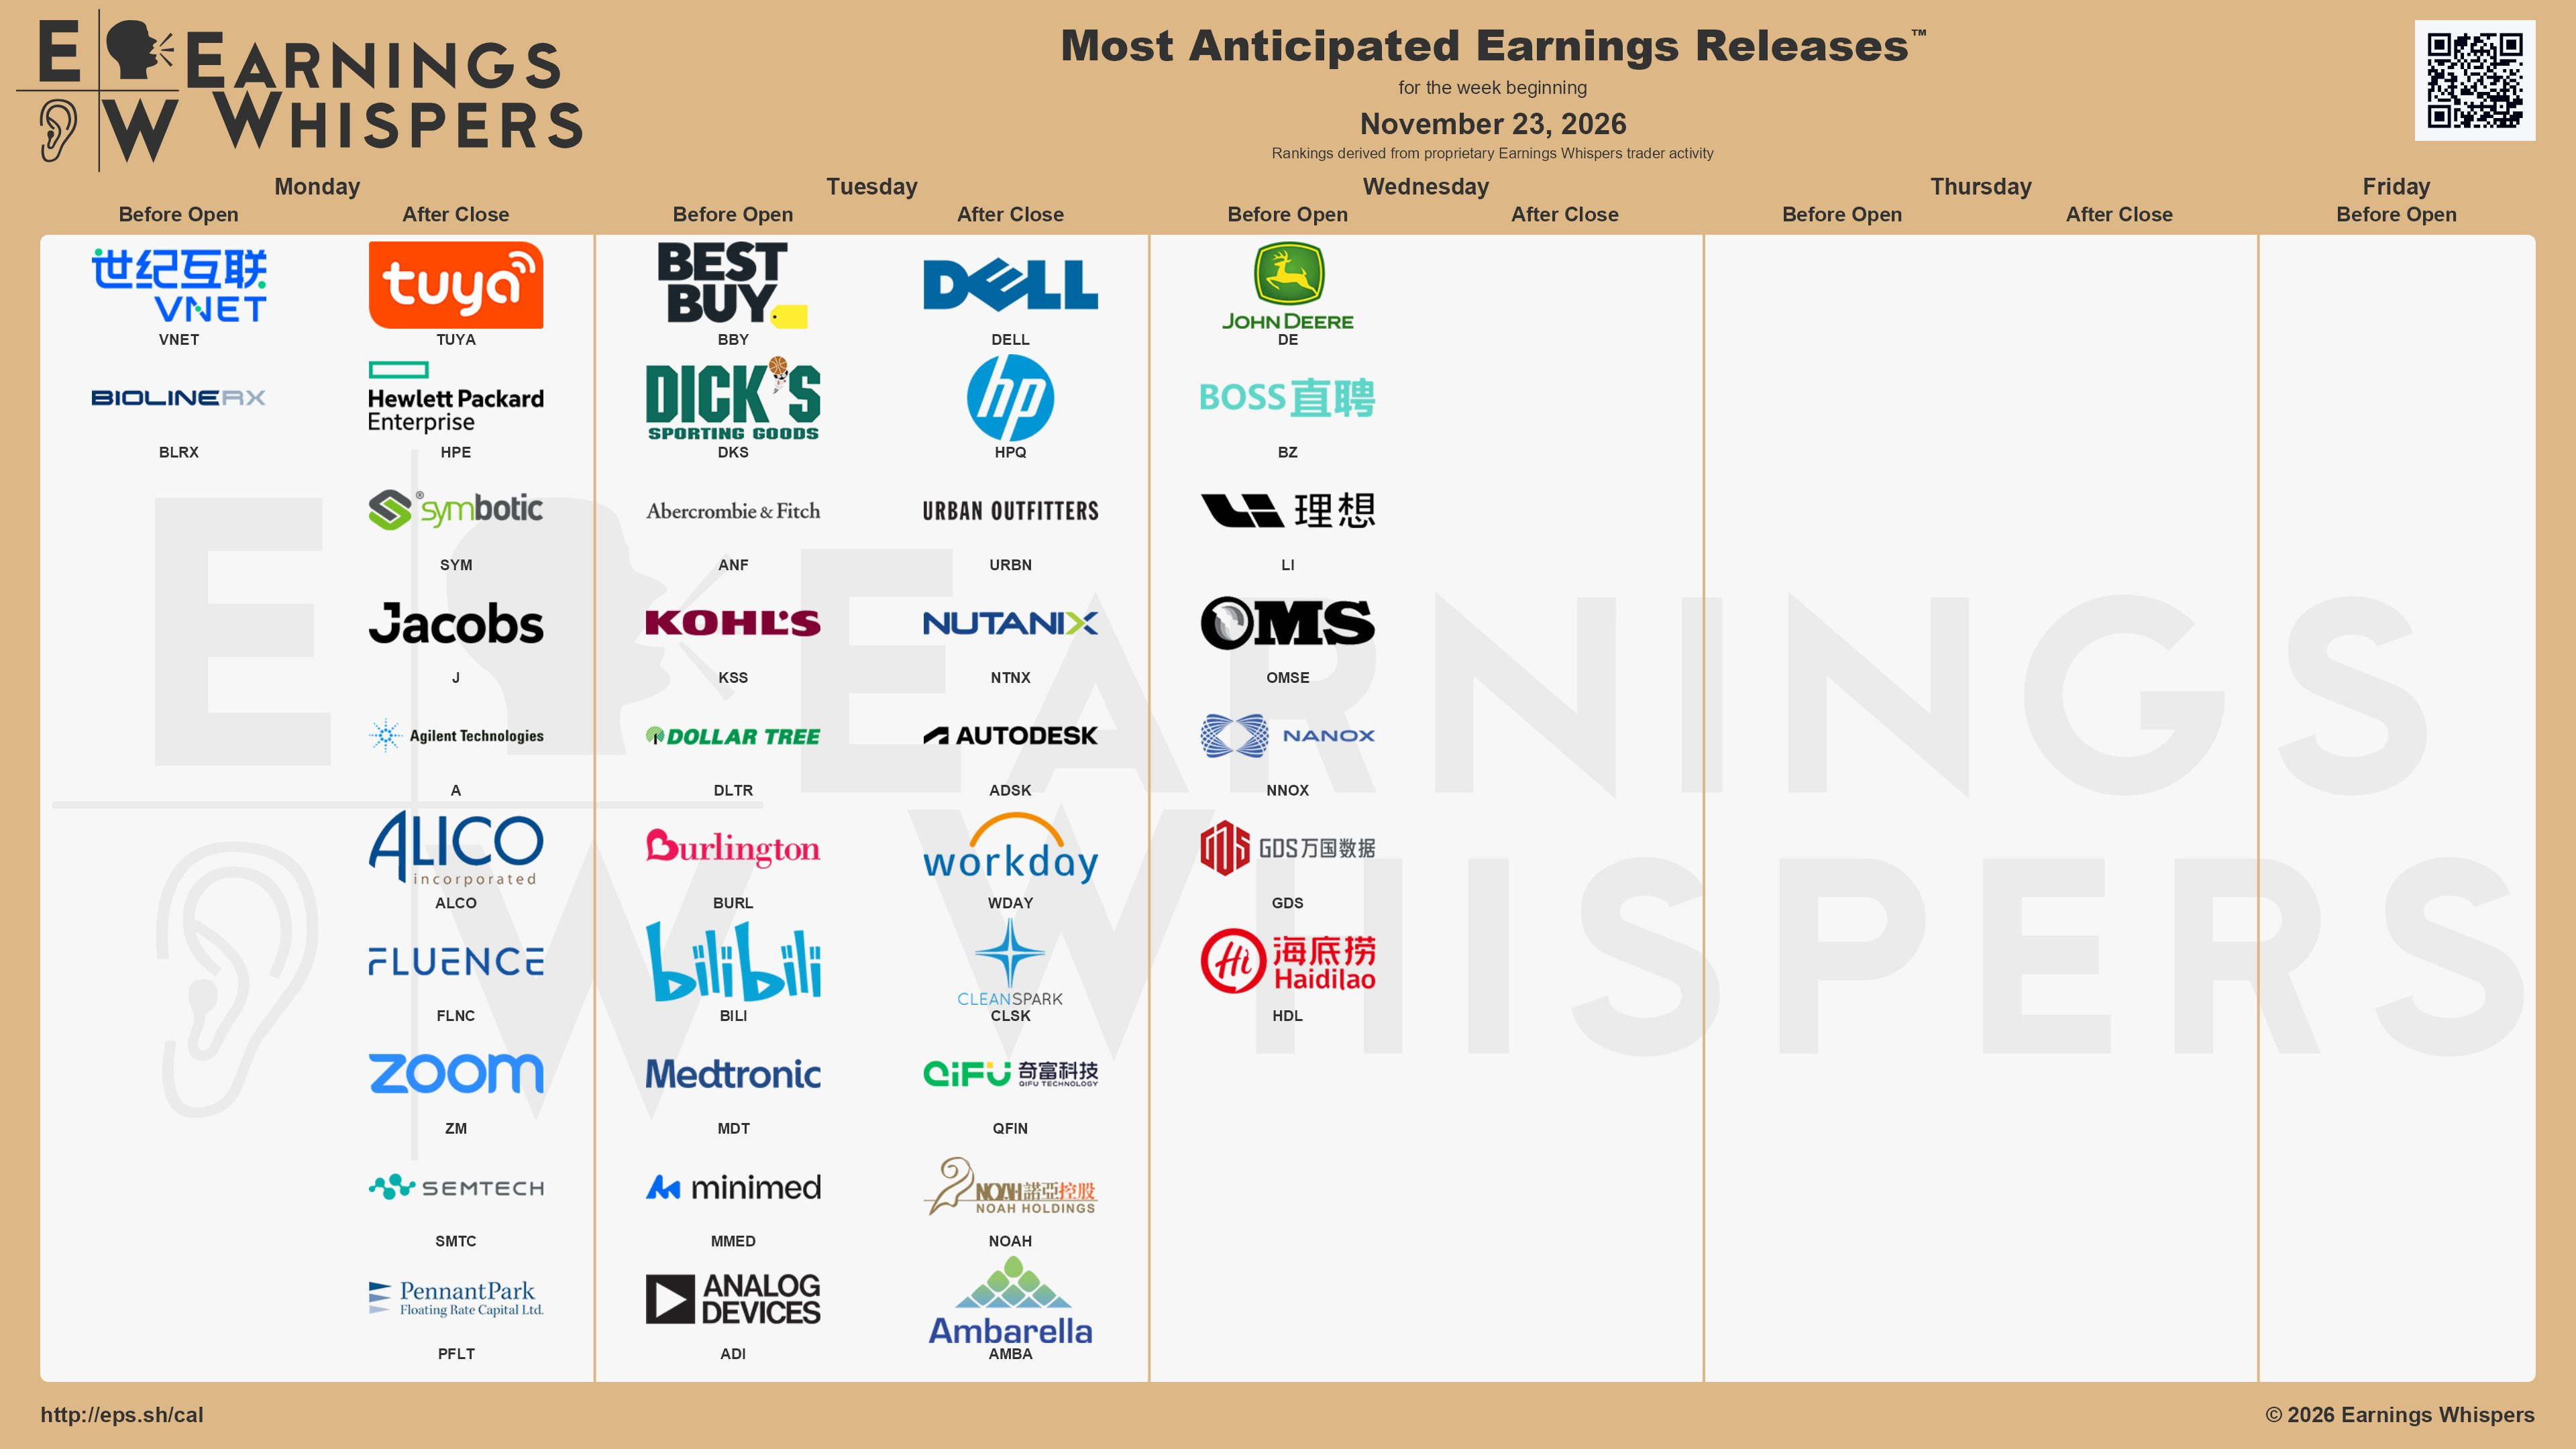
Upcoming Earnings
Below is the infographic by Earnings Whispers highlighting the schedule for this week:
Charts
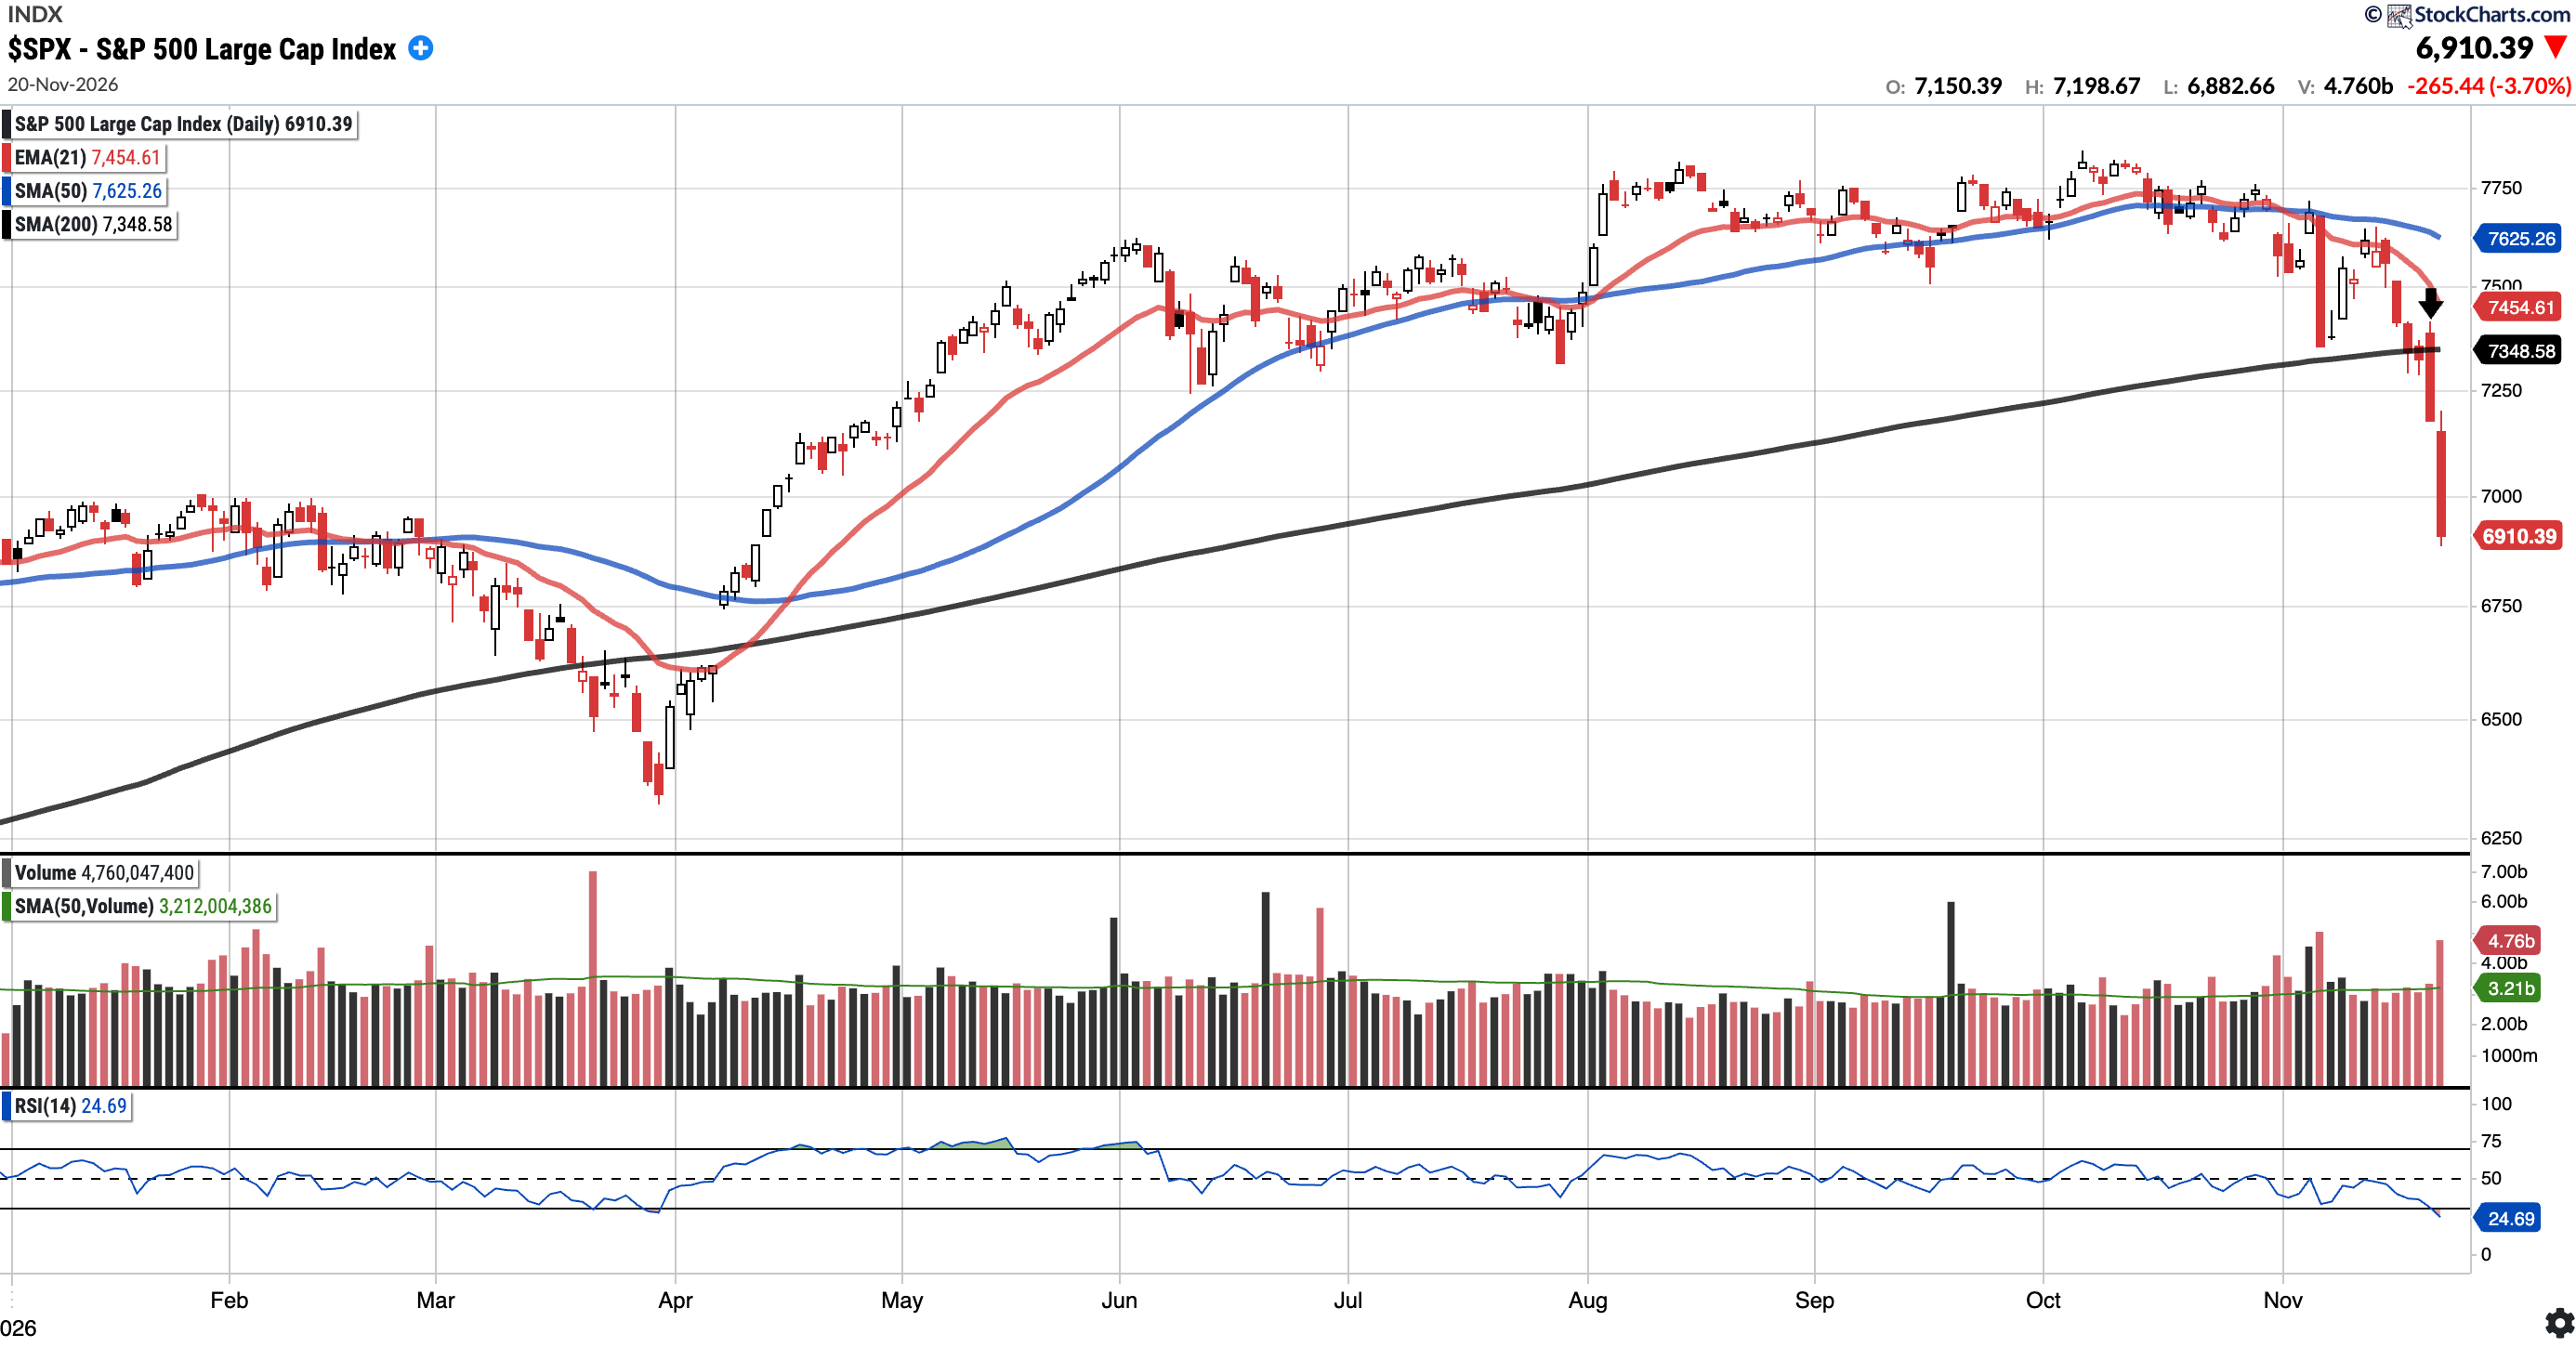
SPX
Currently trades at $6,910.39, 9.37% below the 50SMA and 5.96% below the 200SMA.
RSI 24.69
0.76% YTD
Distribution days in the last week: 4
The S&P 500 fell 8.61% this week, and Friday was its seventh losing session in a row. Last week the 200-day SMA held as support, but it gave way on Tuesday. Thursday’s early bounce attempt (on the back of the Anthropic IPO) reversed (see arrow), and Friday’s 3.70% drop left the index almost 6% below the 200-day. Bulls will want to see the 200-day SMA ($7,348.58) reclaimed first, with the 21-day EMA ($7,454.61) above that.
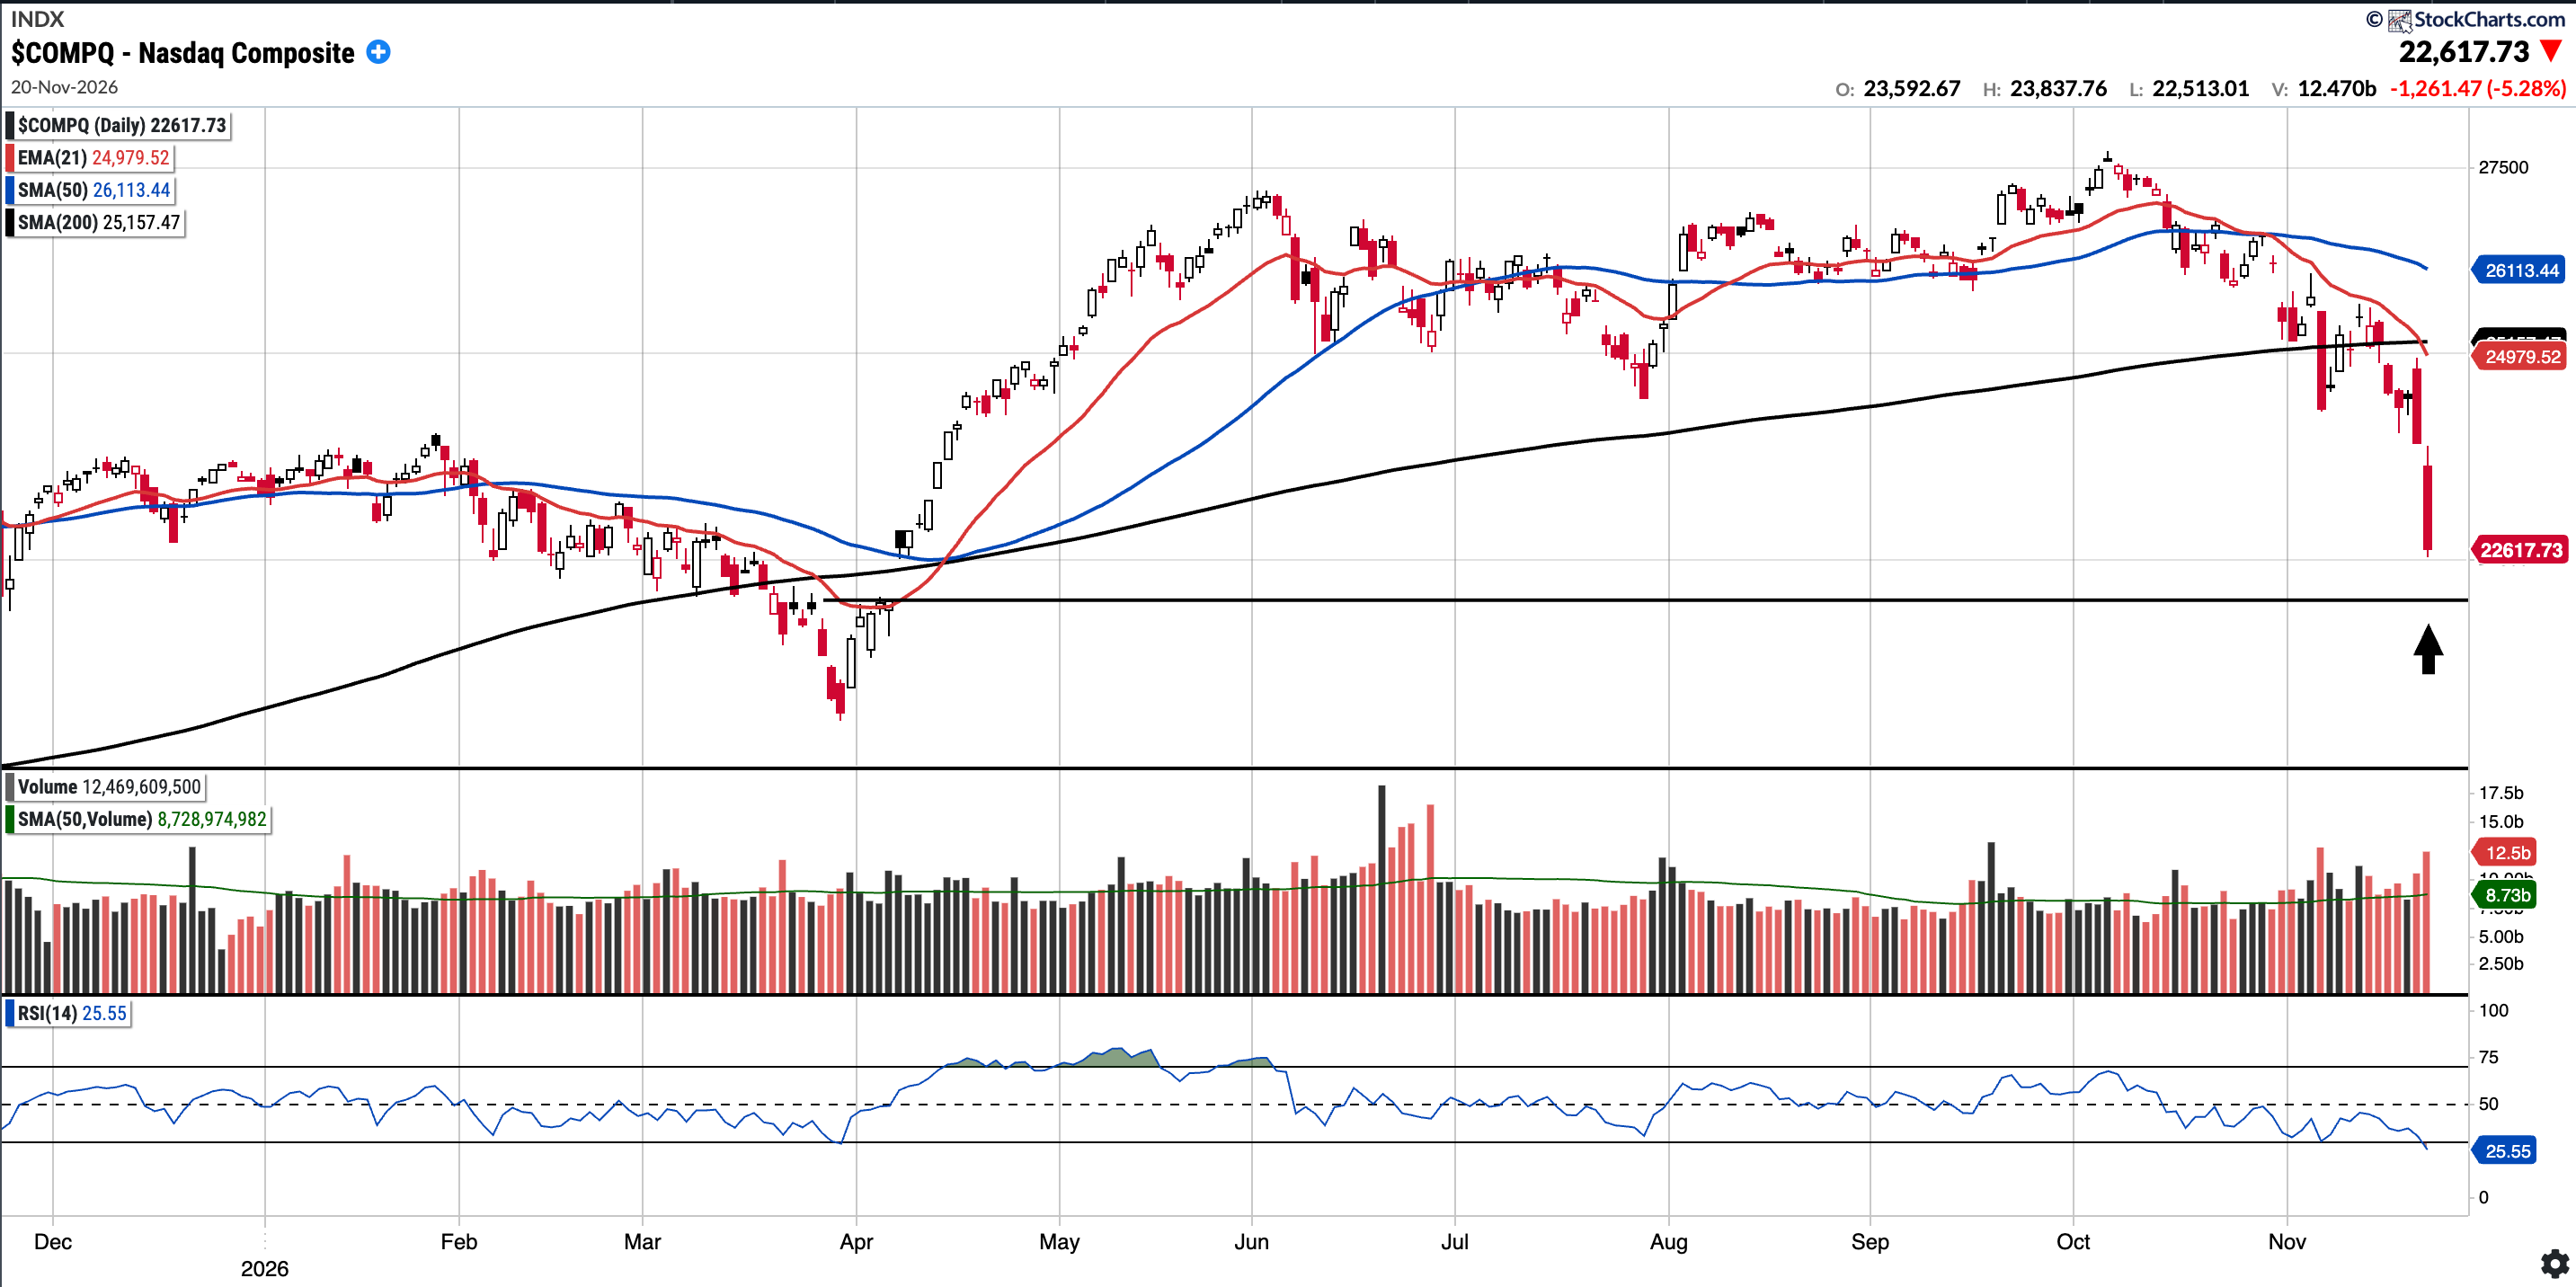
COMPQ
Currently trades at $22,617.73, 13.39% below the 50SMA and 10.10% below the 200SMA.
RSI 25.55
-2.66% YTD
Distribution days in the last week: 3
Last week COMPQ closed right on the 200-day SMA. This week, it lost the level on Monday and in total fell 10.02% on the week! Friday’s drop came on the heaviest volume of the week (Notably the QQQ traded its highest volume since August 2022) The gap from April is now potentially in play for a fill at ~22,050 (see arrow). Bulls will want to see the 200-day SMA ($25,157.47) reclaimed, which is now more than 10% overhead.
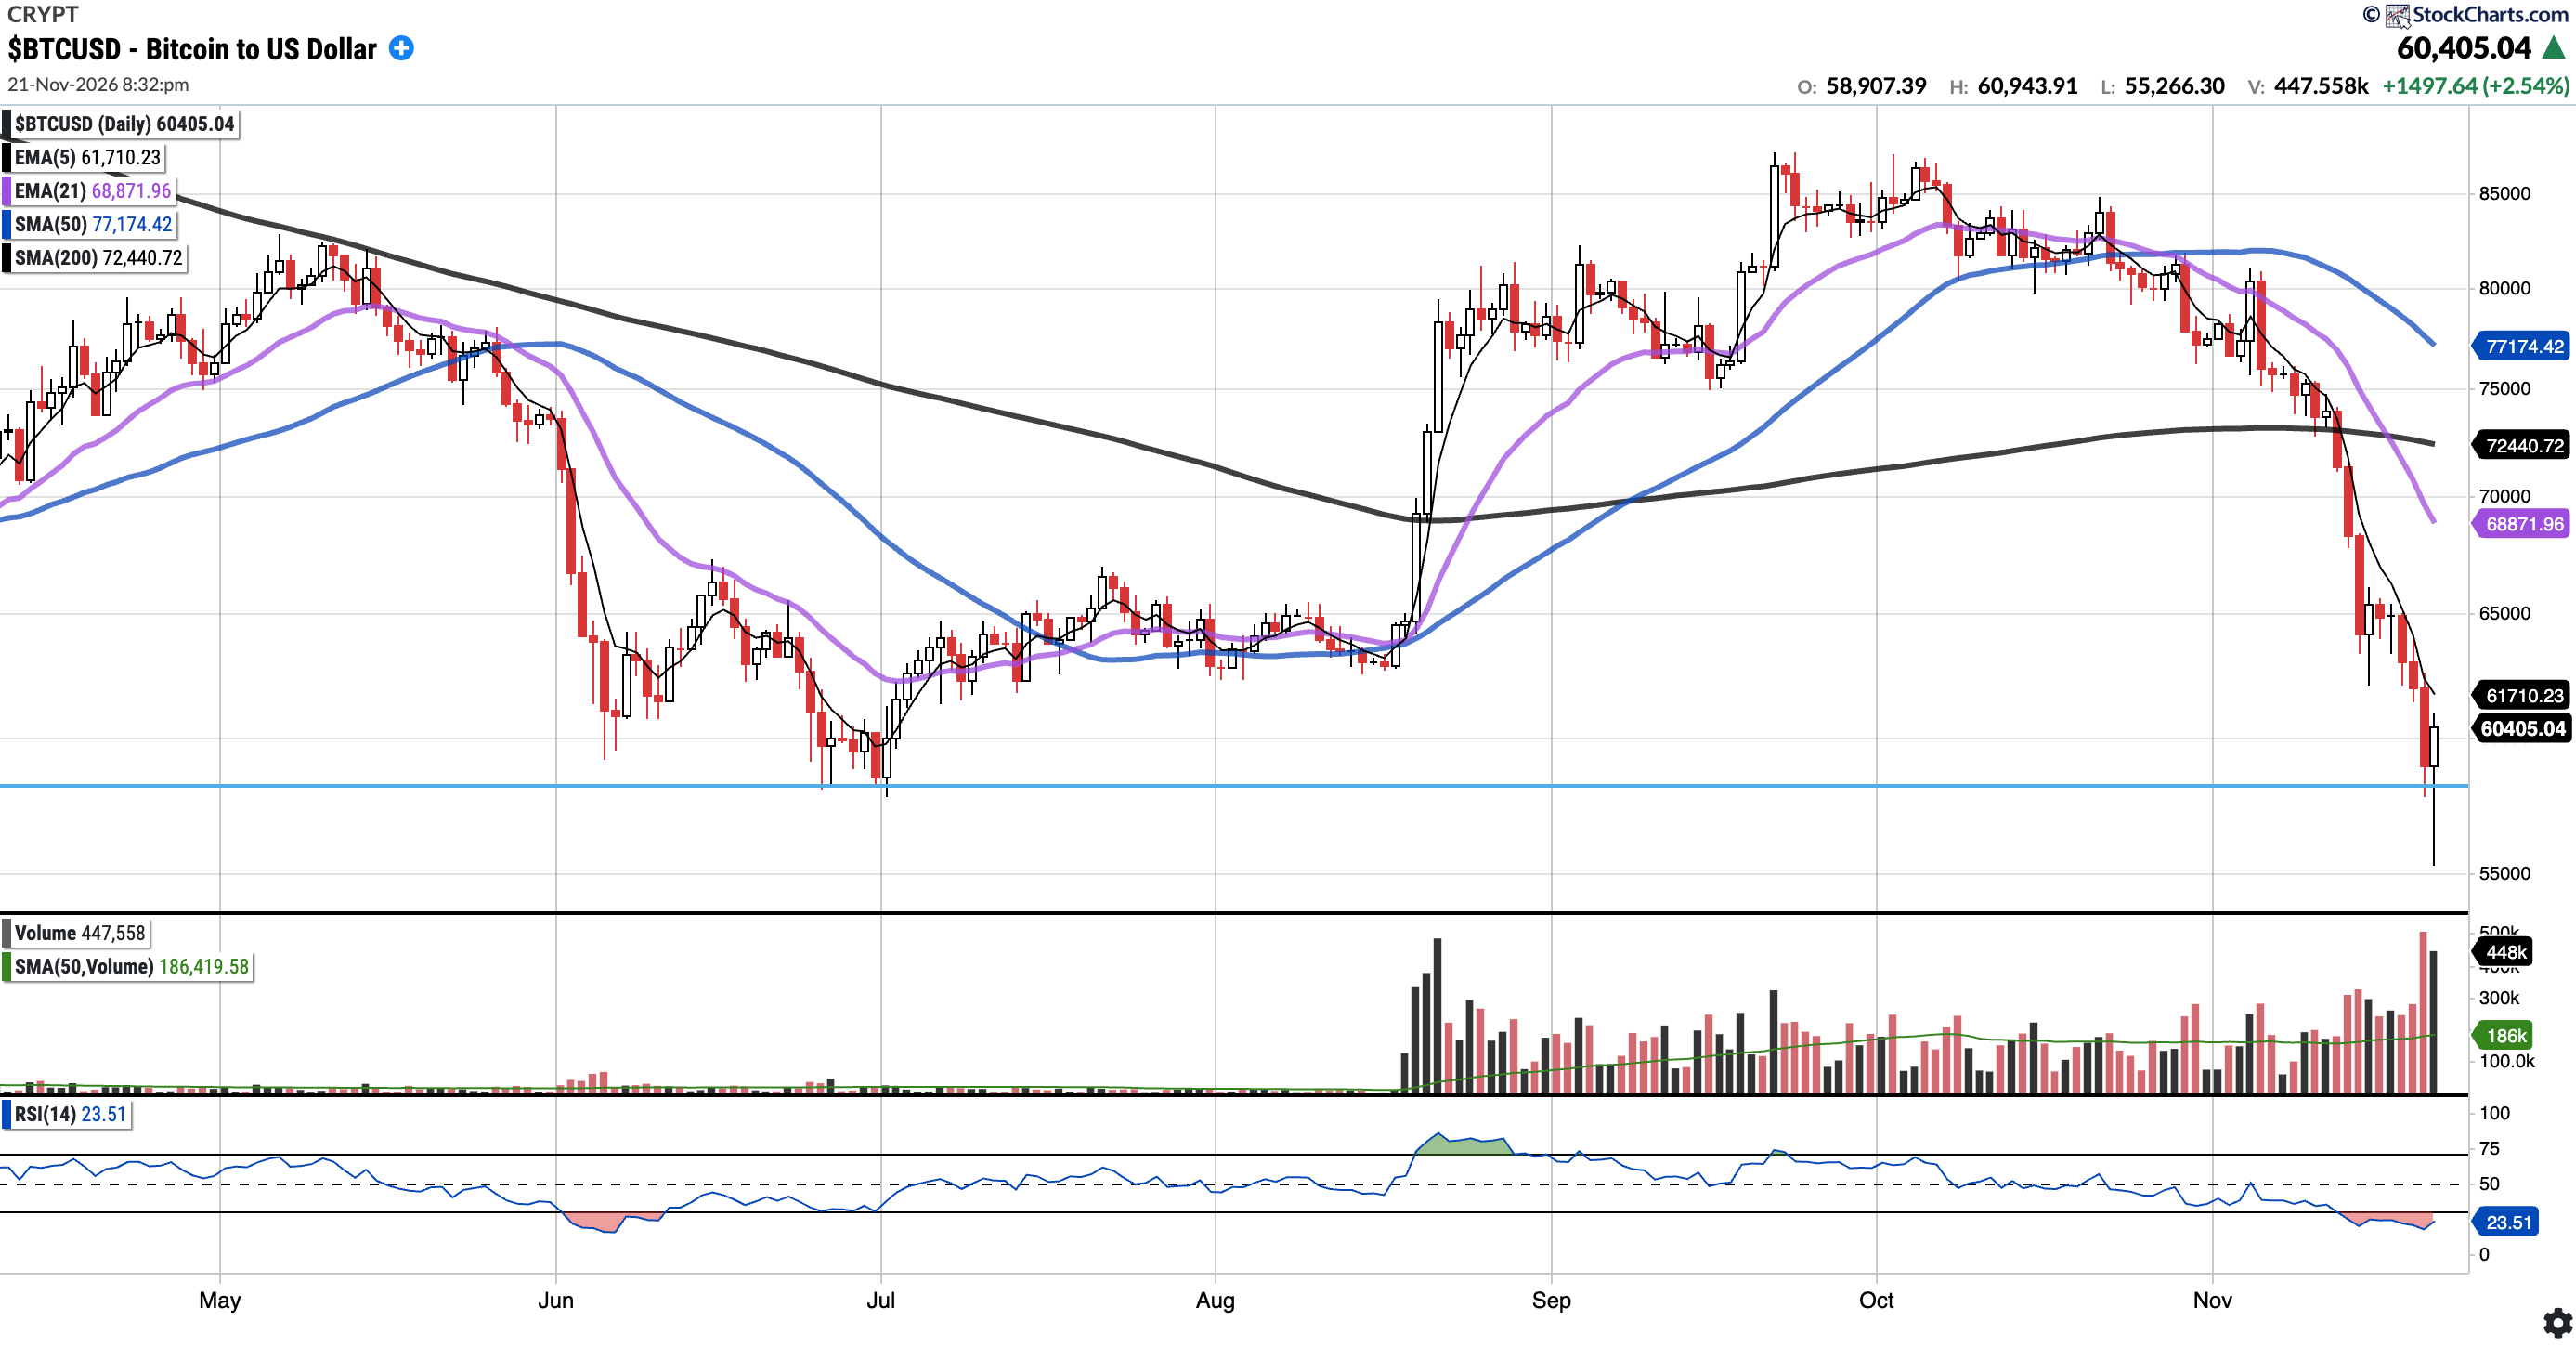
BTC (currently Long)
Currently trades at $60,361.10, 21.79% below the 50SMA and 16.67% below the 200SMA.
RSI 23.35
-31.98% YTD
As of Saturday, November 21 at 3:27 PM EST (8:27 PM GMT), BTC is trading at $60,361.10. The selling continued all week and took BTC down to the June–July lows around $58K. Saturday morning it briefly wicked through them to $55,266.30, but buyers stepped in, and it is now up 2.47% on the day, back above $60K. Volume on the reversal is well above average. Bulls will want a daily close back above the June–July lows, followed by a reclaim of the 5EMA ($61,695.58). The 21EMA ($68,867.97) is the first major moving average resistance, with the 200SMA ($72,440.50) and 50SMA ($77,173.54) above that.
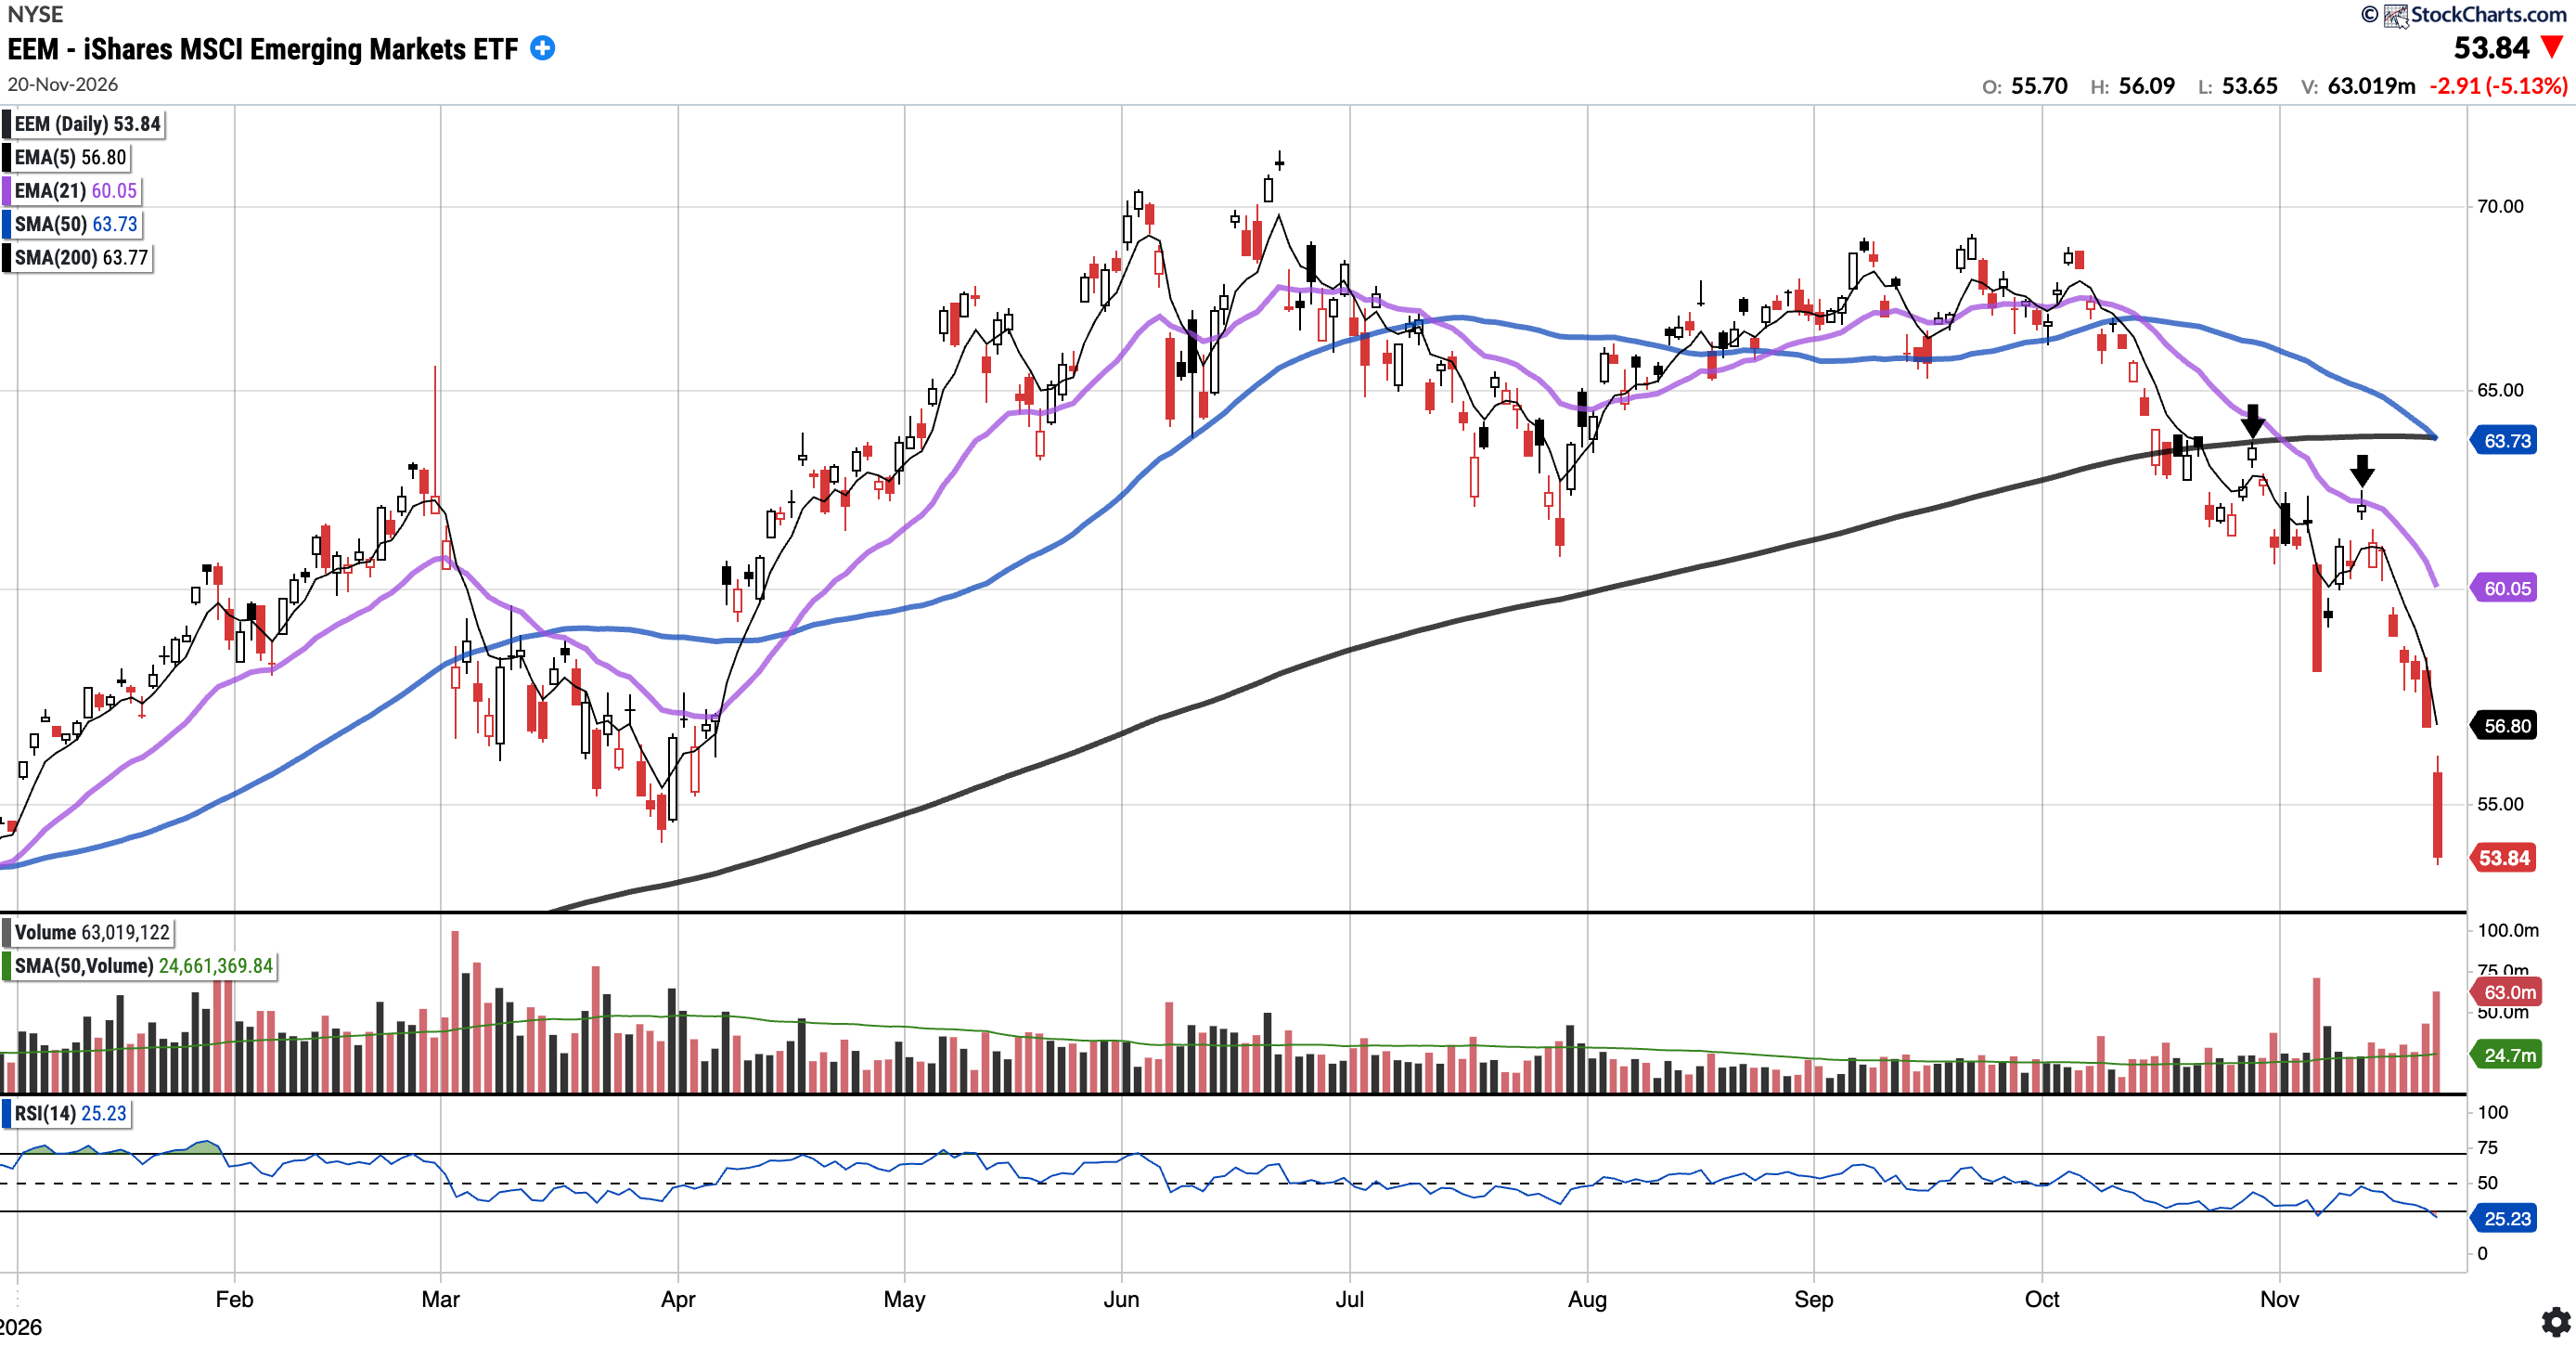
EEM
Currently trades at $53.84, 15.52% below the 50SMA and 15.58% below the 200SMA.
RSI 25.23
-3.77% YTD
Last week, EEM was rejected at the 21-day EMA (see second down arrow). This week, the selling accelerated and EEM fell 11.62%. Friday’s drop took it below the late-March low ($54.44). The 50-day SMA is also about to cross below the 200-day SMA. Bulls will want to see $54.44 reclaimed, followed by the 21-day EMA ($60.05).
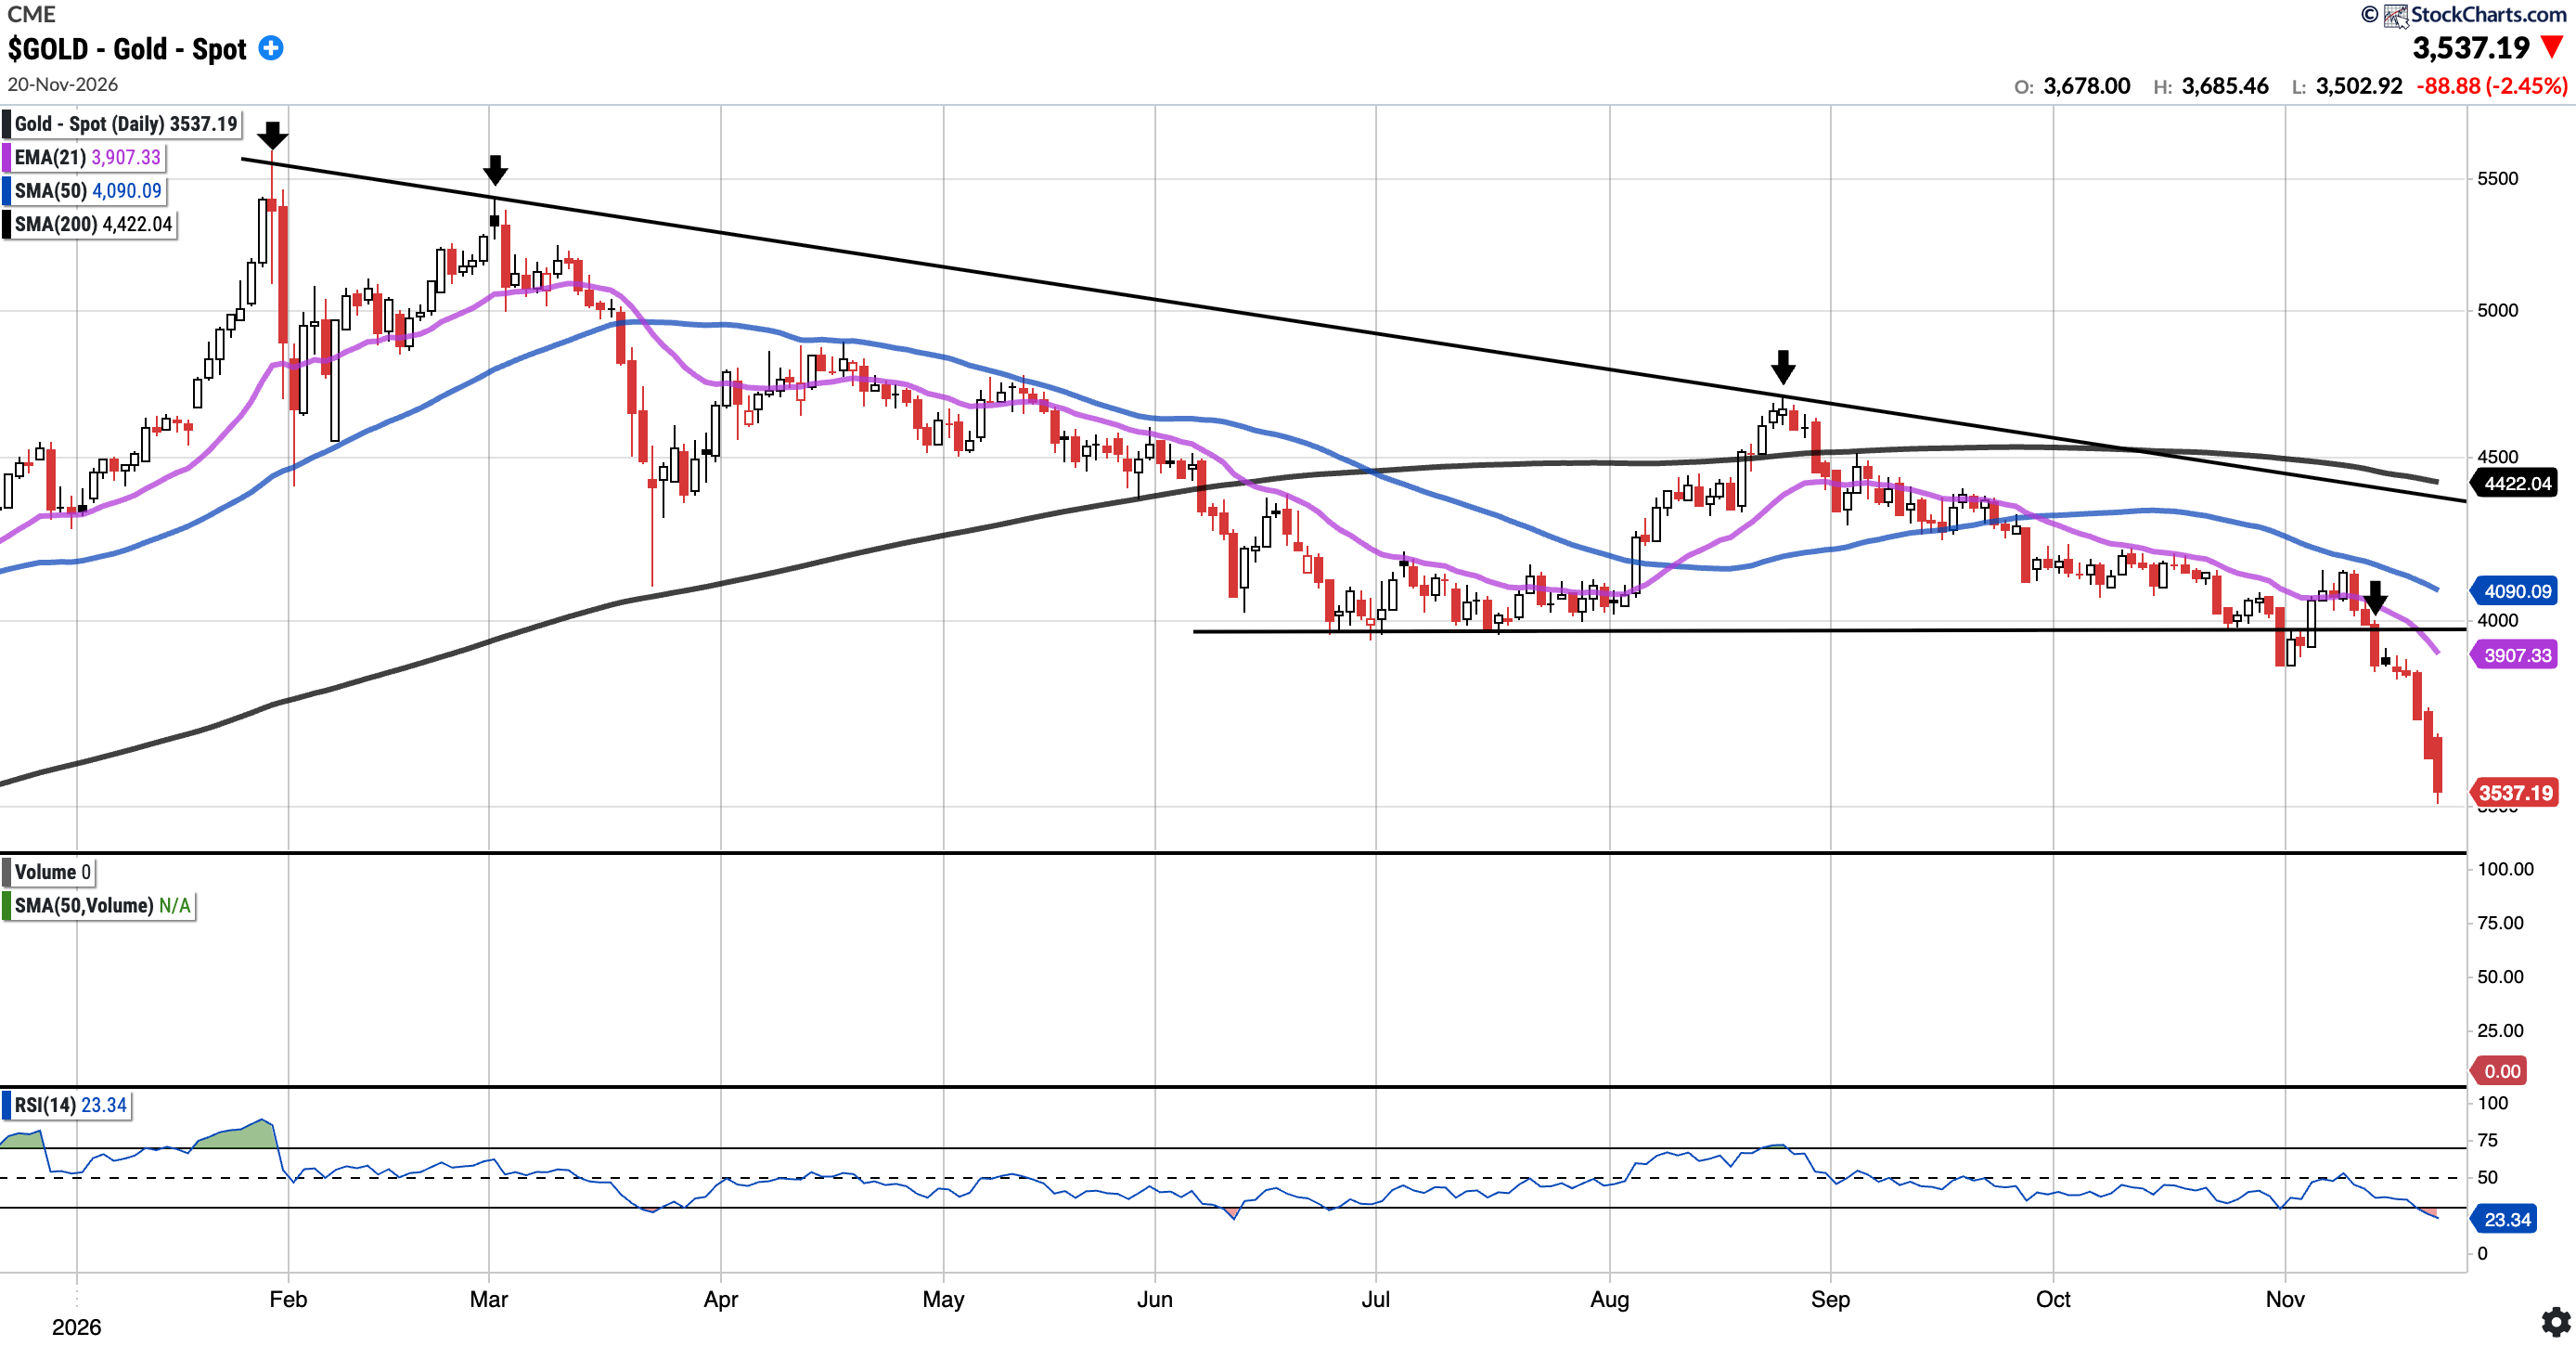
GOLD (Long Physical)
Currently trades at $3,537.19, 13.52% below the 50SMA and 20.01% below the 200SMA.
RSI 23.34
-18.18% YTD
Last week, gold was rejected at the 21EMA (see last down arrow) and fell back below the $3,950–$4,000 zone. This week, the breakdown followed through, with most of the damage occurring in the last three sessions. Gold closed the week down 8.92%. The $3,950–$4,000 zone, which held as support from June through October, is now overhead resistance. Bulls will want to see the 21EMA ($3,907.33) and then the $3,950–$4,000 zone reclaimed. The 50SMA and the descending trendline from the January highs sit further overhead.
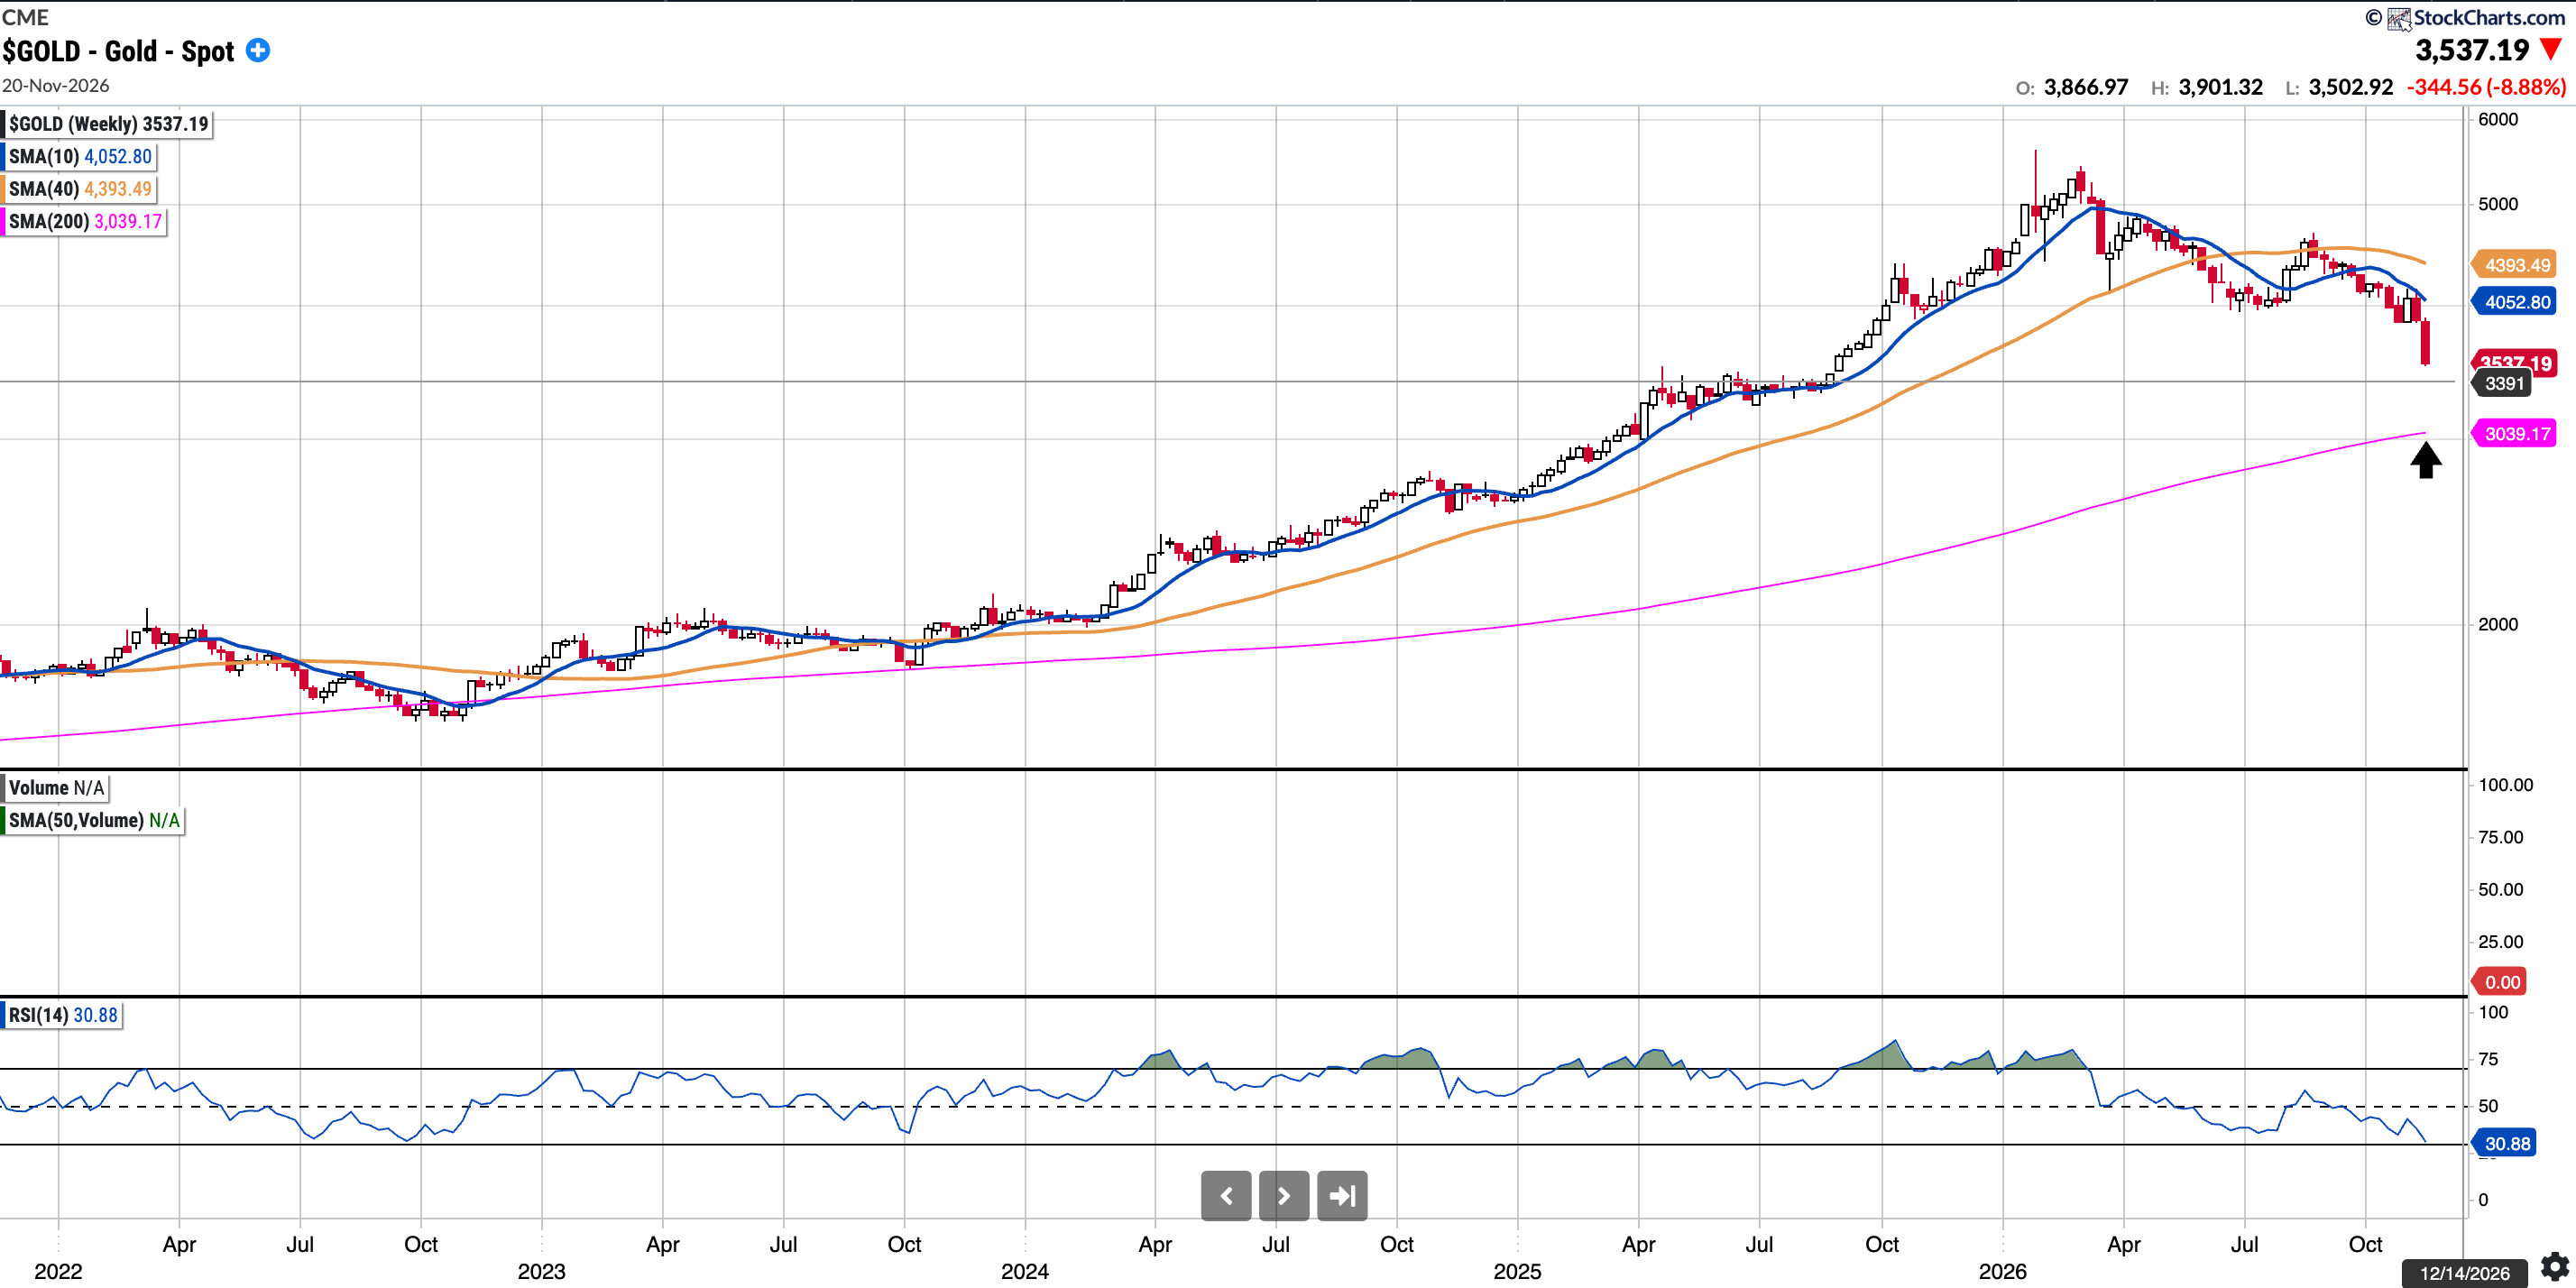
The weekly chart is below. A re-test of the 200 week may be an interesting spot from a risk reward perspective to add exposure. I personally hold physical only and may add there.
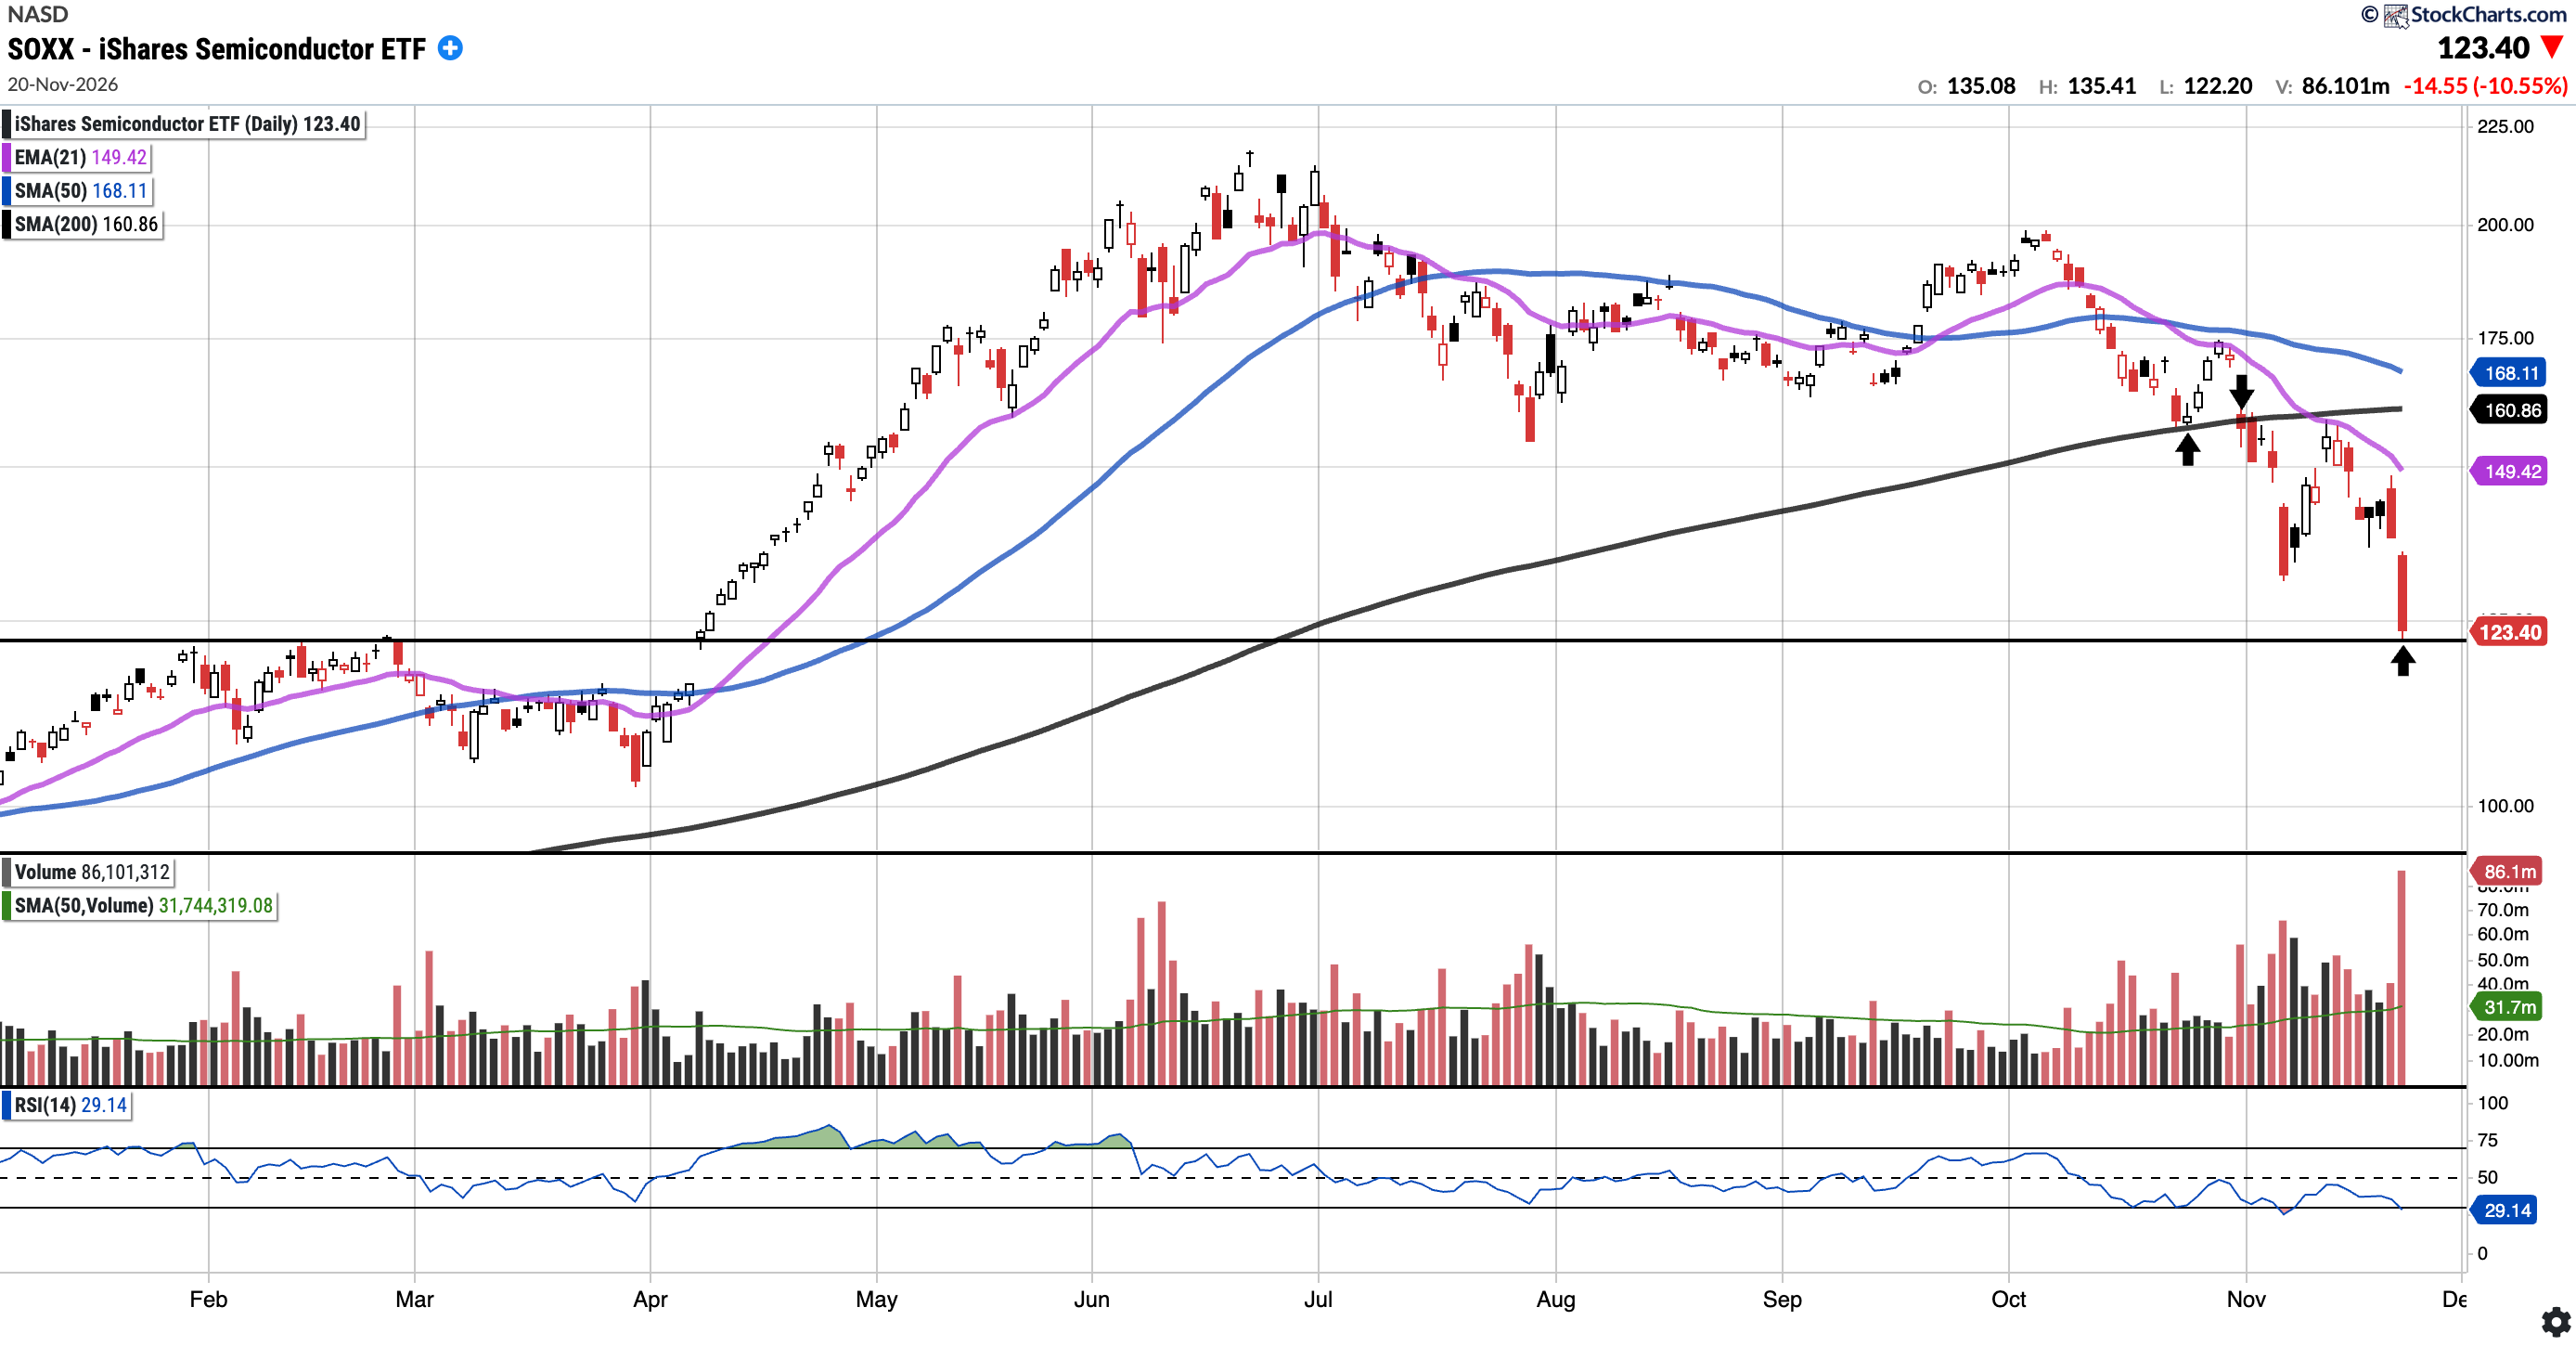
SOXX
Currently trades at $123.40, 26.60% below the 50SMA and 23.29% below the 200SMA.
RSI 29.14
18.22% YTD
Last week SOXX was rejected at the 21EMA and 200SMA zone around $160. This week it fell 17.35% and closed right on the ~$123 level that capped the February highs (see up arrow), after an intraday low of $122.20. Bulls will want this level to hold, with the 21EMA ($149.42) as the first meaningful moving average level to reclaim. Of note, on Friday, SOXX printed a highest-ever volume candle, so there is an element of capitulation out there.
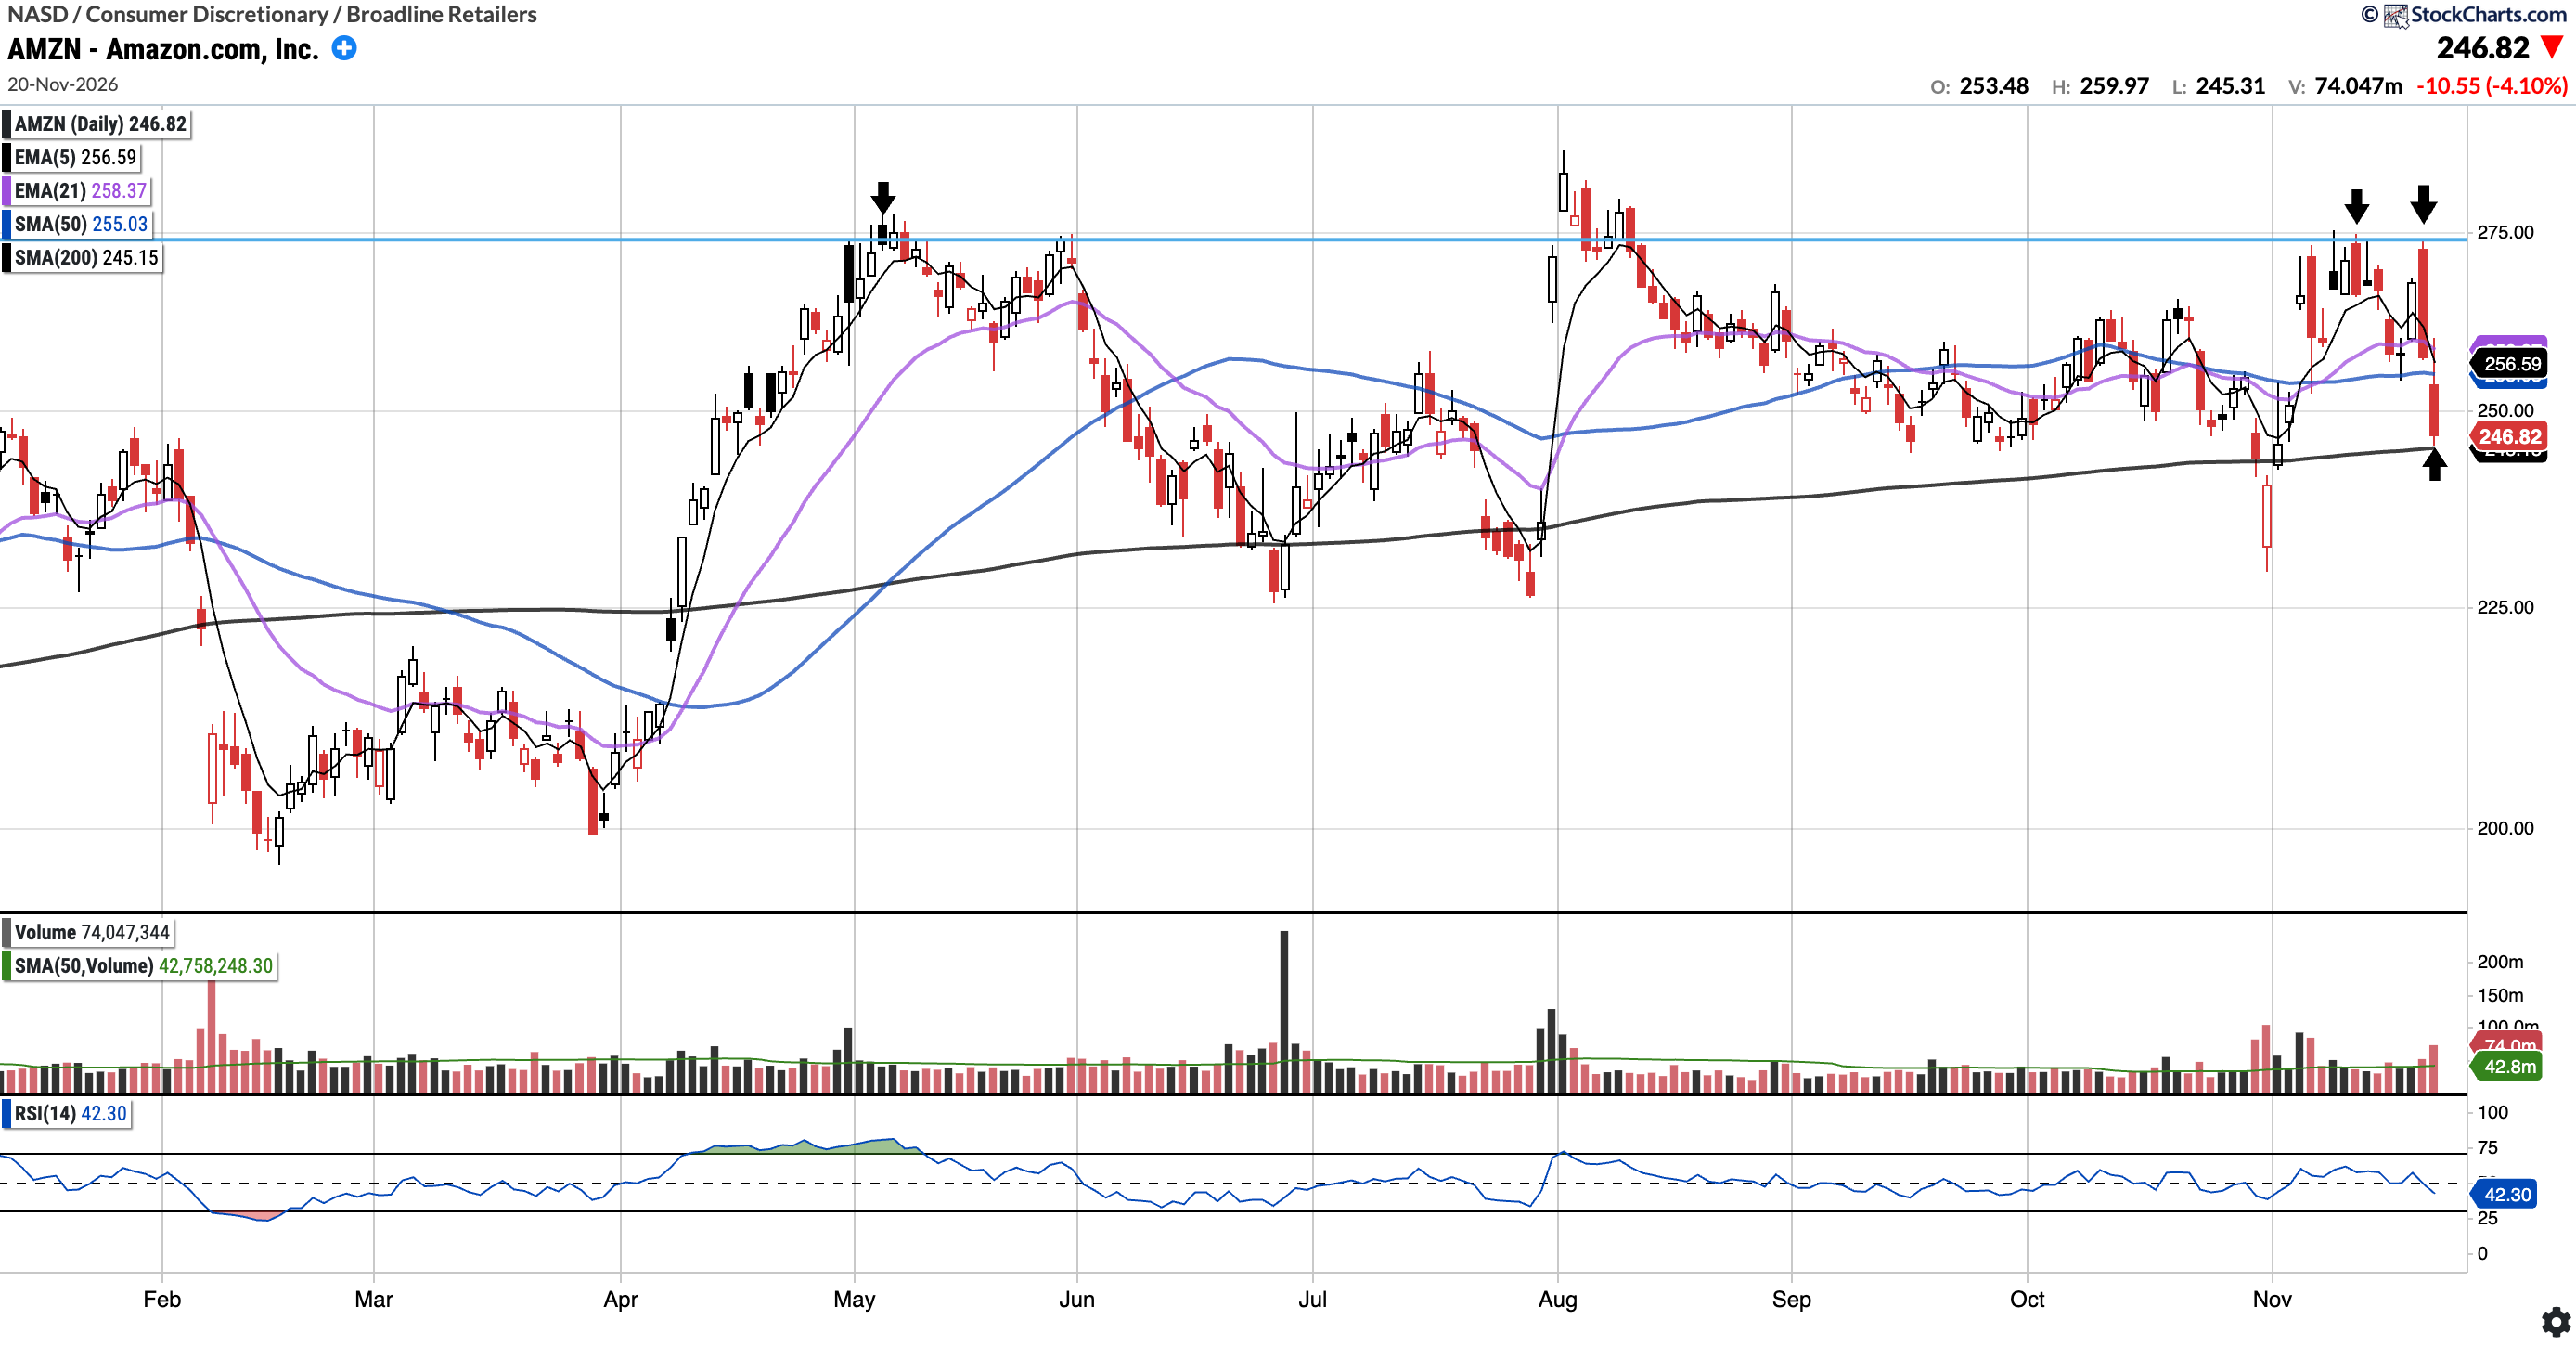
AMZN (Currently Long)
Currently trades at $246.82, 3.22% below the 50SMA and 0.68% above the 200SMA.
RSI 42.30
8.97% YTD
AMZN was once again rejected at the $274s on Thursday (see arrow). It reversed from a $274.00 high to close down 3.87%. Friday’s follow-through took it down to test the 200-day SMA ($245.15), which held with a low of $245.31 (see up arrow). AMZN finished the week down 7.44%. Bulls will want the 200-day to hold and the 50-day SMA ($255.03) to be reclaimed promptly, followed by a breakout above $274.
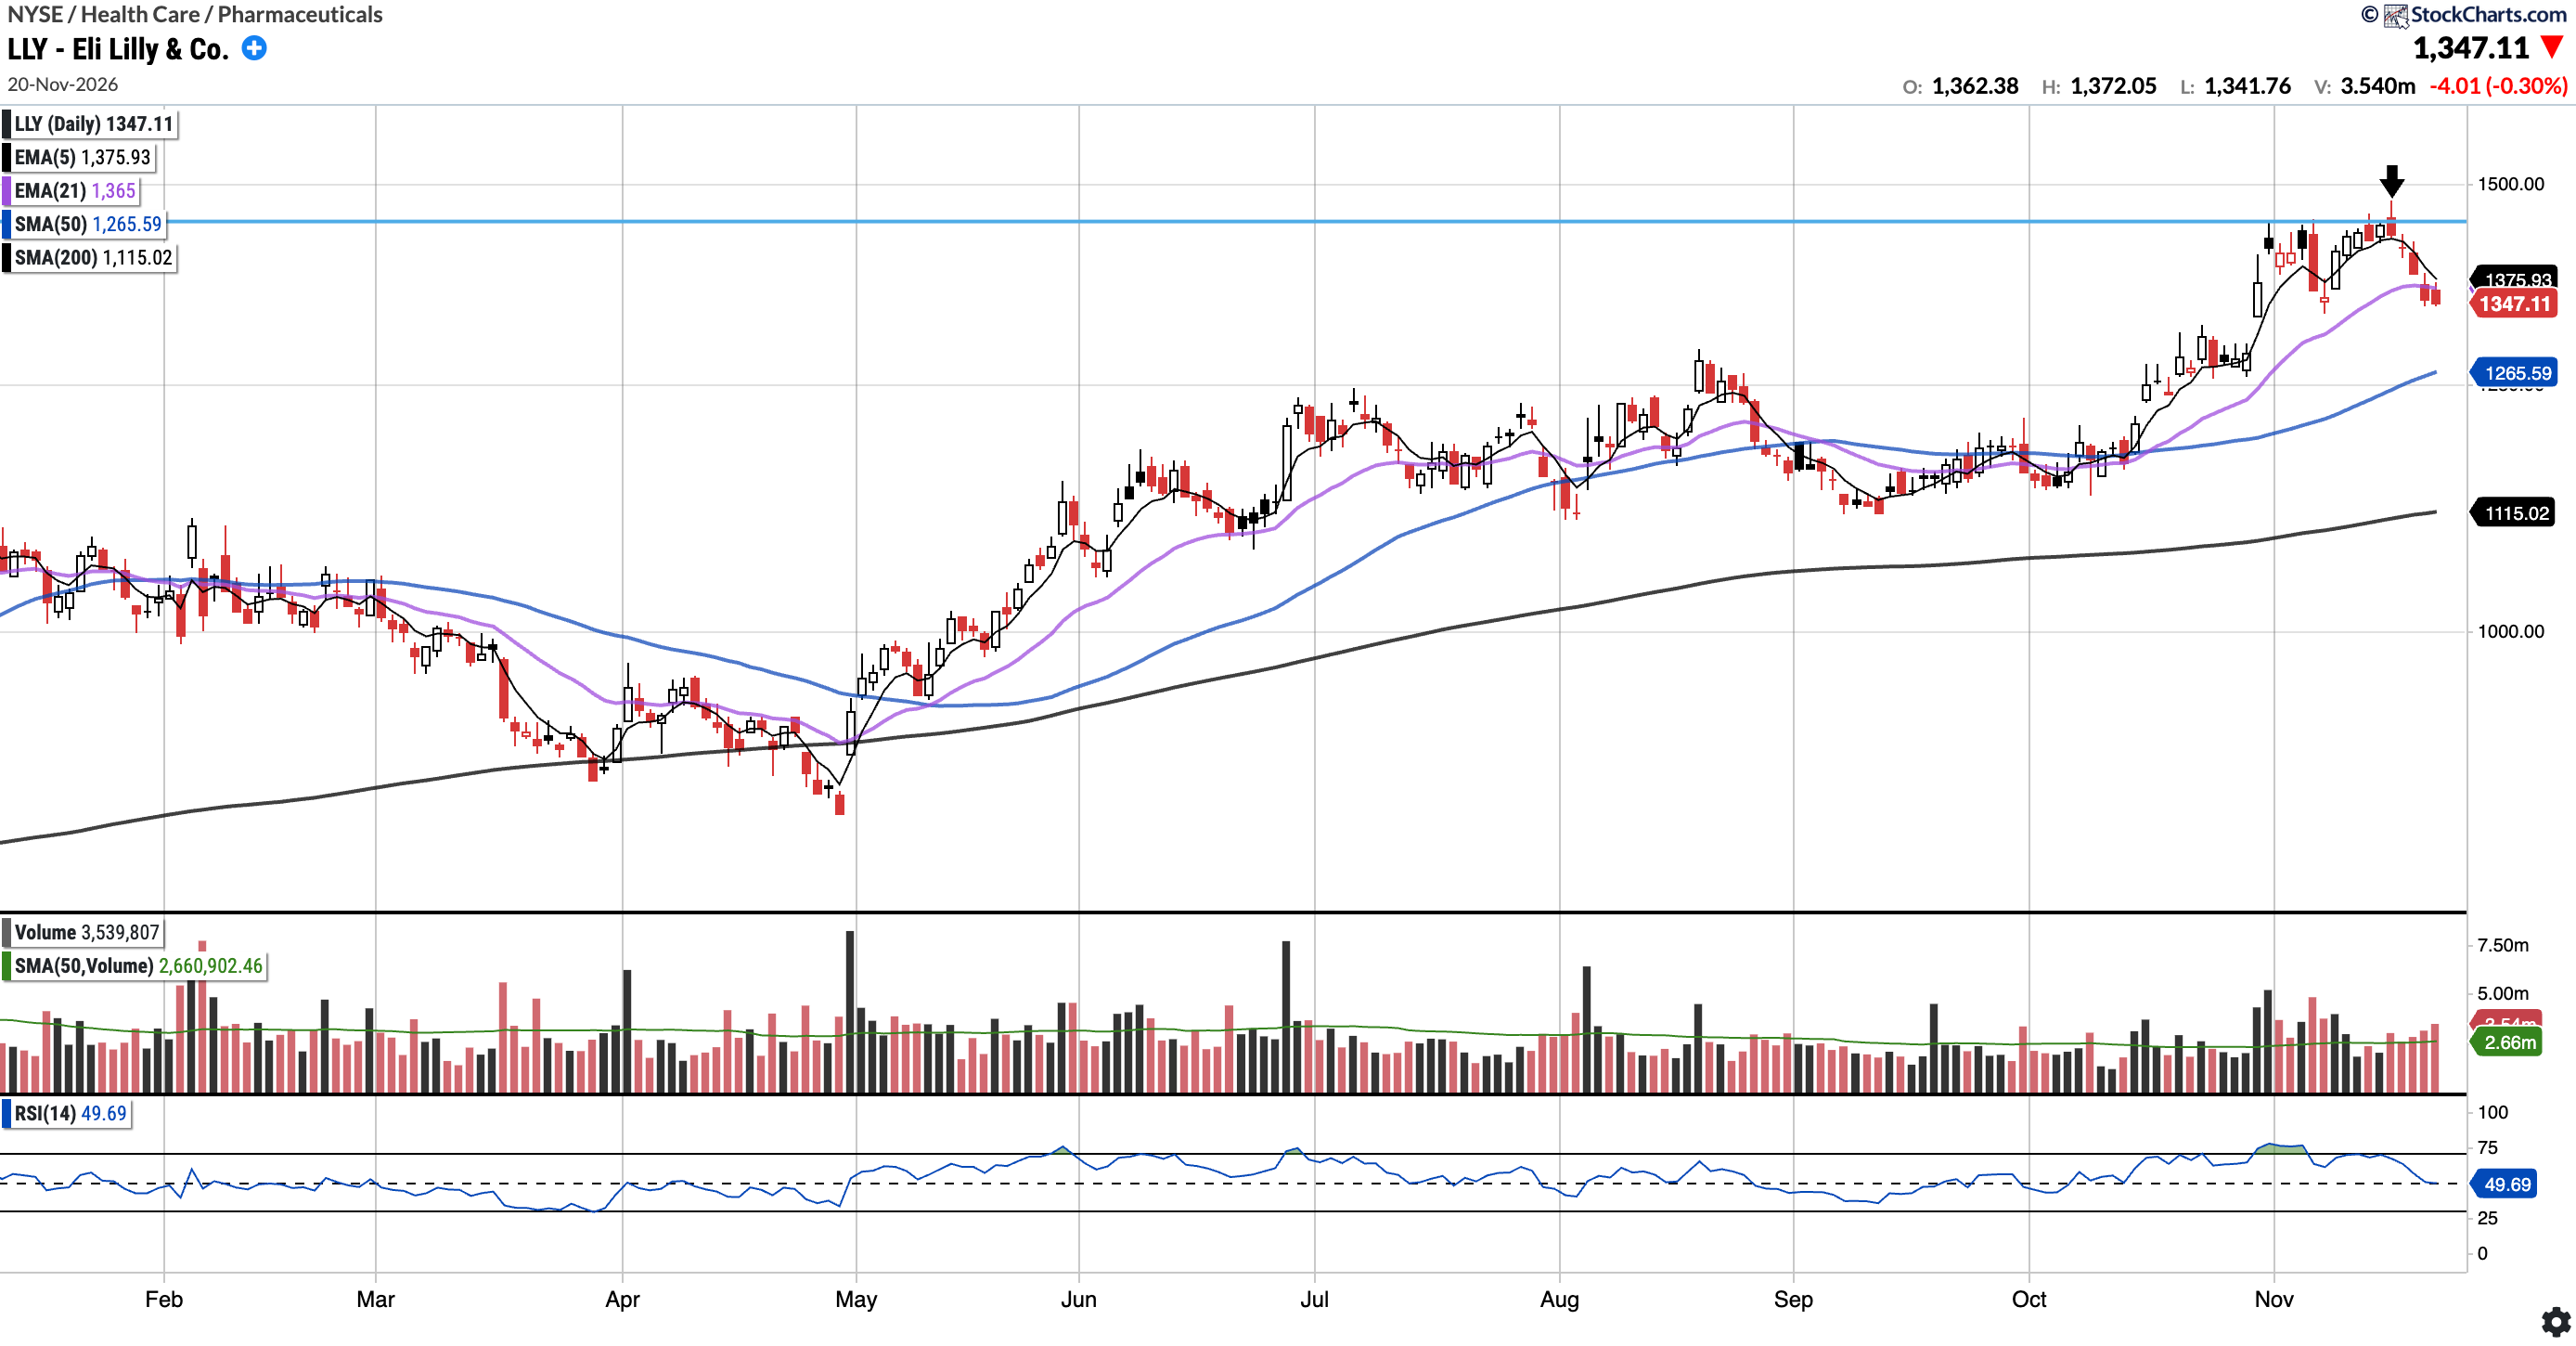
LLY (Currently Long)
Currently trades at $1,347.11, 6.44% above the 50SMA and 20.82% above the 200SMA.
RSI 49.69
25.45% YTD
LLY made a new high of $1,475.25 on Monday (we trimmed more shares at $1,460) but subsequently closed lower in all sessions, finishing the week down 6.68%. It looks to be under distribution. Volume rose through the week and came in above the 50-day average from Wednesday to Friday. The negative divergence has also been playing out: RSI made a lower high while LLY made a higher high. LLY has closed below both the 5EMA ($1,375.93) and the 21EMA ($1,365). We are watching for the 5/21 EMA cross to the downside that we flagged last week as a confirmation of a momentum shift.
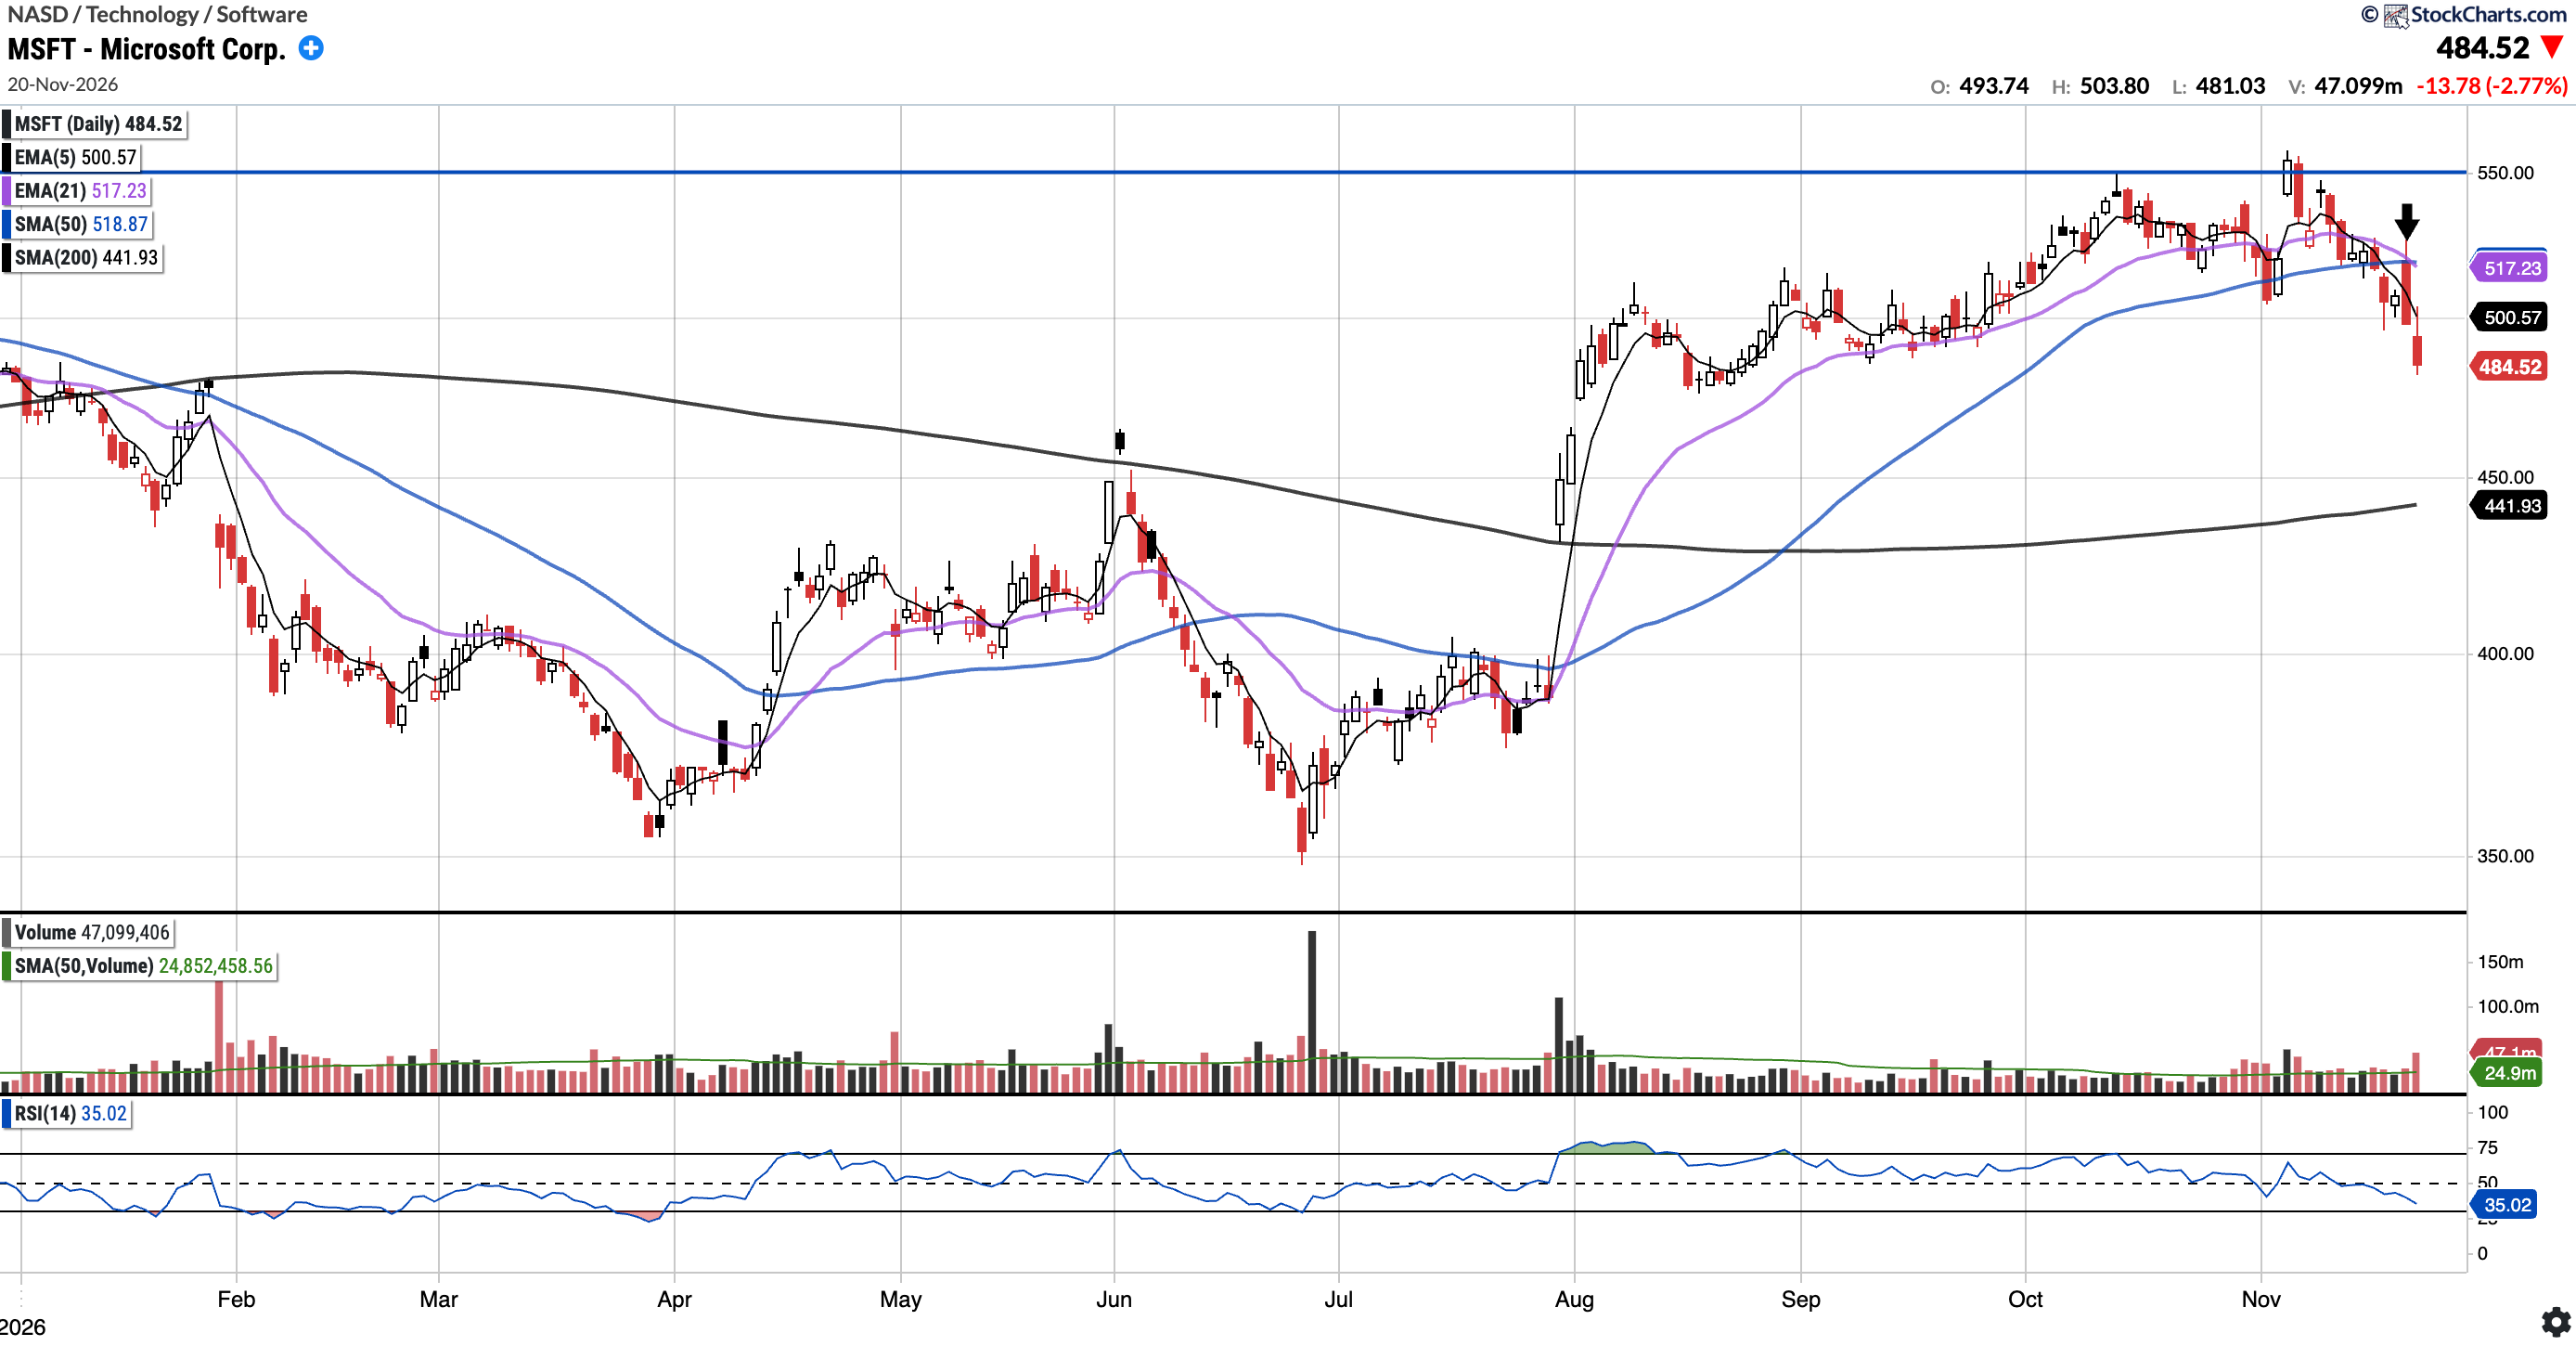
MSFT (Currently Long)
Currently trades at $484.52, 6.62% below the 50SMA and 9.64% above the 200SMA.
RSI 35.02
3.30% YTD
Last week, we noted $515 and the 50SMA as the key support zone. MSFT lost both on Monday. Thursday’s push back up to the 50-day SMA was rejected (see arrow), and we trimmed shares into that. The stock closed the week down 7.33%. We have been reducing exposure to this name to bring it to market weight or just below.
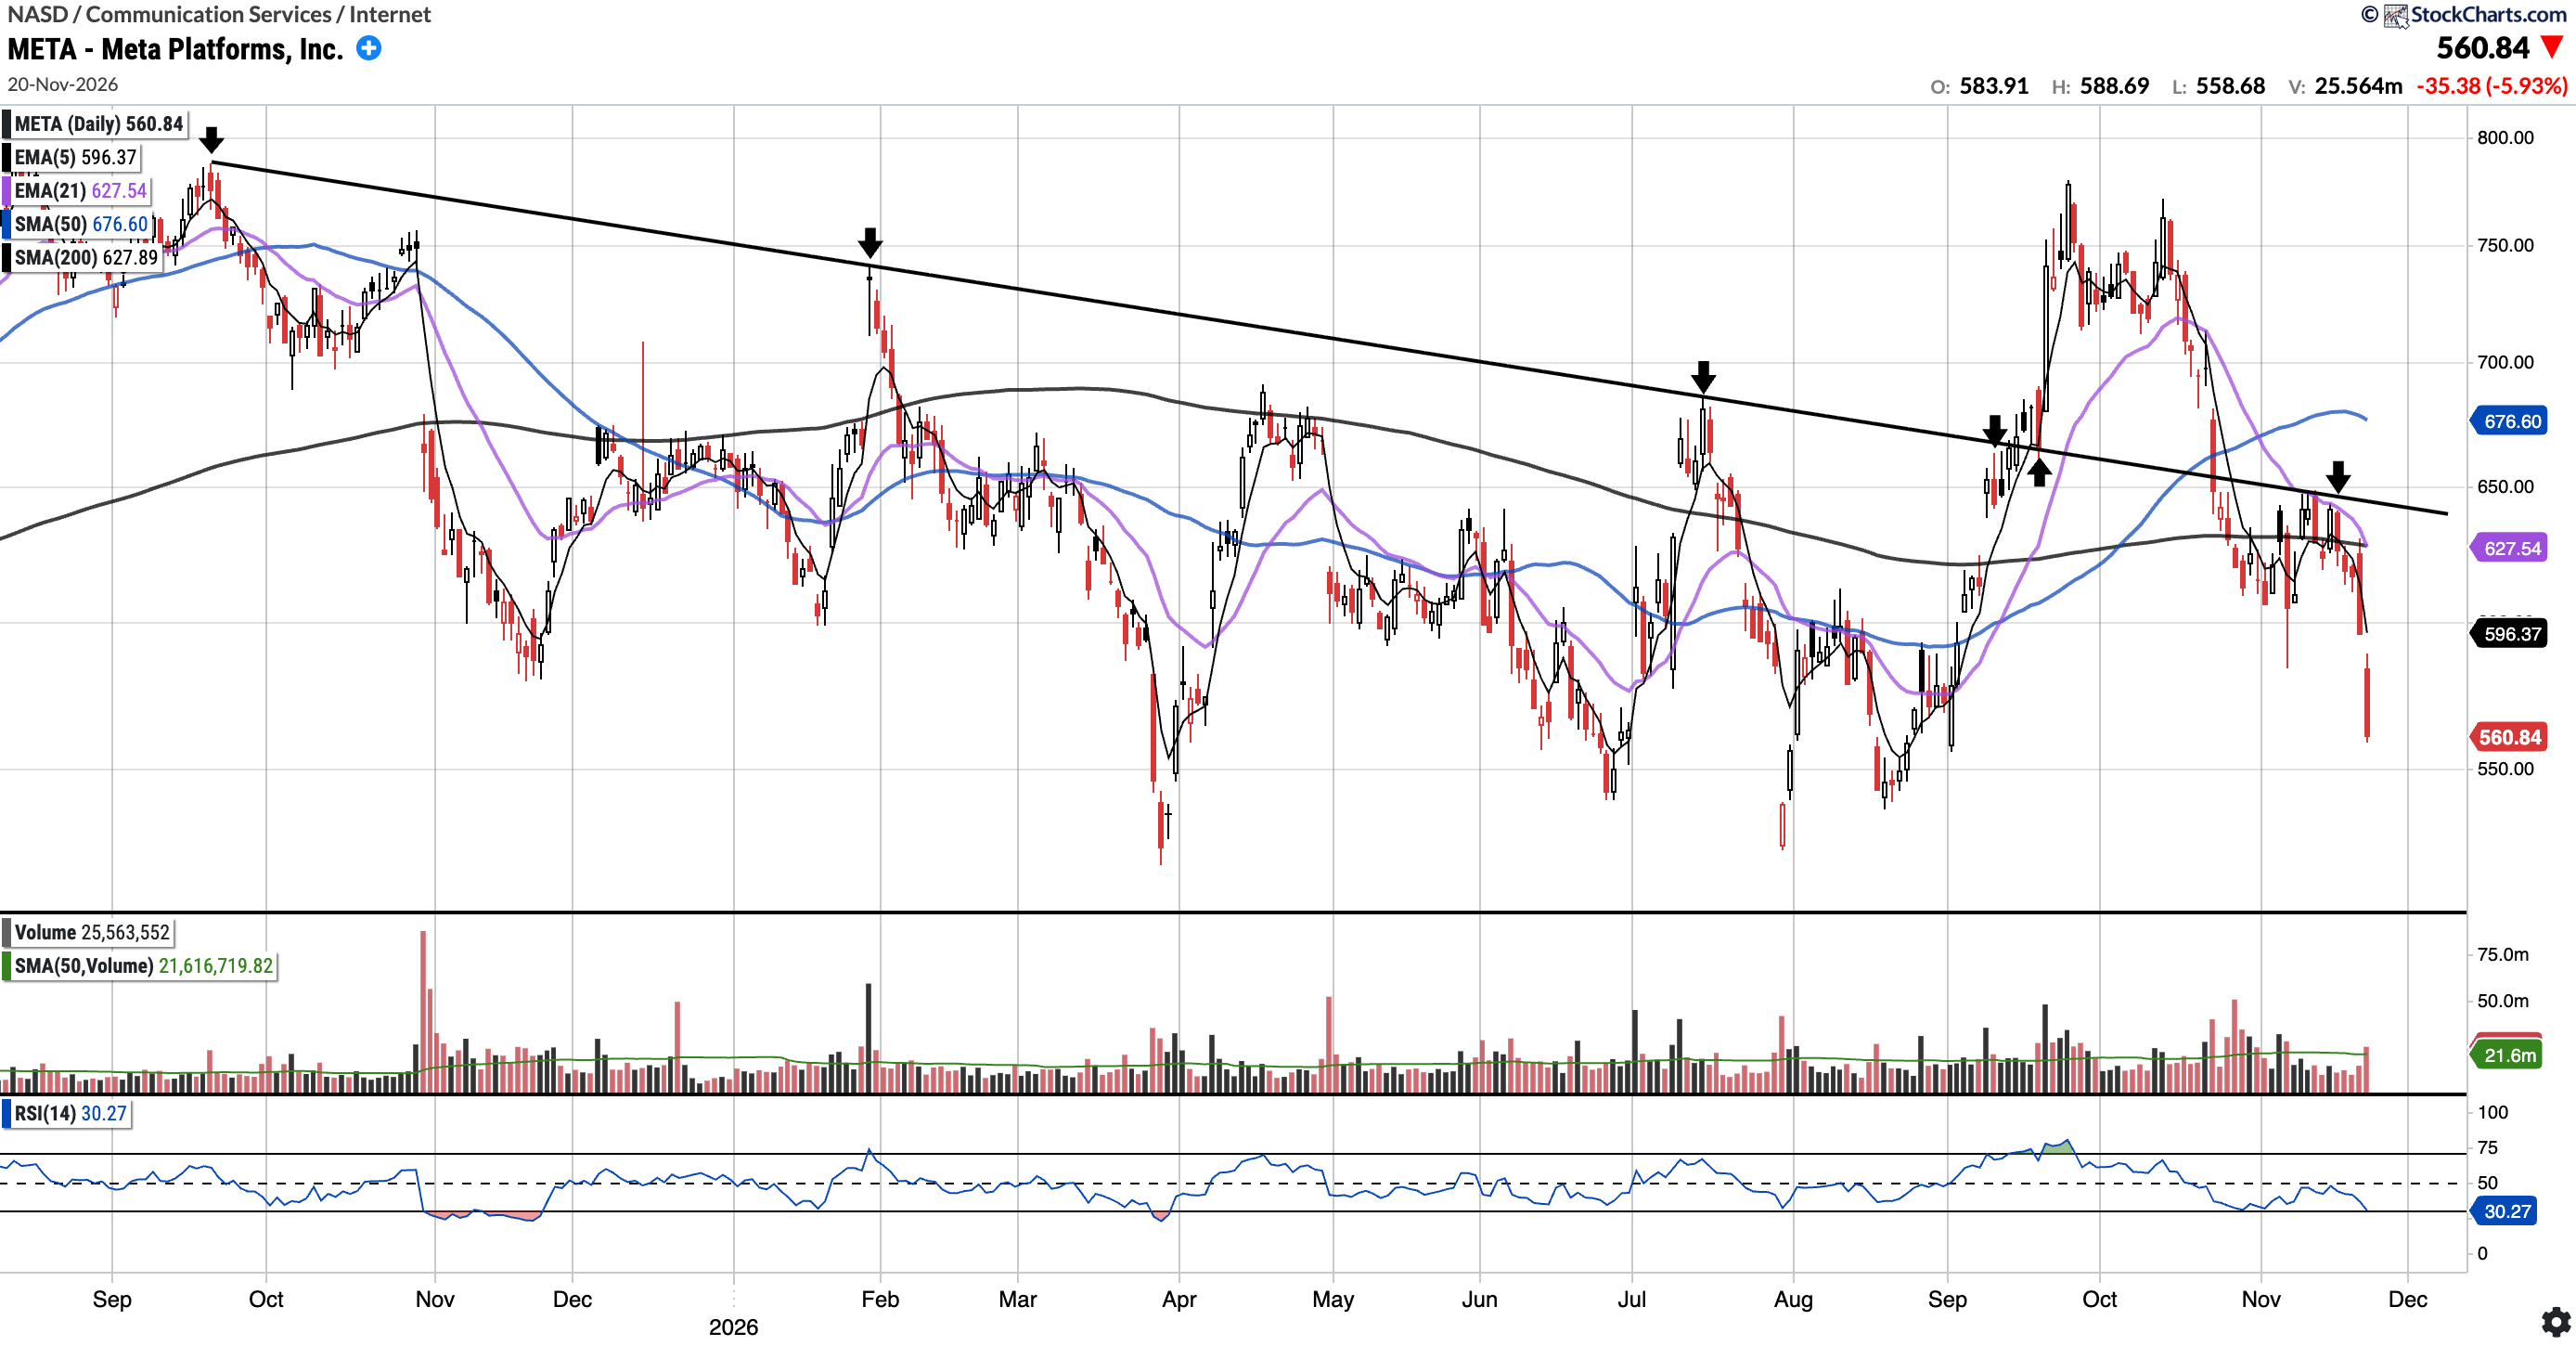
META (Currently Long)
Currently trades at $560.84, 17.11% below the 50SMA and 10.68% below the 200SMA.
RSI 30.27
-13.55% YTD
Last week, META was rejected at the descending trendline from the September 2025 high (see last arrow). Again, we trimmed some excess shares into the overhead resistance. This week, it sold off hard from there, falling 12.60% and losing the 200-day SMA, and it is now well below the trendline. Bulls will want a rally that reclaims the trendline and closes above it. On the downside, the low $520s has been a level of interest.
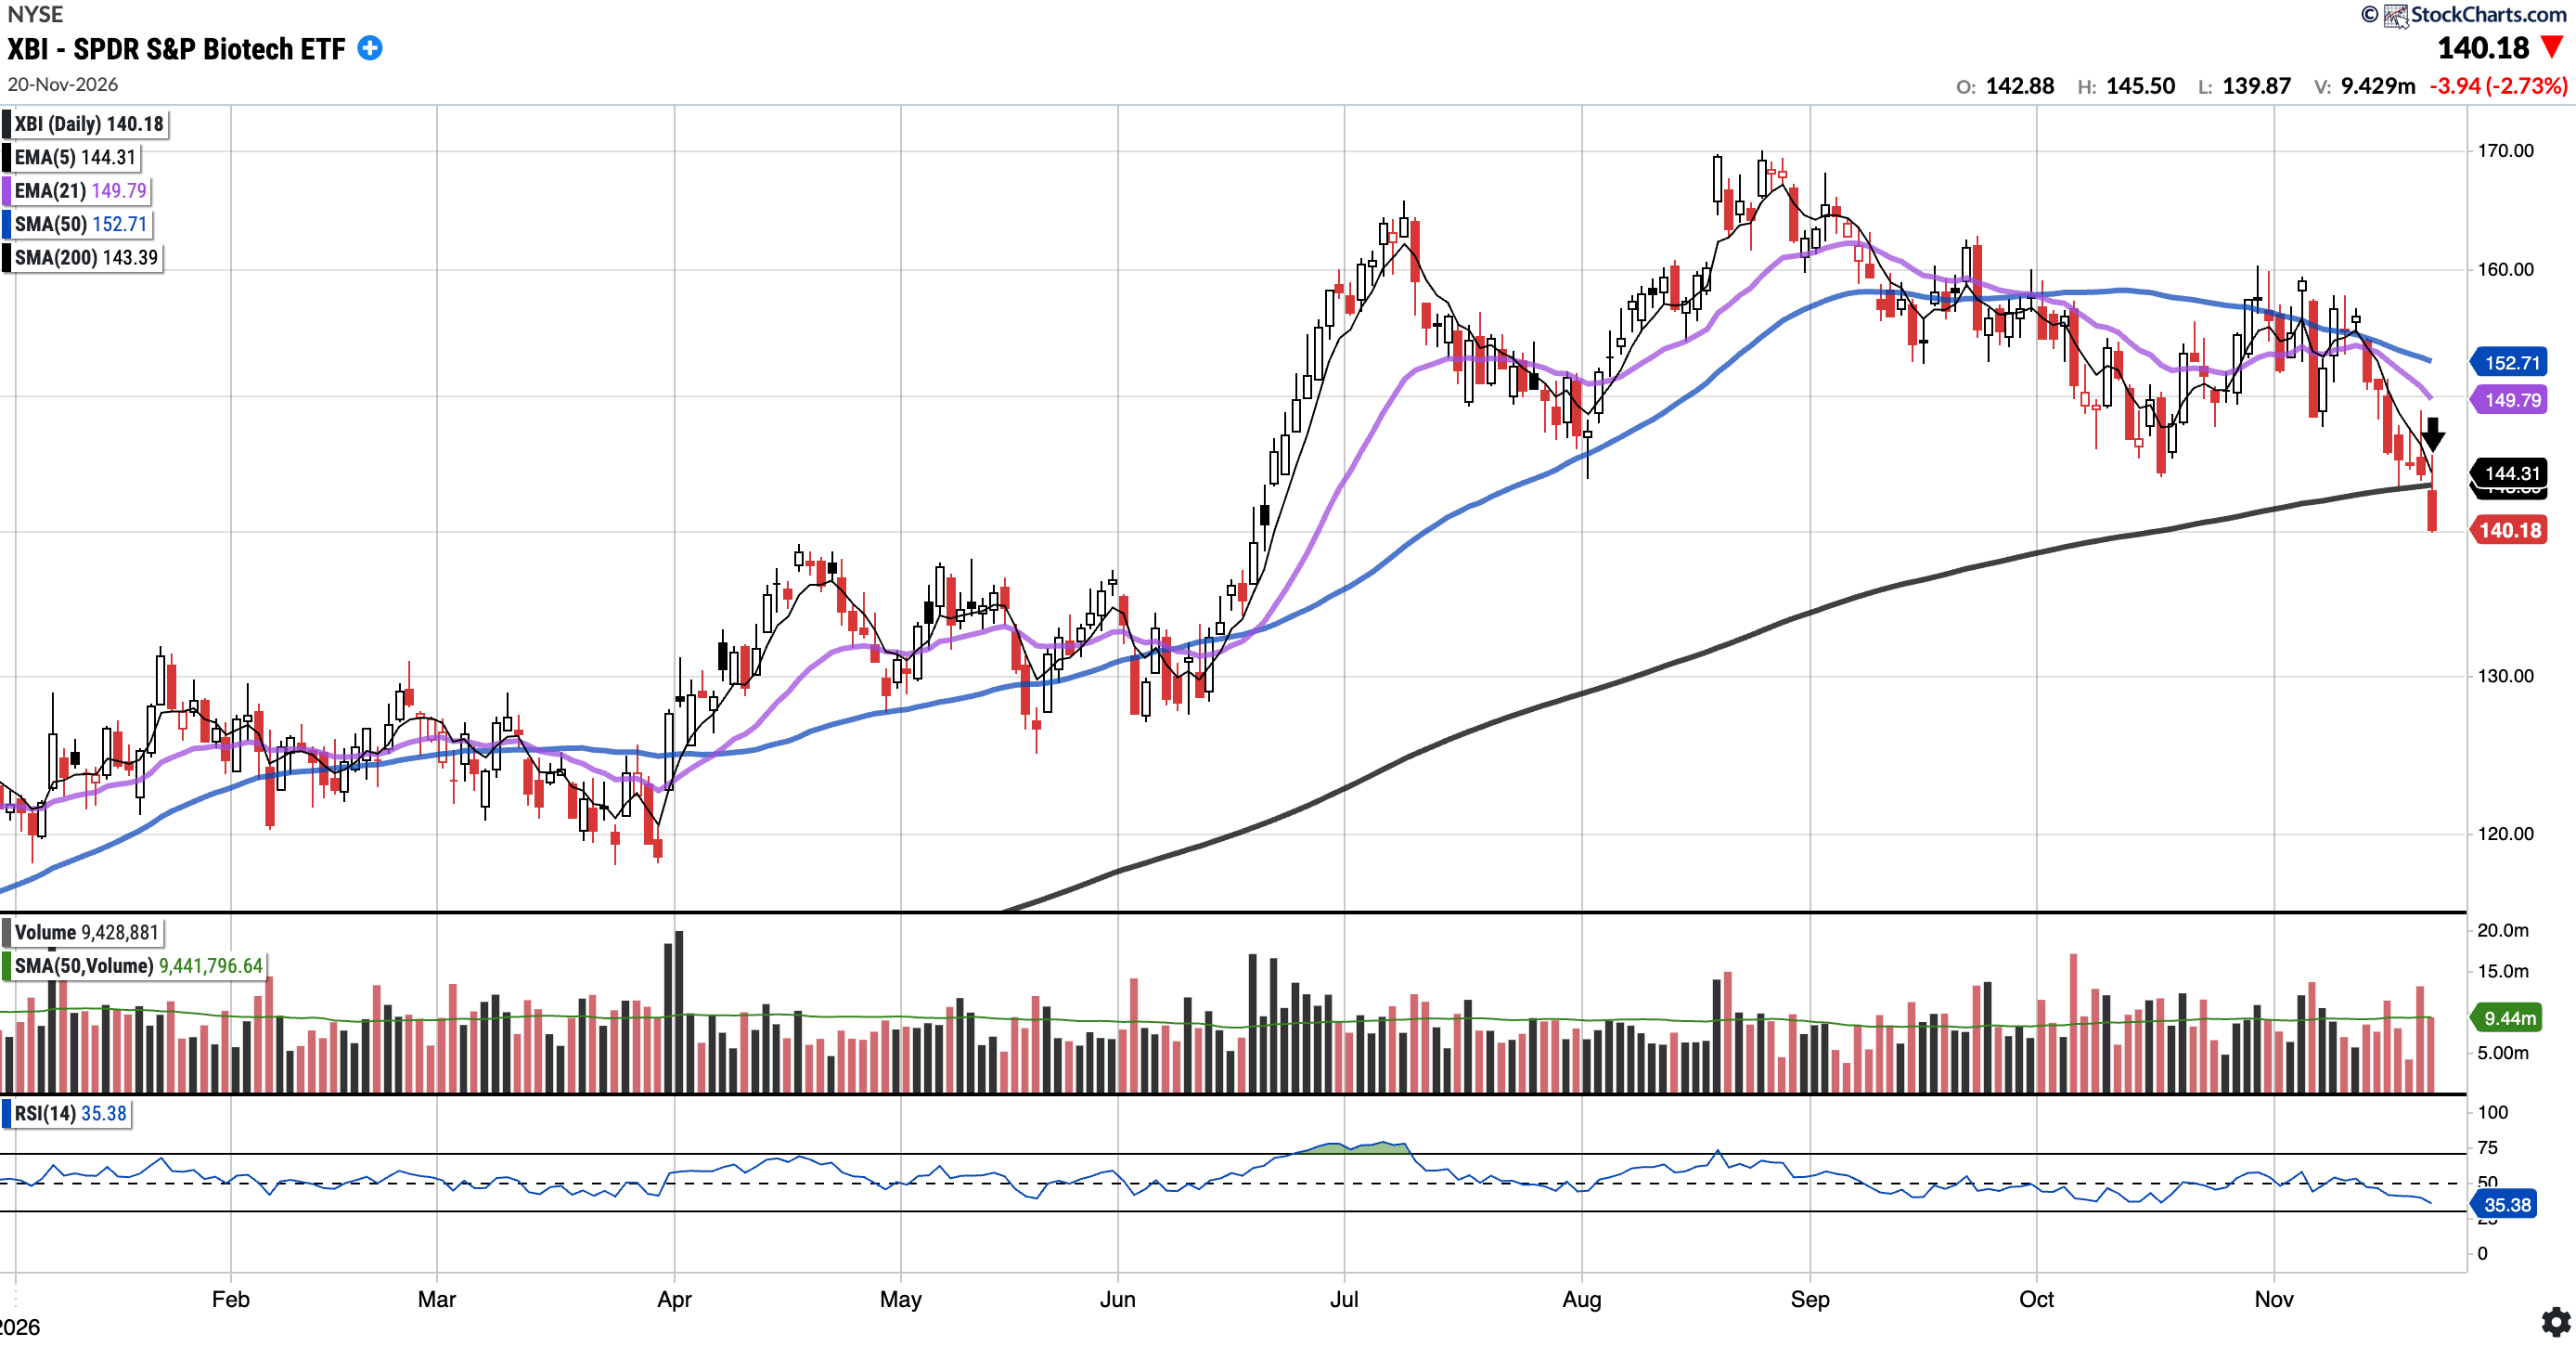
XBI
Currently trades at $140.18, 8.21% below the 50SMA and 2.24% below the 200SMA.
RSI 35.38
15.47% YTD
Last week we flagged the 200SMA as the key support below. XBI held it through Thursday but lost it on Friday (see arrow), finishing the week down 6.89%. It has now lost all of its key moving averages. Bulls will want a quick reclaim of the 200SMA ($143.39).
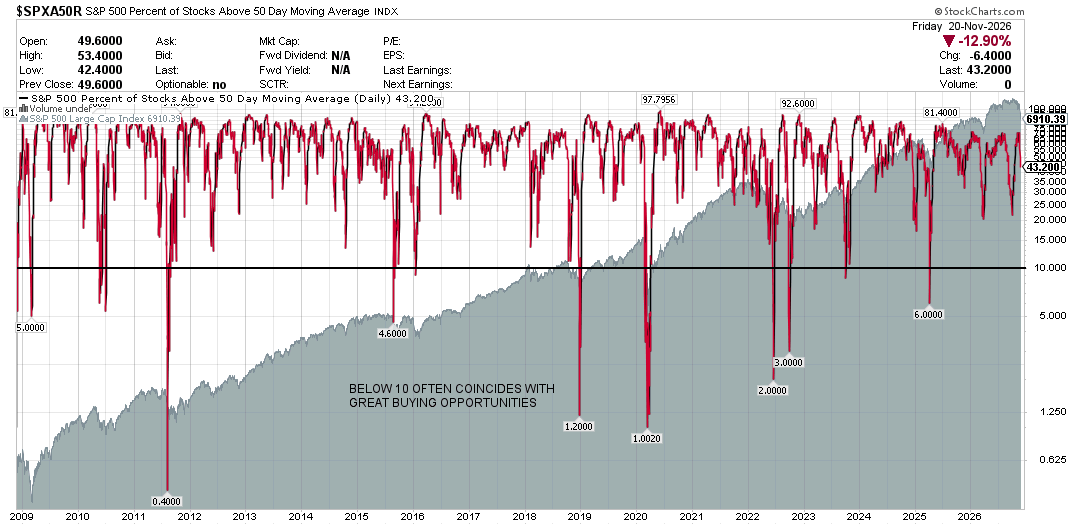
S&P 500 Percentage of Stocks Above the 50 Day Moving Average: Currently 43.20%
Breadth decreased significantly this week, with the percentage of stocks above the 50-day moving average now at 43.20% compared to 71.80% last week.
Notable portfolio changes in previous week (all updated live in subscriber channels):
