

Hope you all are having a good weekend. Below, we will be previewing the upcoming week’s events and providing a portfolio update as usual.
Format for what is covered in this weekly preview:
A Look at the Indices
Key Upcoming Economic Events
Upcoming Earnings
Charts
Current Portfolio Holdings
Sizing | Cost Basis | Timeframe | Planned Moves
I recommend checking out the most recent in-depth Monthly Portfolio and Performance Update below (the new post will also be published within the next day).

For all readers a reminder that a premium subscription includes:
Live Portfolio updates (All Buys and Sells) in Subscriber only Channels
Favourite set-up Ideas, Market Memos plus Full archive
Monthly in depth portfolio & performance updates
Annual Tier: Discord access for live trading account updates and AMAs.
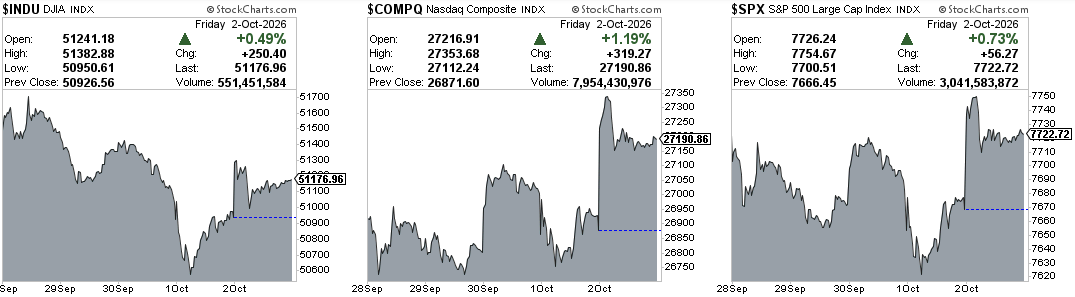
Indices
Dow Jones Industrial Average advanced +0.28% in the last week
S&P 500 declined -0.27% in the last week
Nasdaq Composite advanced +0.45% in the last week
IWM declined -0.16% in the last week
Key upcoming economic events
Monday, October 5
S&P Global Services PMI, Final (September)
ISM Services PMI (September)
Tuesday, October 6
International Trade in Goods and Services (August)
Fed Vice Chair Michelle Bowman speaks on regulation and supervision
U.S. Treasury 3-Year Note Auction
Wednesday, October 7
MBA Mortgage Applications
EIA Weekly Petroleum Status Report
U.S. Treasury 10-Year Note Auction
FOMC Minutes (September 15-16 meeting)
Consumer Credit (August)
Thursday, October 8
Fed Governor Christopher Waller speaks on the economic outlook
Initial Weekly Jobless Claims
Wholesale Trade: Sales and Inventories (August)
EIA Weekly Natural Gas Storage Report
U.S. Treasury 30-Year Bond Auction
Friday, October 9
University of Michigan Consumer Sentiment, Preliminary (October)
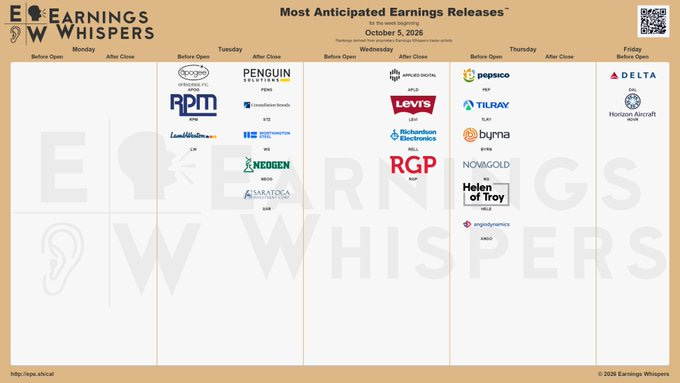
Upcoming Earnings
Below is the infographic by Earnings Whispers highlighting the schedule for this week:
Charts
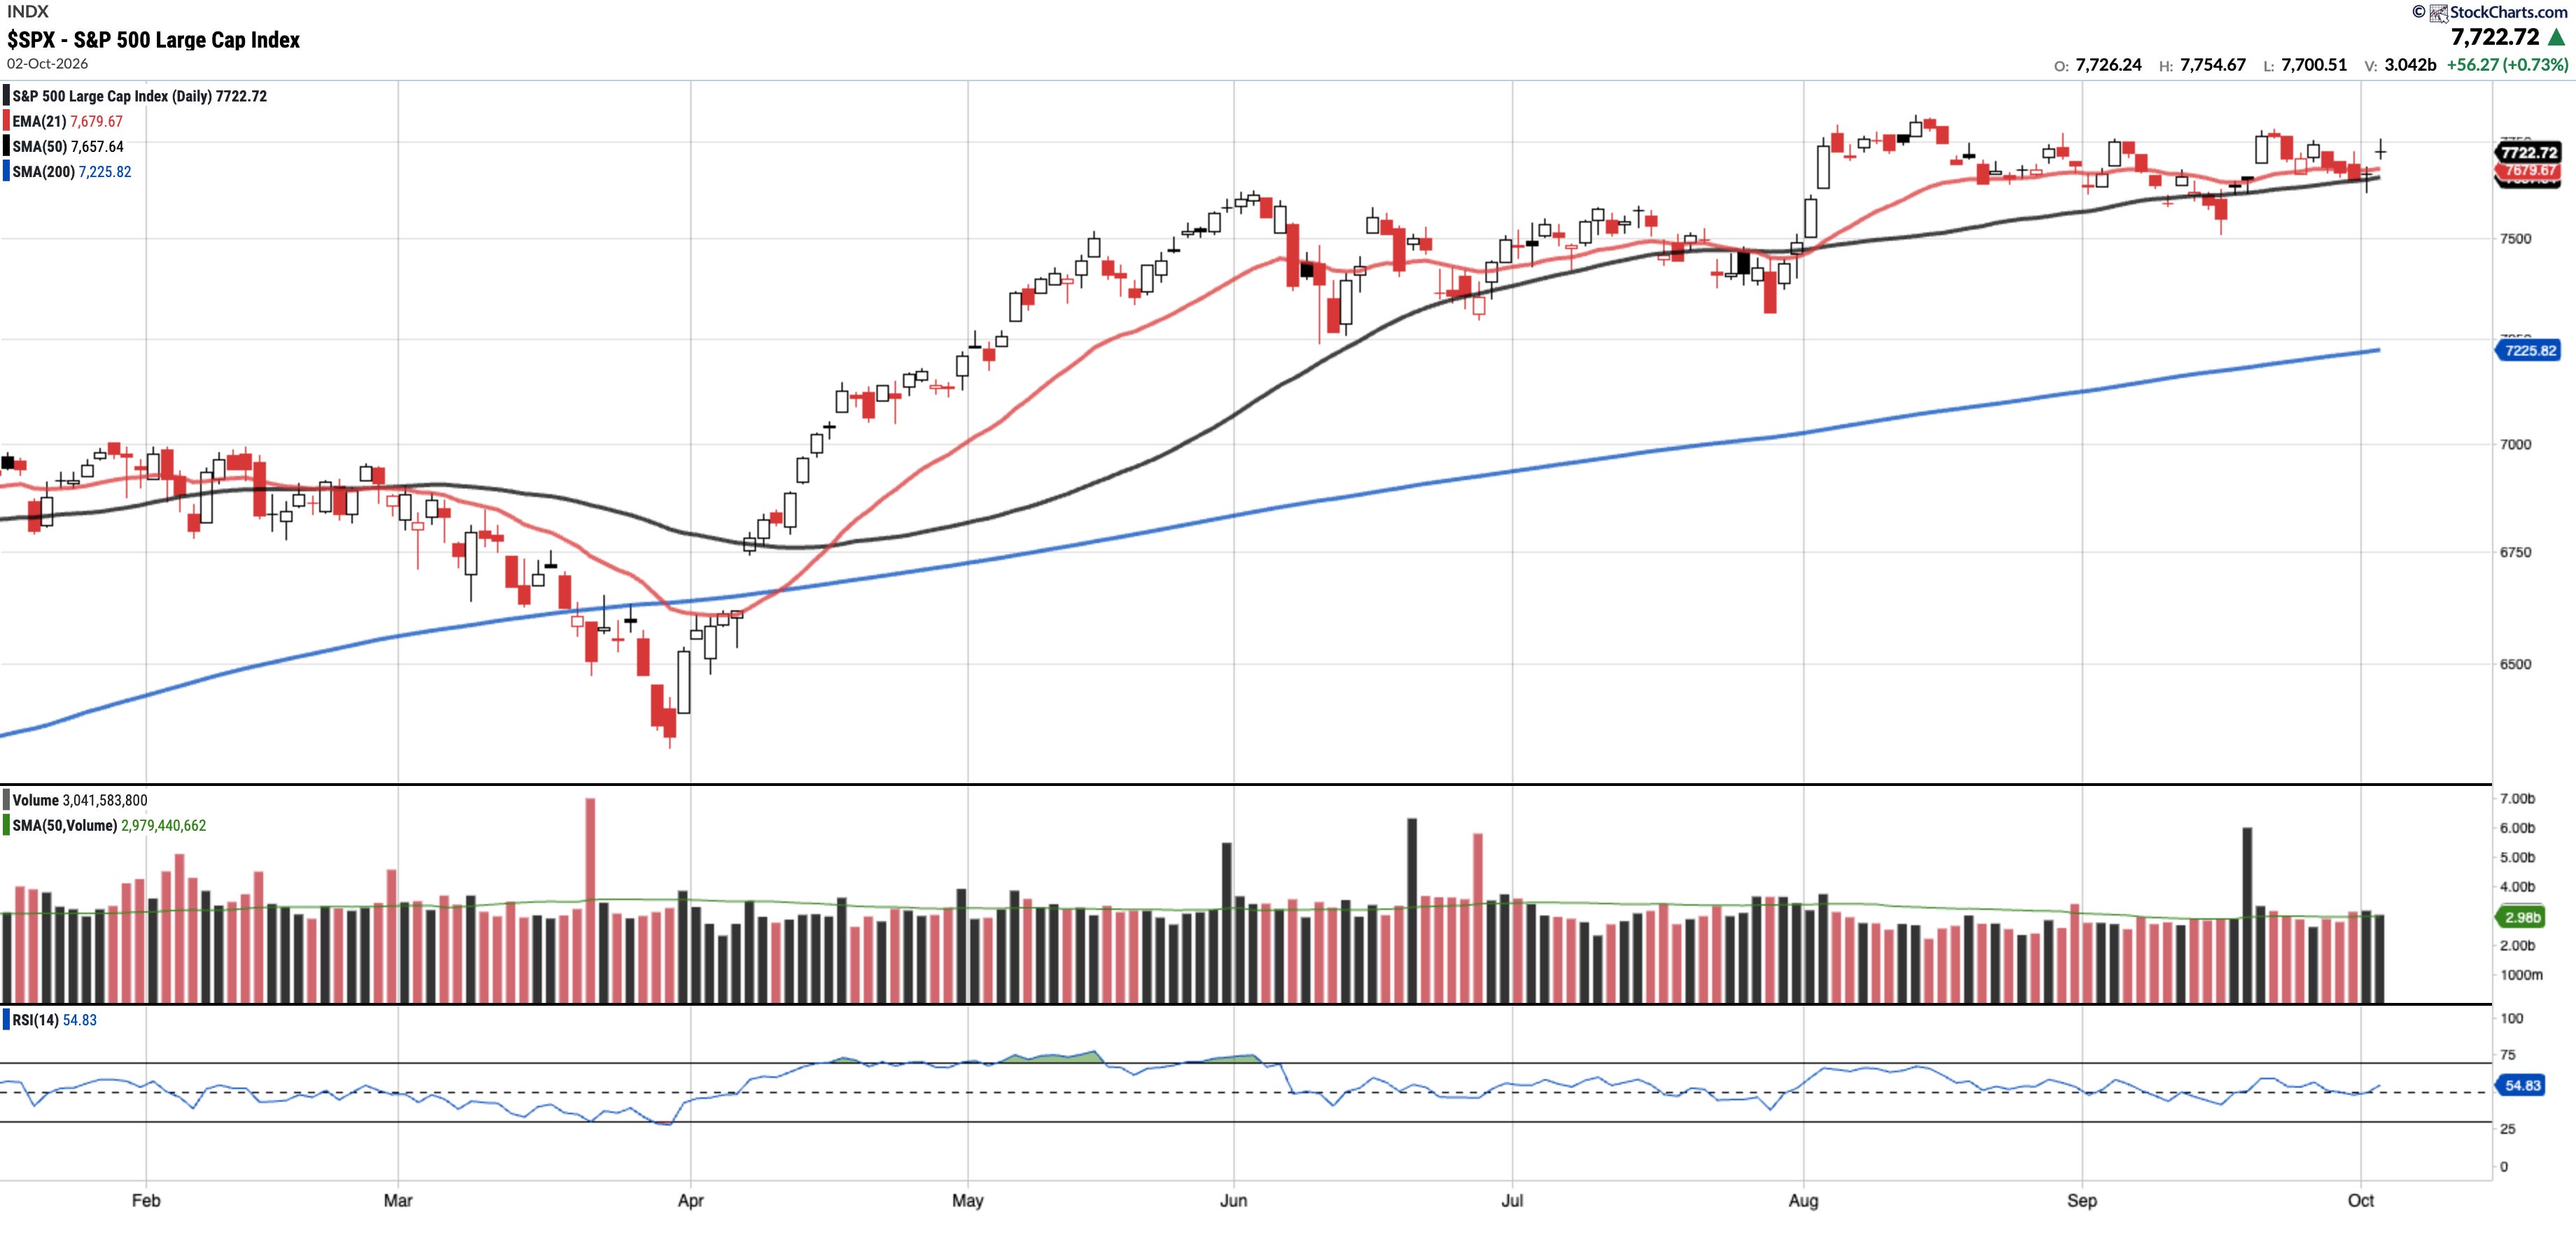
SPX
Currently trades at $7,722.72, 0.85% above the 50SMA and 6.88% above the 200SMA.
RSI 54.83
12.60% YTD
Distribution days in the last week: 2
The S&P 500 pulled back to test the 50-day SMA this week, undercutting the 50-day intraday on Thursday before buyers stepped in. Friday’s rebound reclaimed the 21EMA on some volume just above its 50-day average, and price closed the week above all of its key moving averages.
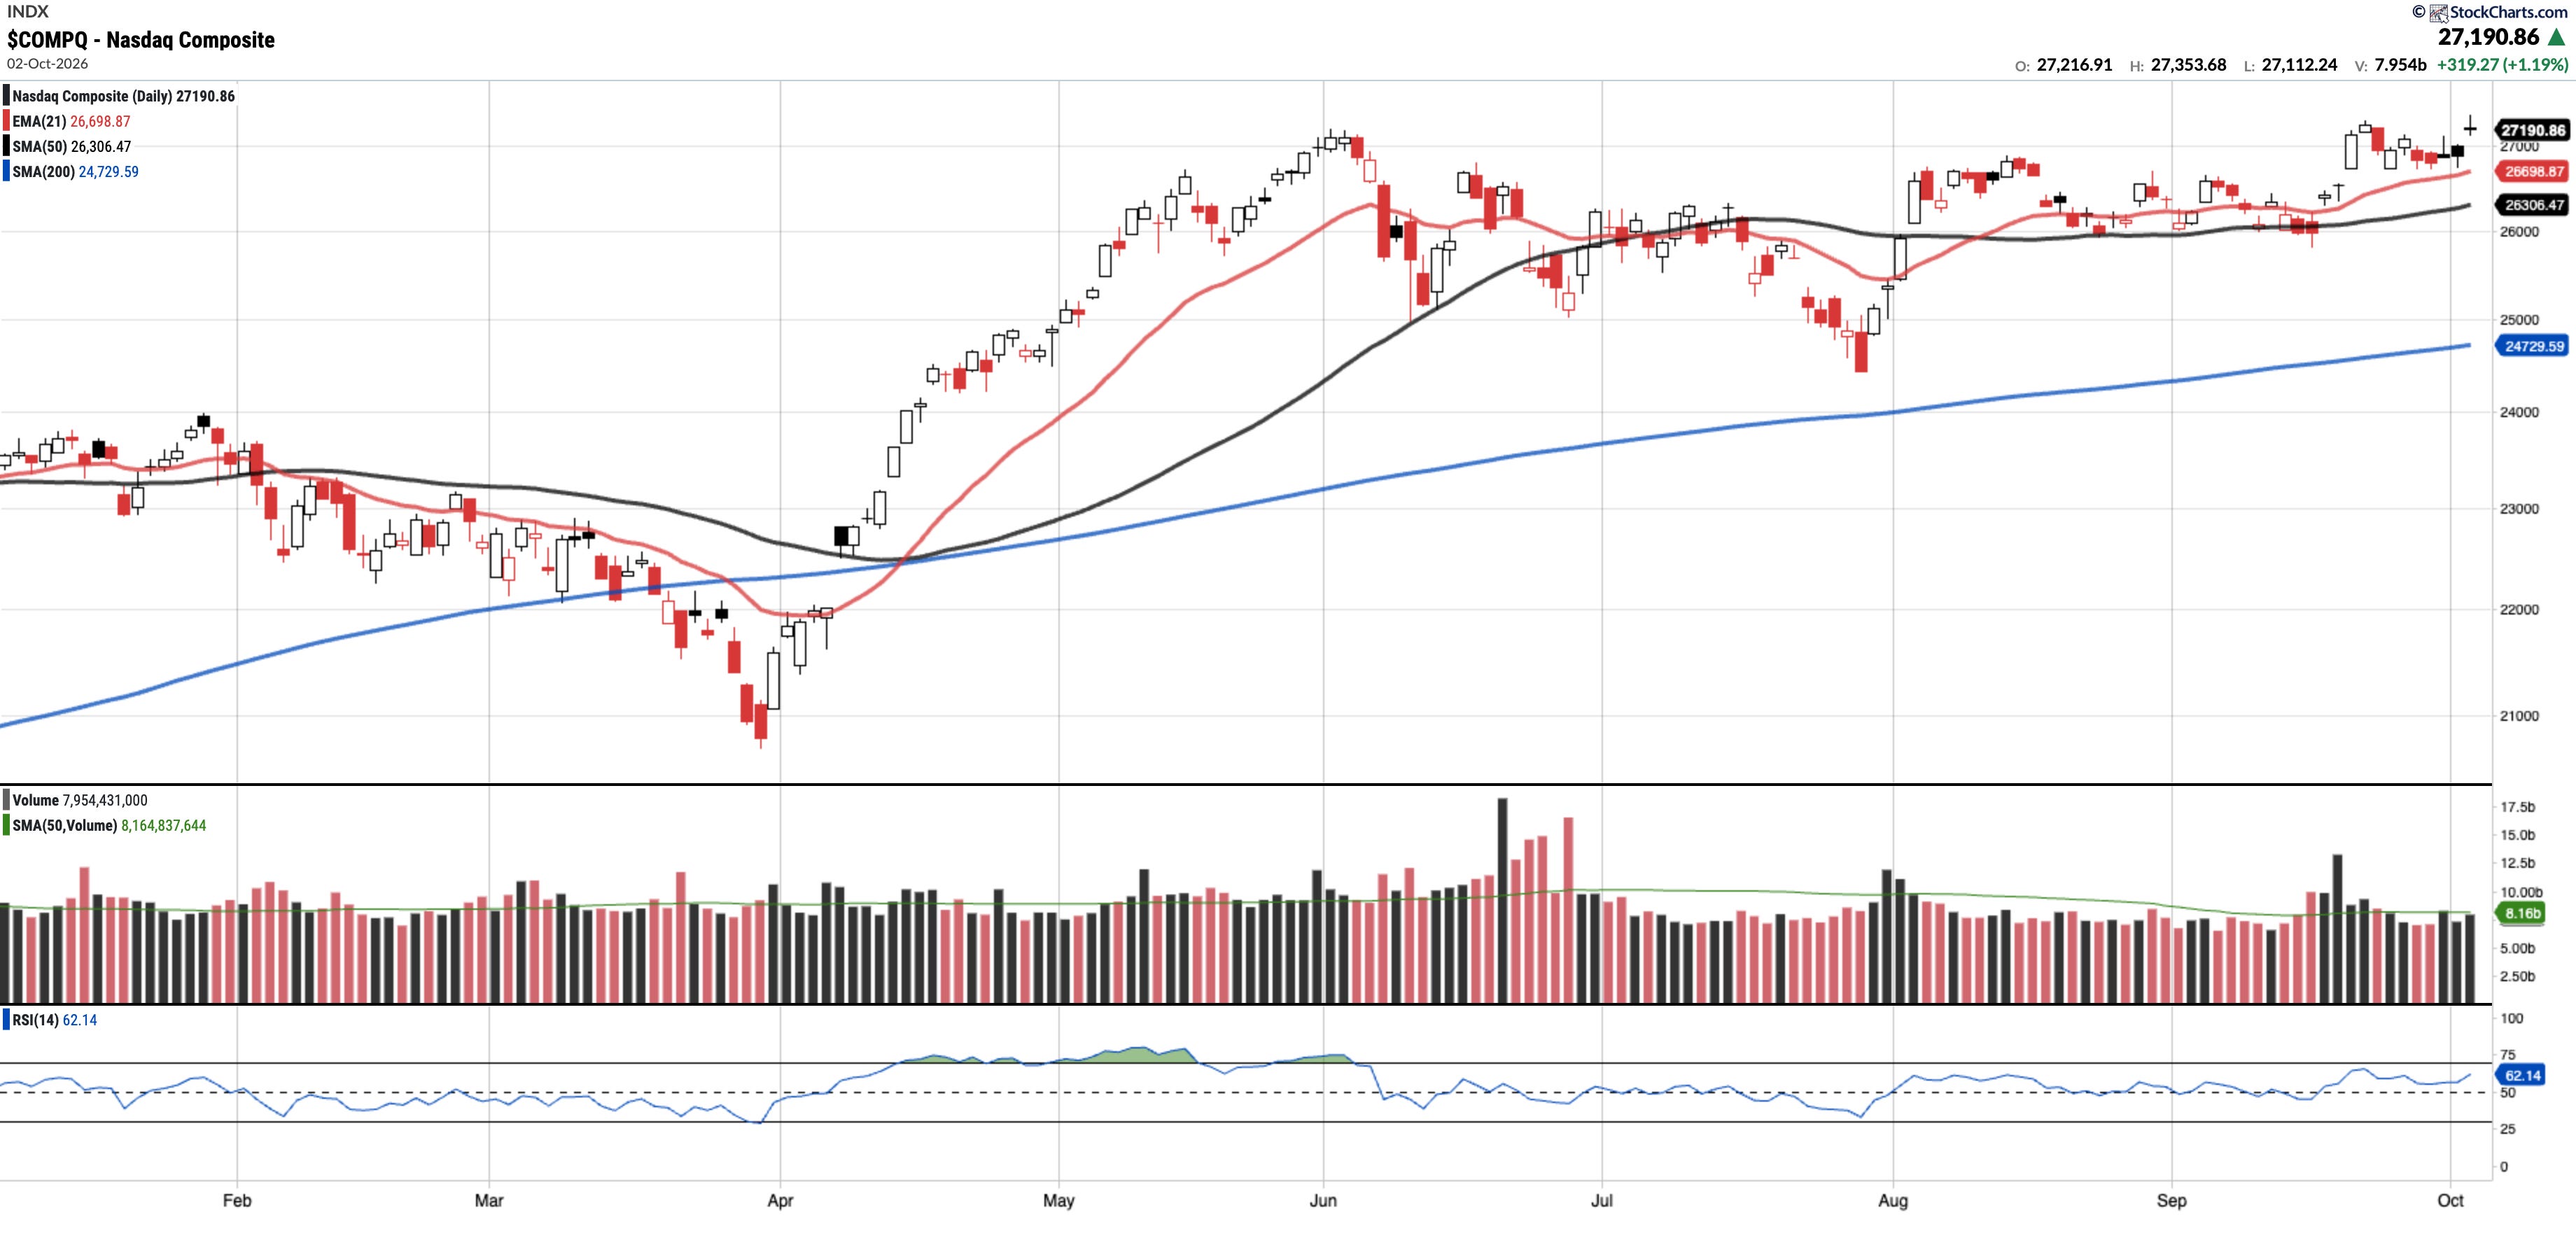
COMPQ
Currently trades at $27,190.86, 3.36% above the 50SMA and 9.95% above the 200SMA.
RSI 62.14
17.02% YTD
Distribution days in the last week: 1
The Nasdaq Composite shook off a drop on Monday and ended the week with an all time high on Friday, on a cooler than expected jobs report. Price held above the 21EMA throughout the week and closed above all of its key moving averages.
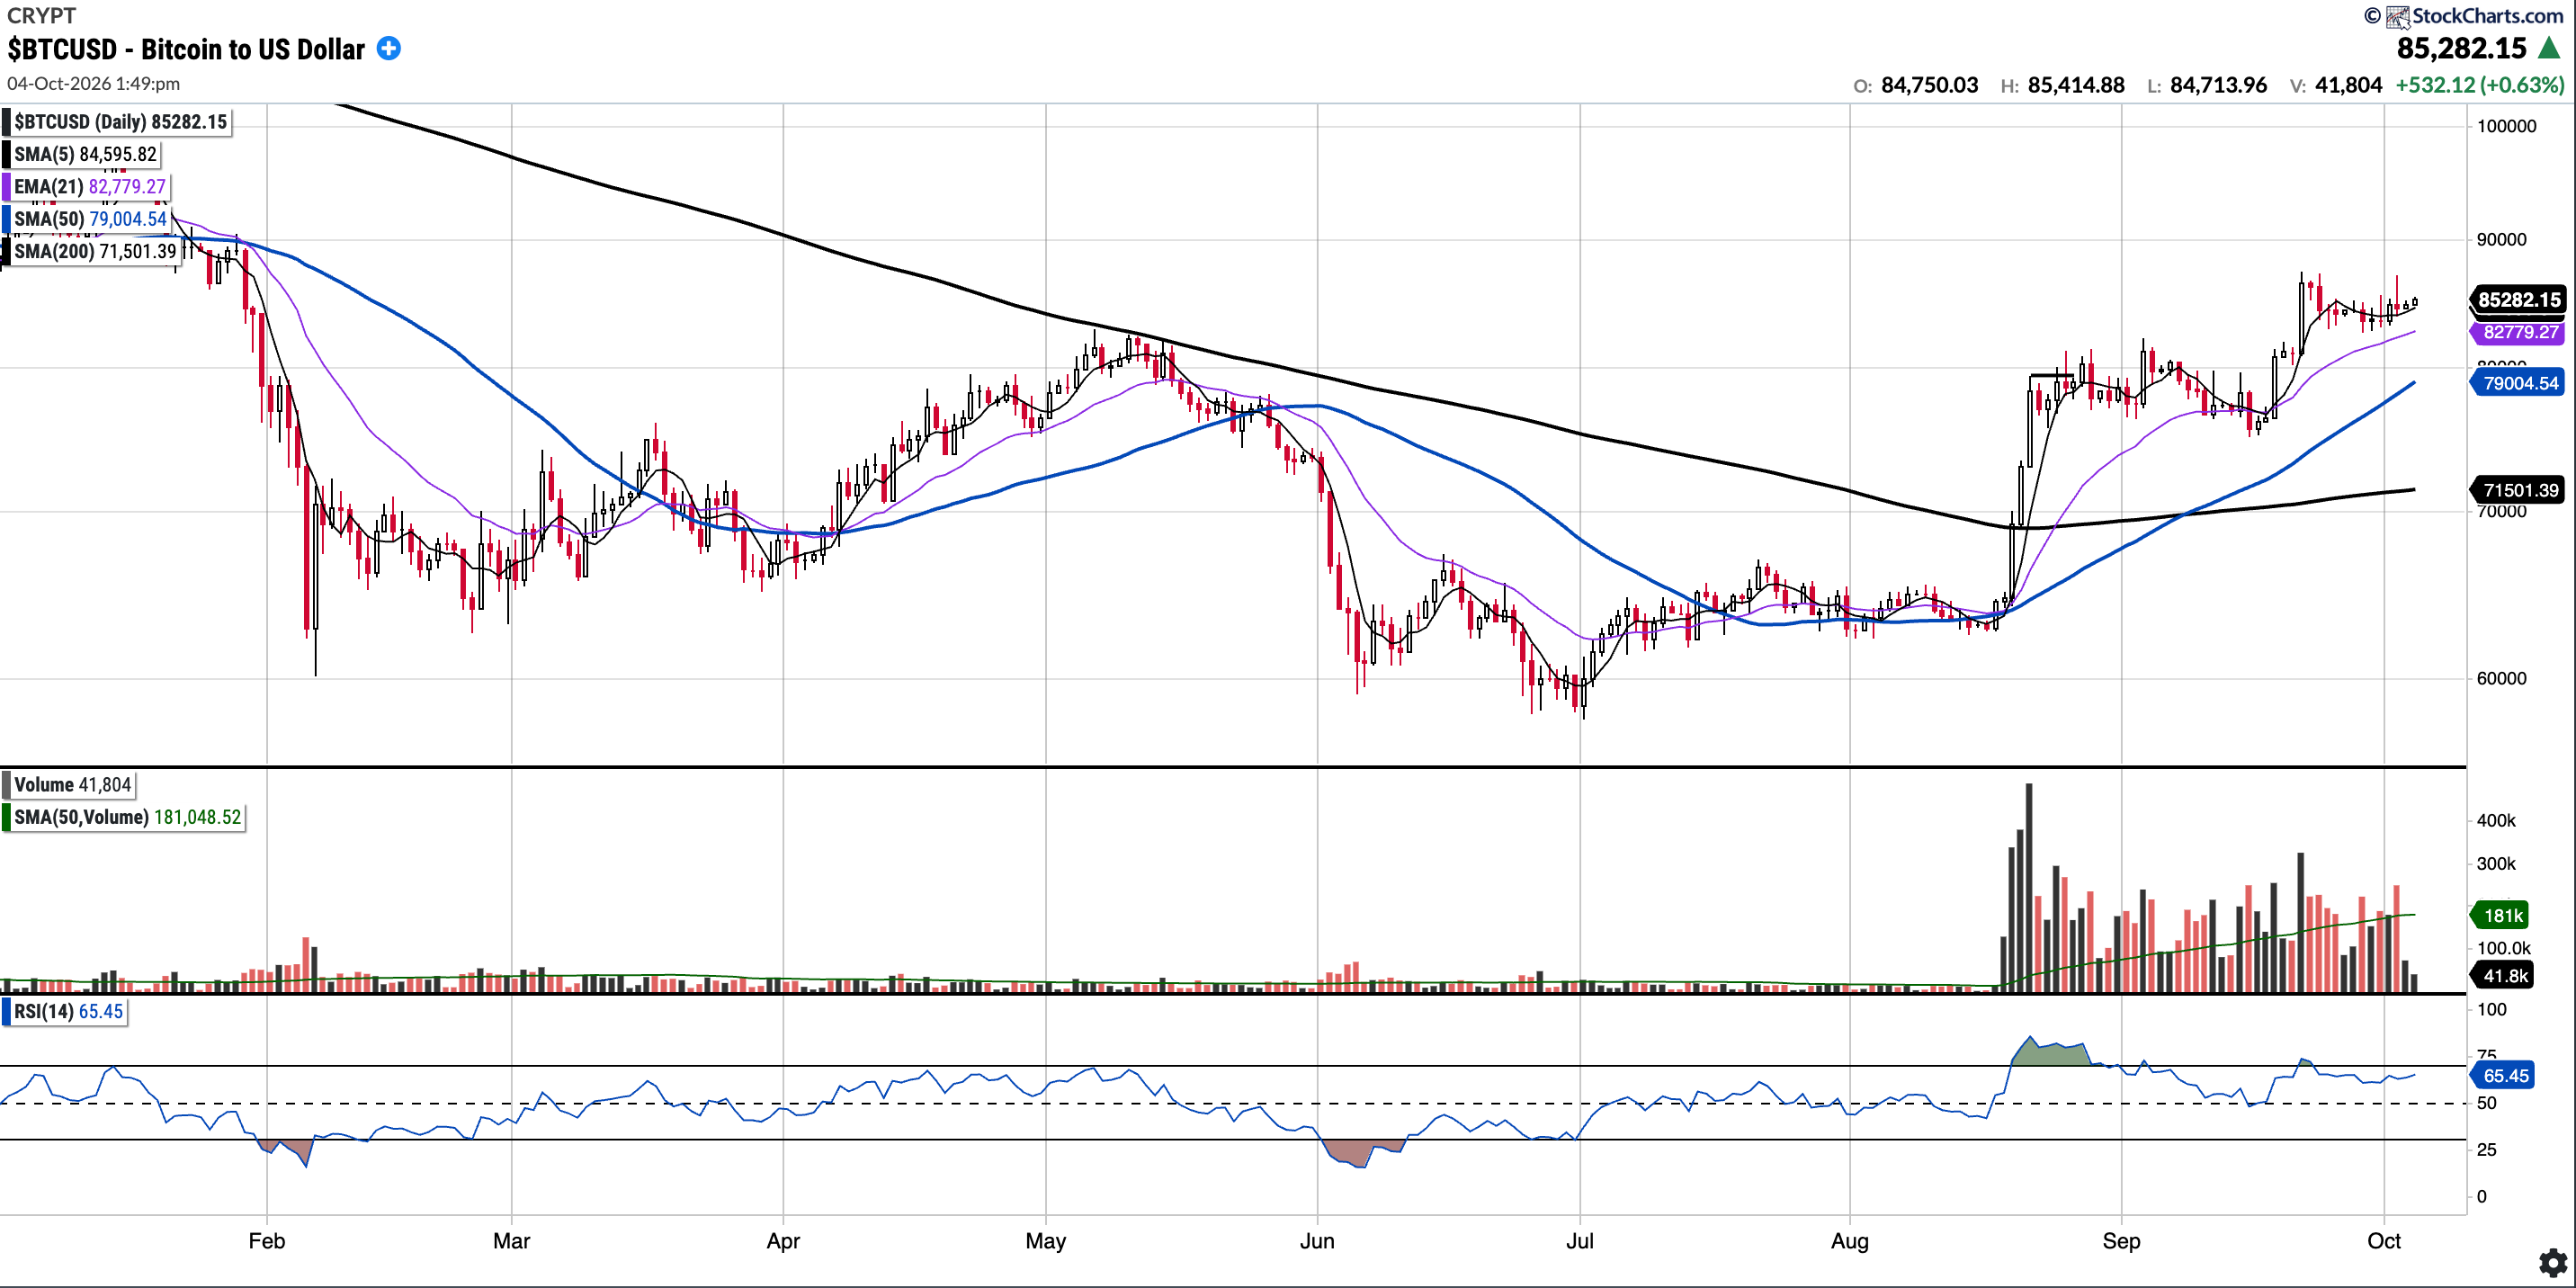
BTC (currently Long)
Currently trades at $84,829.76, 7.94% above the 50SMA and 19.26% above the 200SMA.
RSI 65.45
-2.57% YTD
As of Sunday 4th October 14:48 BST, BTC is trading at $85,282.15.
BTC spent the week consolidating above the $81K–$83K zone, which has now flipped from resistance to support for now. While price holds above all of its key moving averages, the $87K–$88K level flagged last week remains uncleared, and bulls will want to watch for a break through it to trigger the next leg higher.
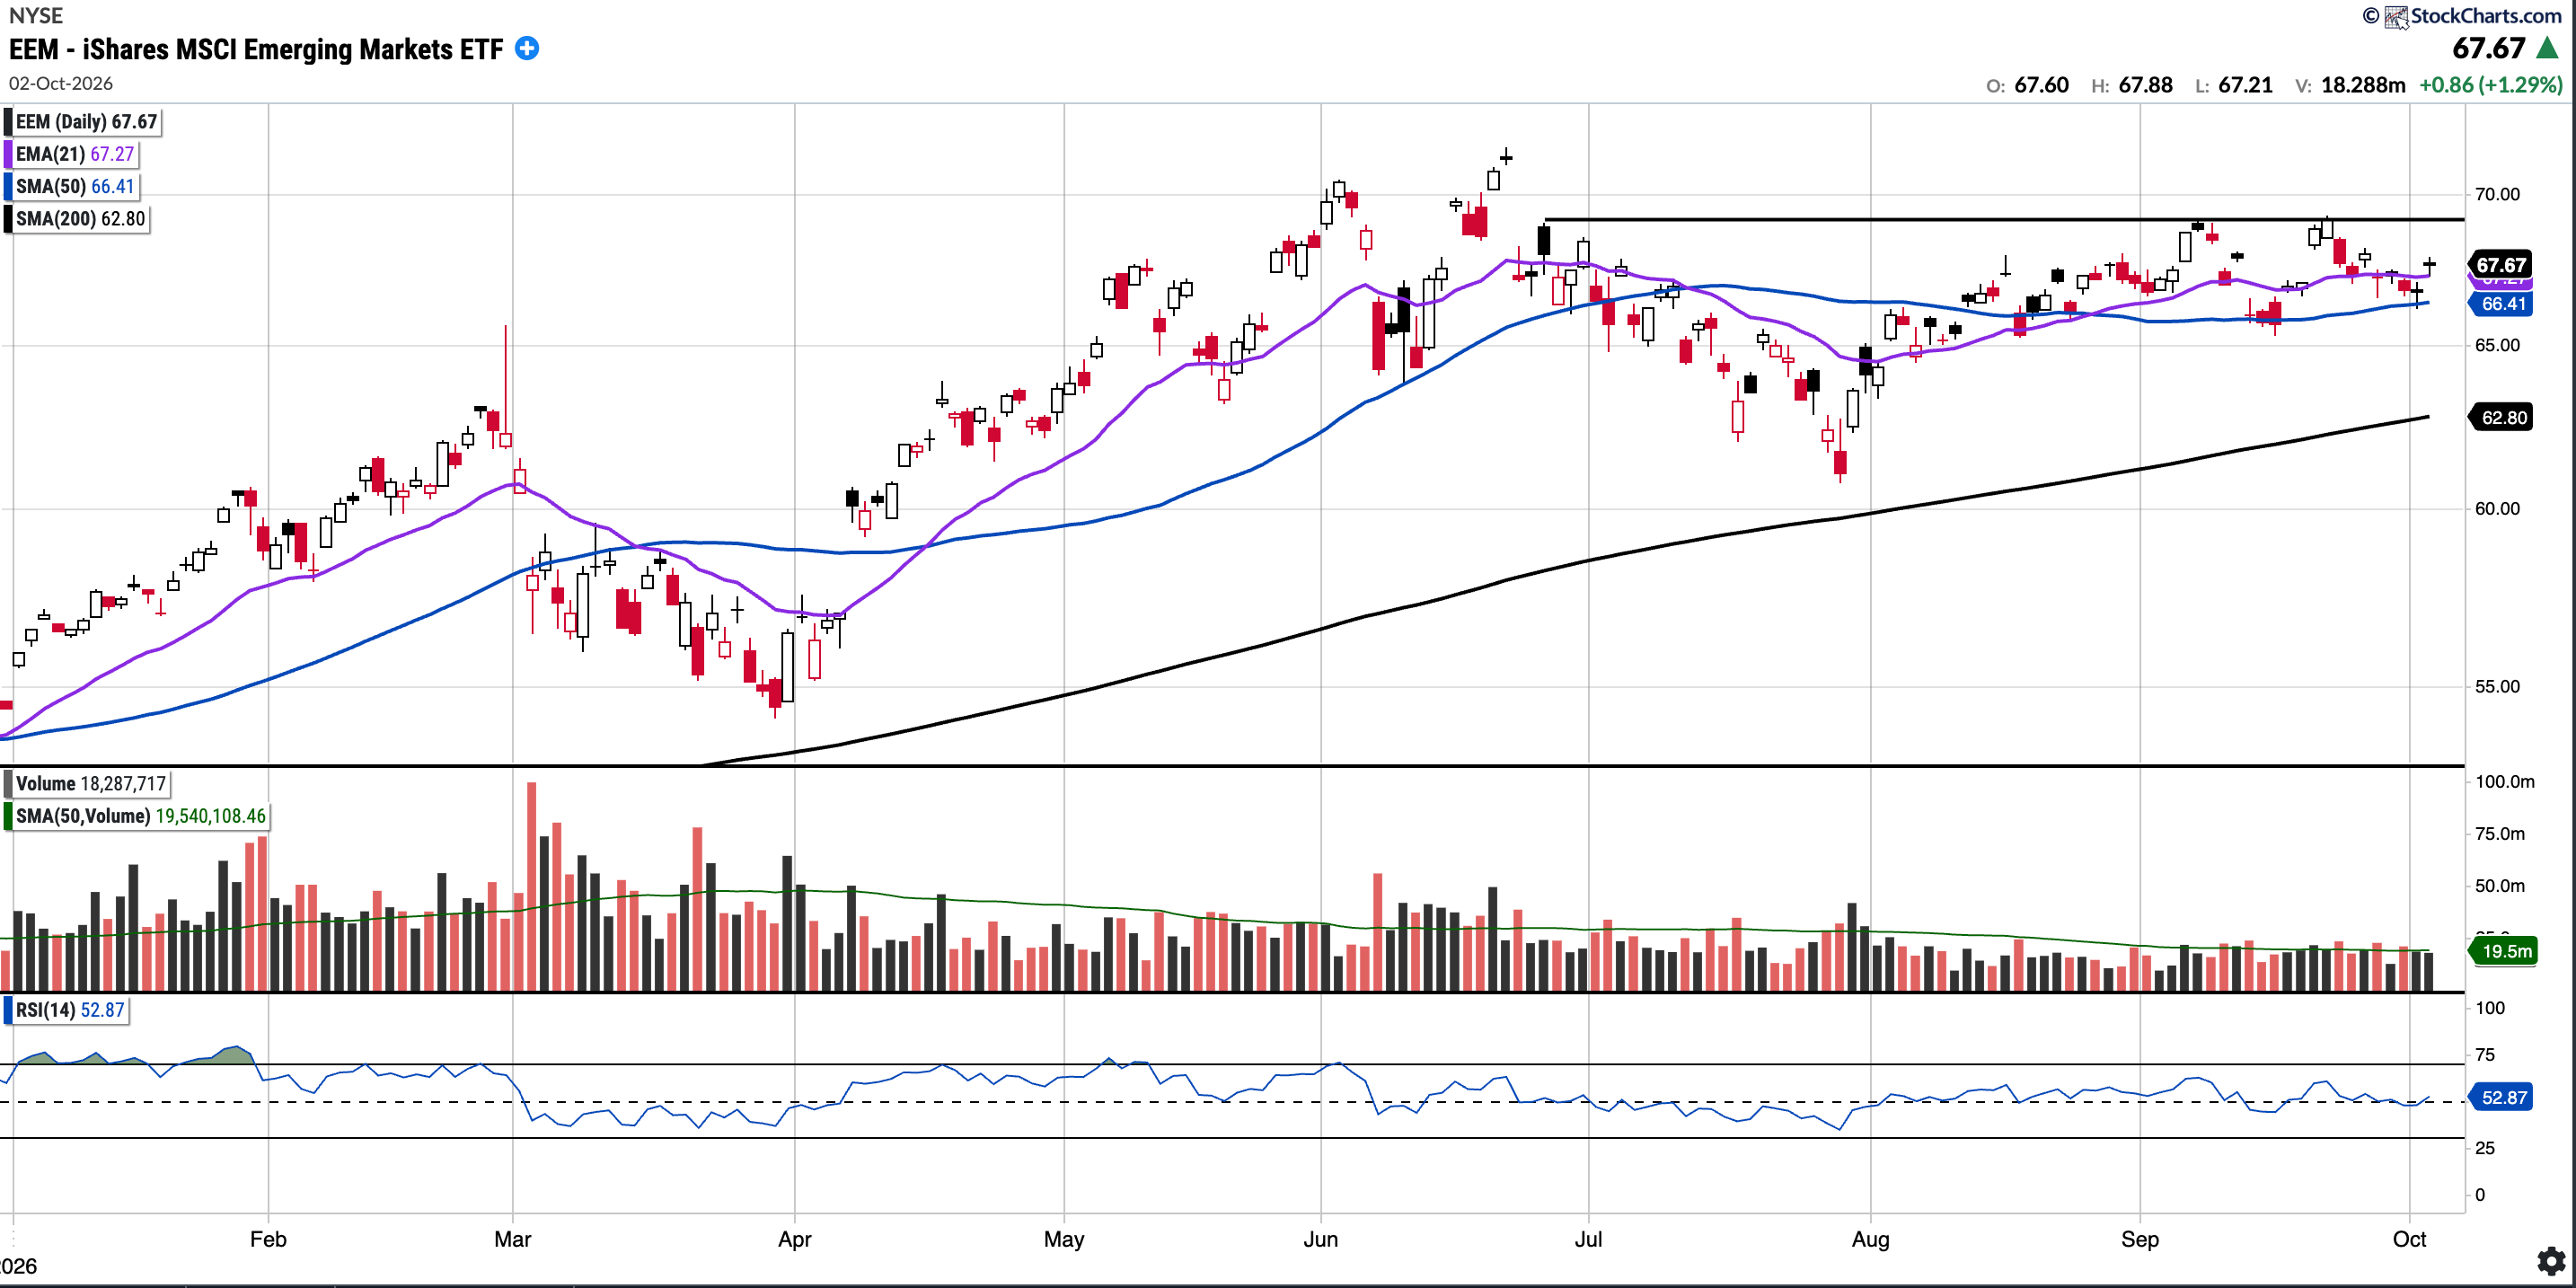
EEM
Currently trades at $67.98, 2.81% above the 50SMA and 8.84% above the 200SMA.
RSI 54.19
21.50% YTD
EEM has now rejected the $69 level two times over the last month, and continues to hold just below. While price bounced off of the 50 SMA earlier this week, keeping the broader uptrend intact, a decisive break above $69-70 is what bulls need to watch for the next leg higher.
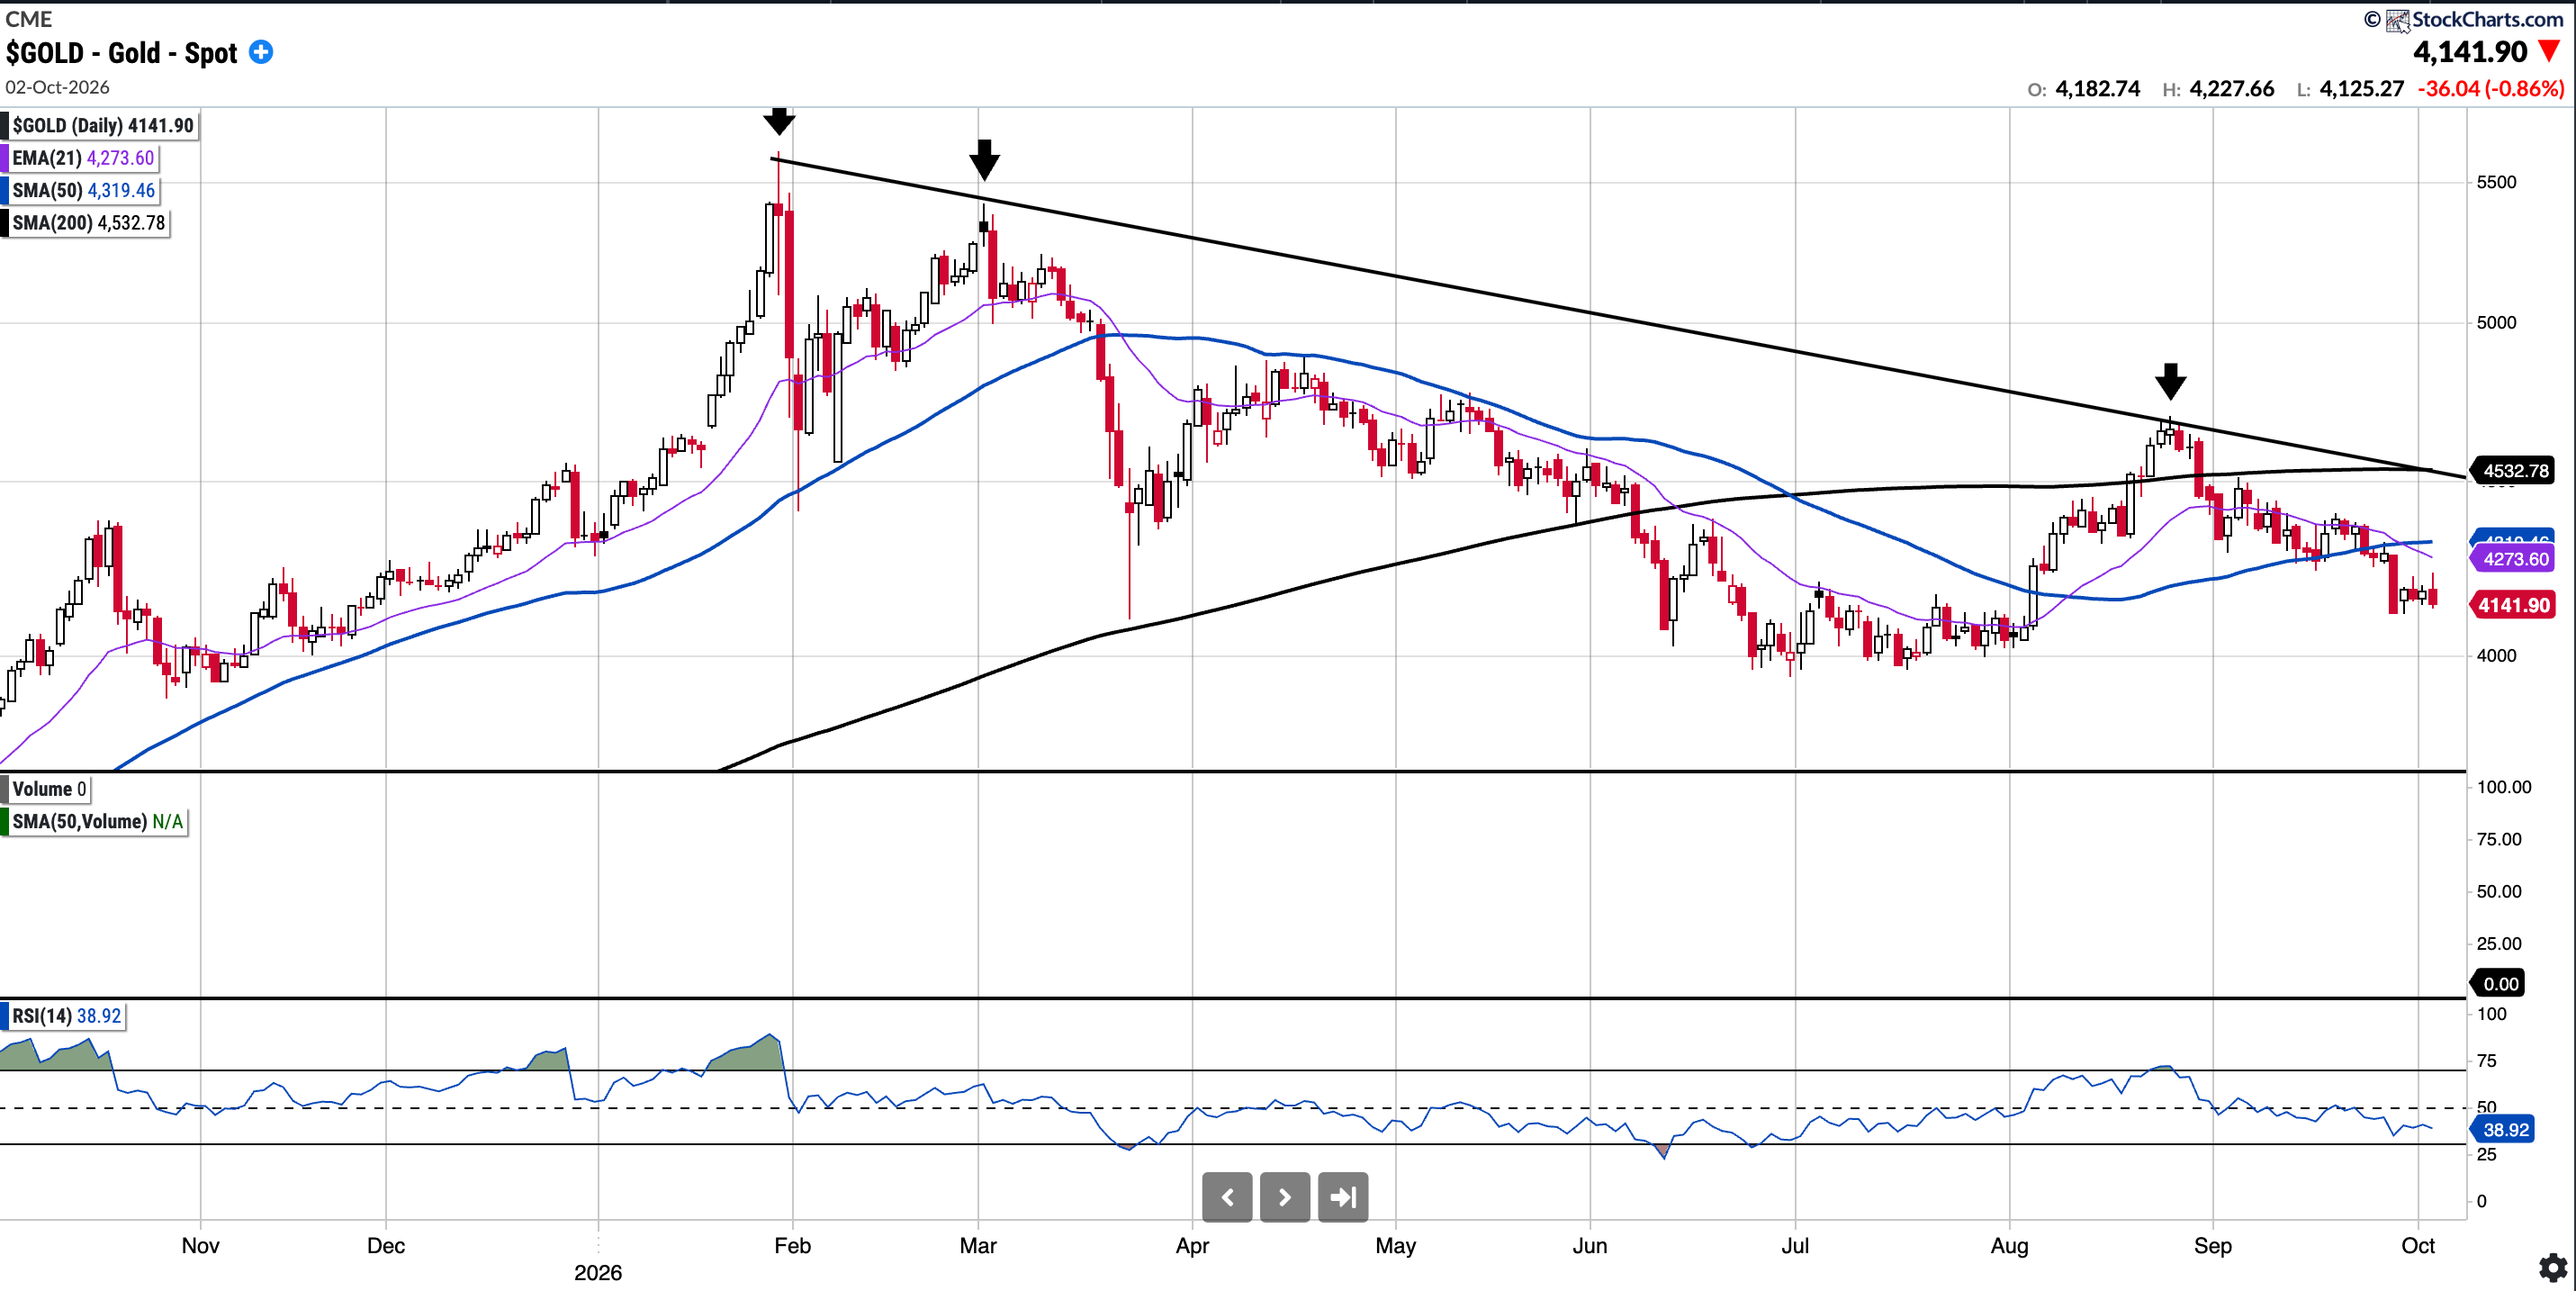
GOLD (Long Physical)
Currently trades at $4,283.78, 0.60% below the 50SMA and 5.55% below the 200SMA.
RSI 44.82
-1.17% YTD
Gold remains in a downtrend from its January peak. A bounce off the $4,100–$4,150 support zone earlier in August has faded, leaving price pinned just below both its 21-day EMA and 50-day SMA, with the 200-day SMA overhead at $4,532.
Bulls need to reclaim the 50-day SMA first, followed by the 200-day SMA and the January descending trendline as major resistance.
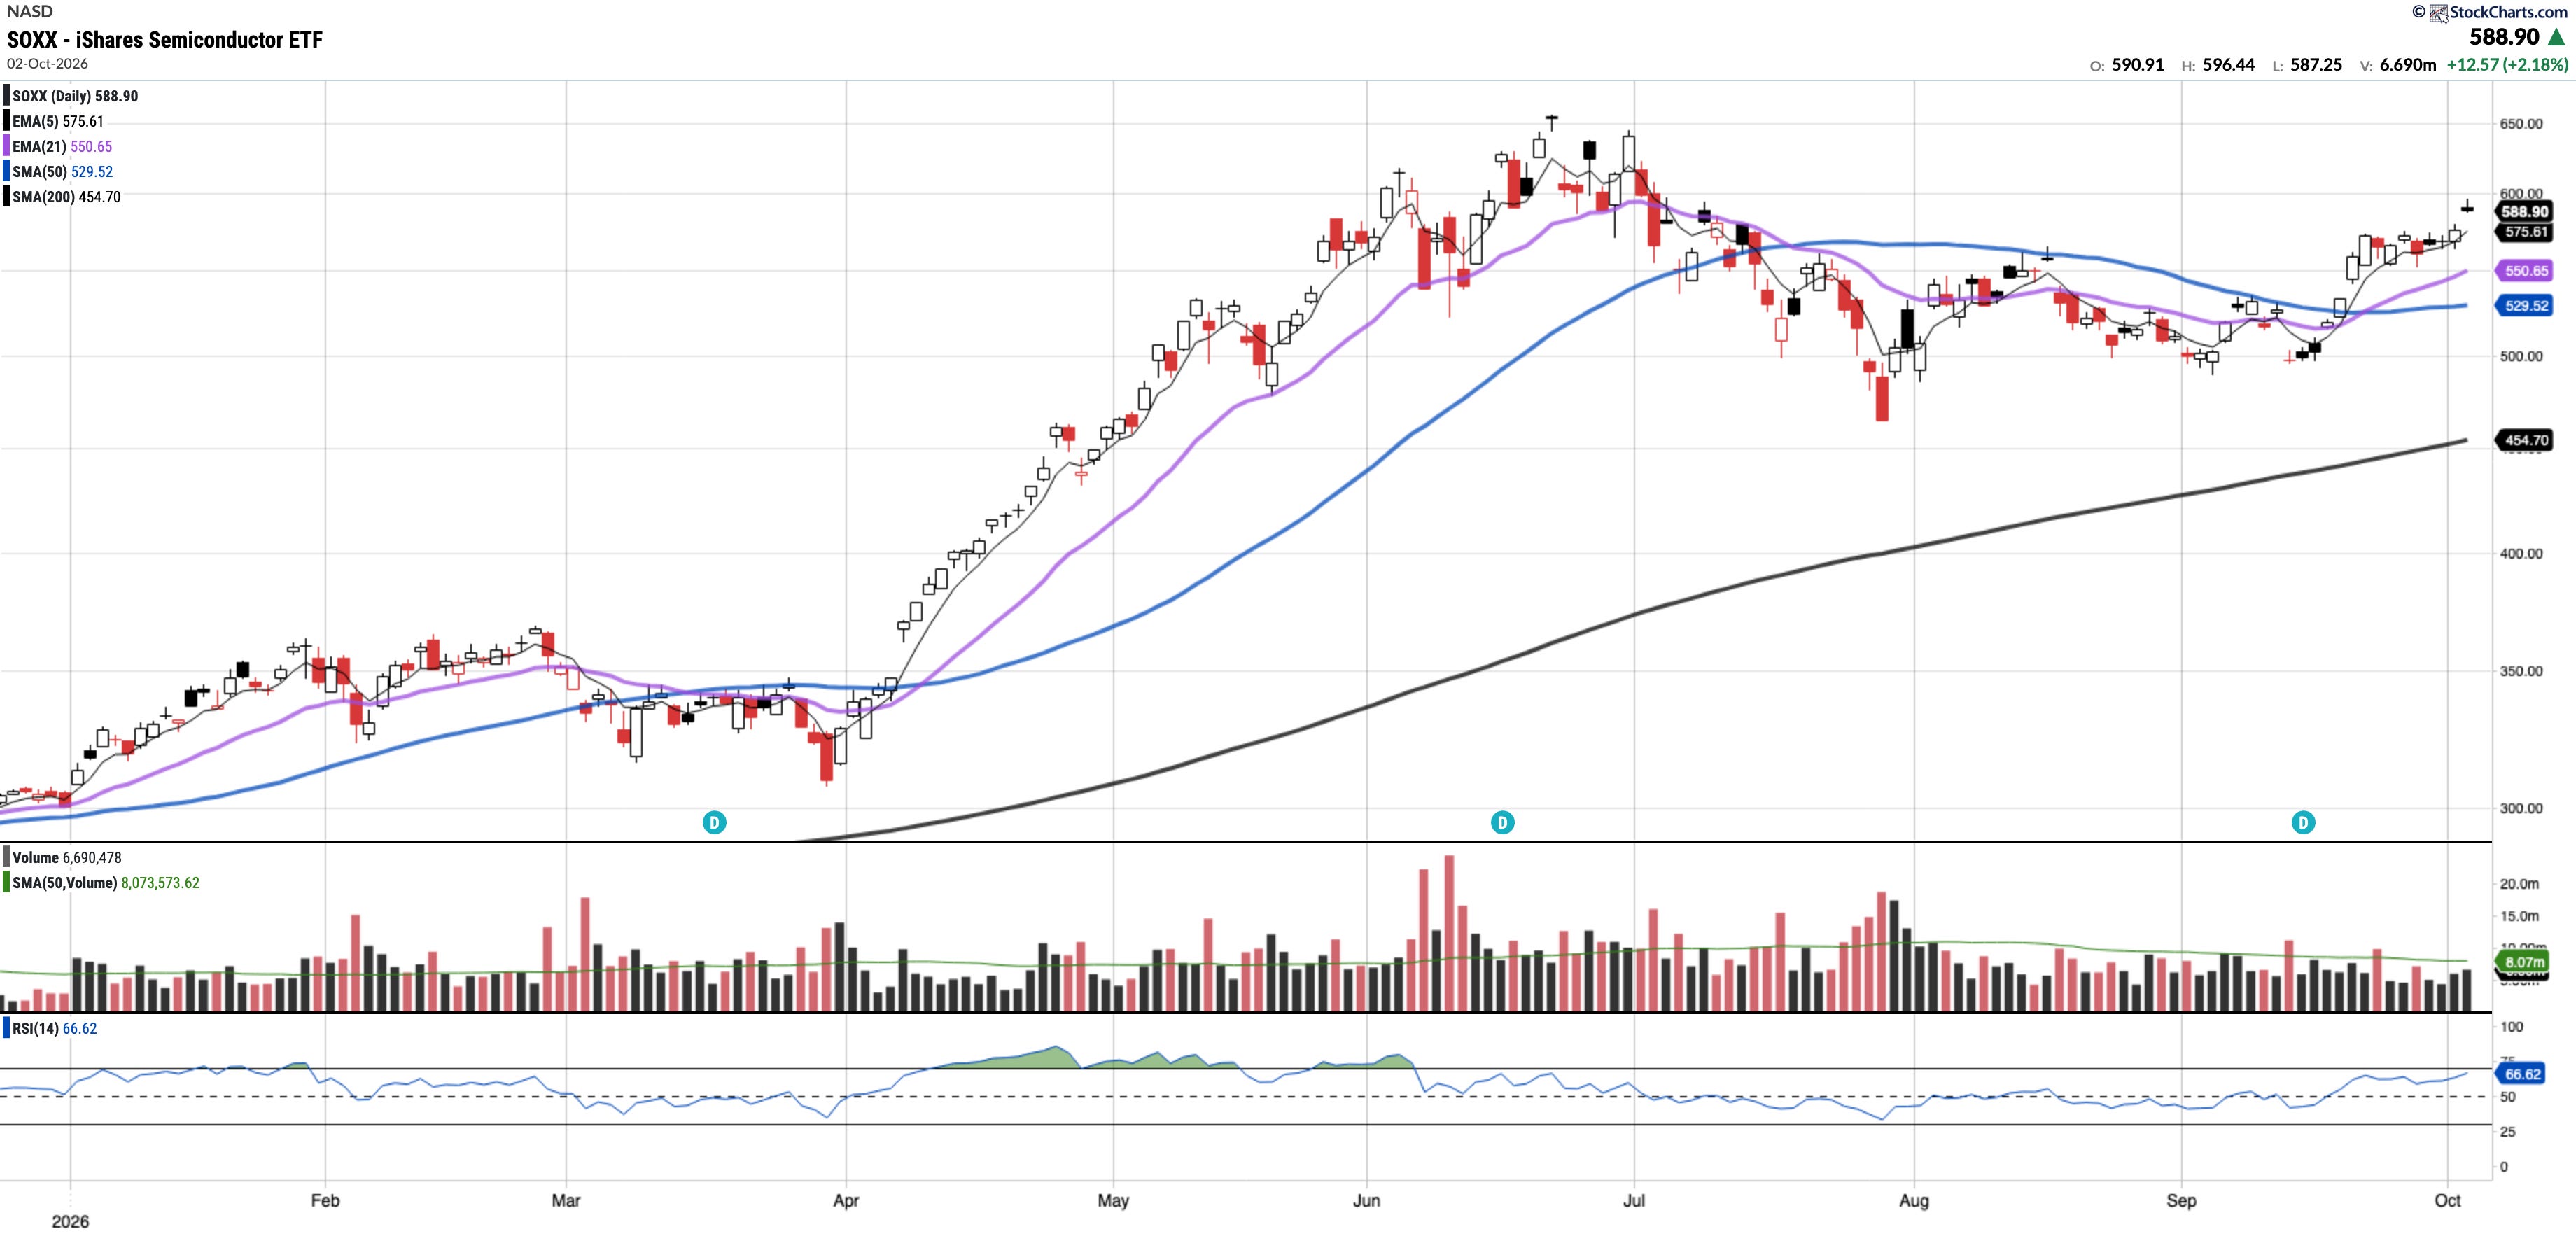
SOXX
Currently trades at $588.90, 11.21% above the 50SMA and 29.51% above the 200SMA.
RSI 66.62
88.06% YTD
SOXX built on last week’s breakout, gapping higher on Friday to close at $588.90 and approach the $595 mark. It is now trading above all of its key moving averages. Whilst Friday’s gap came on below-average volume, bulls would like to see a continuation toward $600 and the June highs of ~$650.
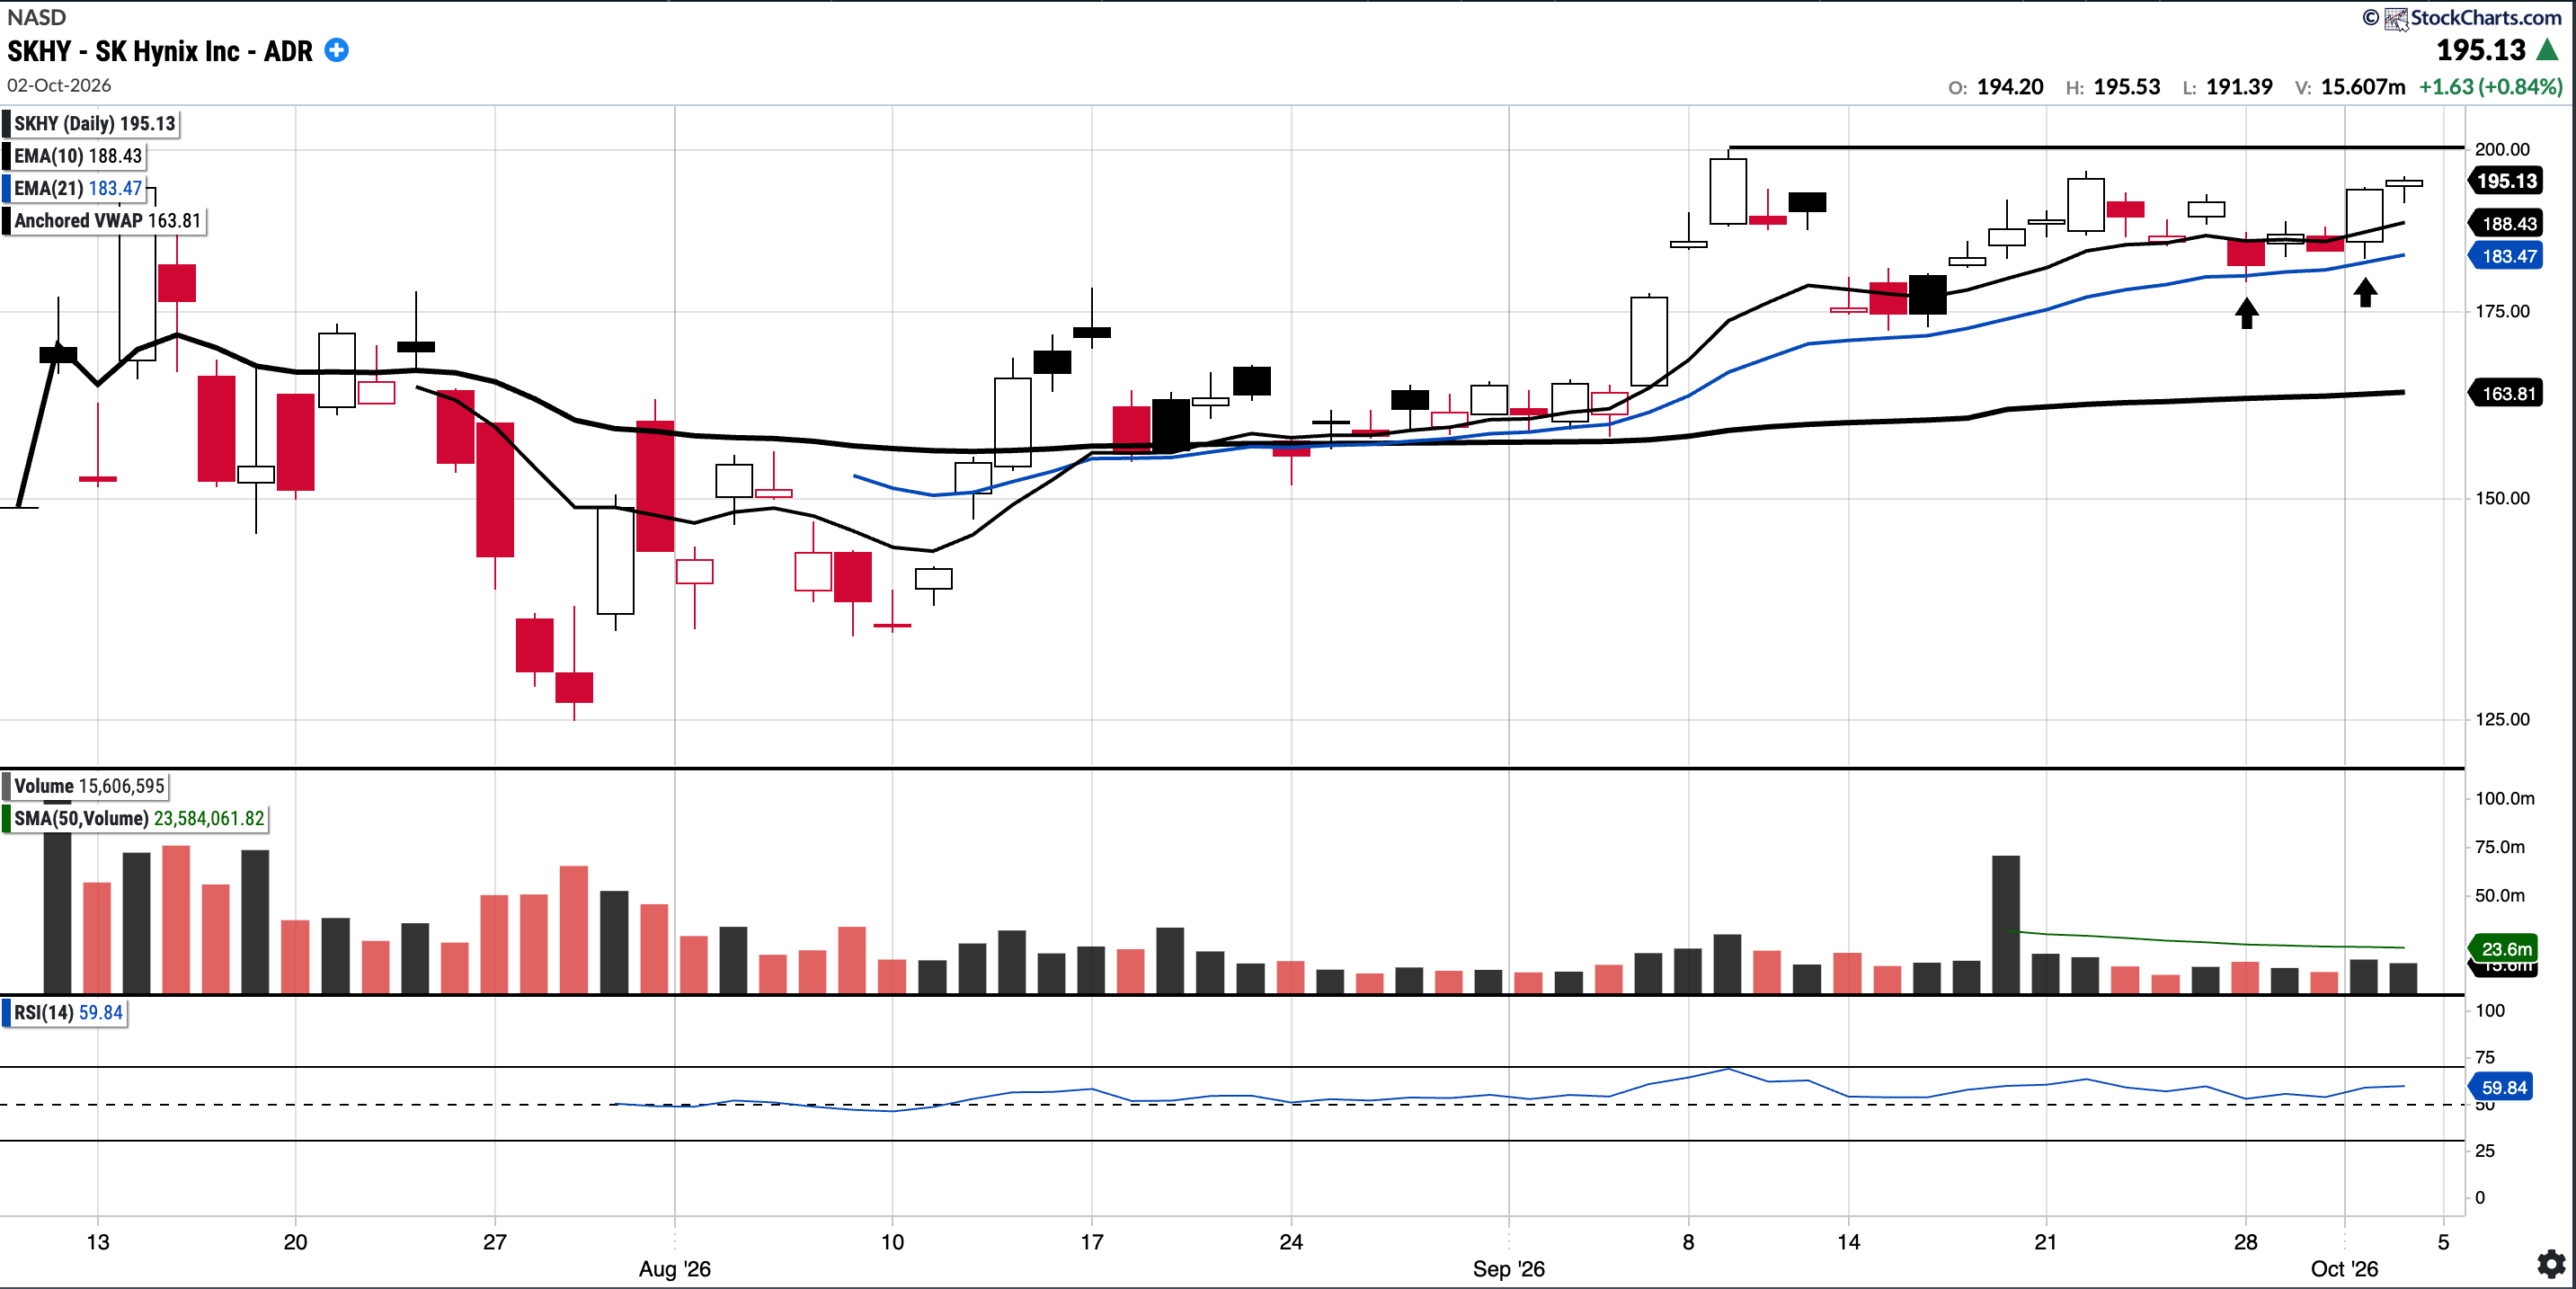
SKHY (Currently Long)
Currently trades at $195.13, 17.16% above the 50SMA.
RSI 59.84
16.14% YTD
Price continues to consolidate beneath resistance at $199–$200, closing the week at $195.13. Pullbacks near the 21EMA found support twice this week (see arrows). Bulls would like a decisive breakout above $199–$200 into all time highs to signal continuation of the broader uptrend.
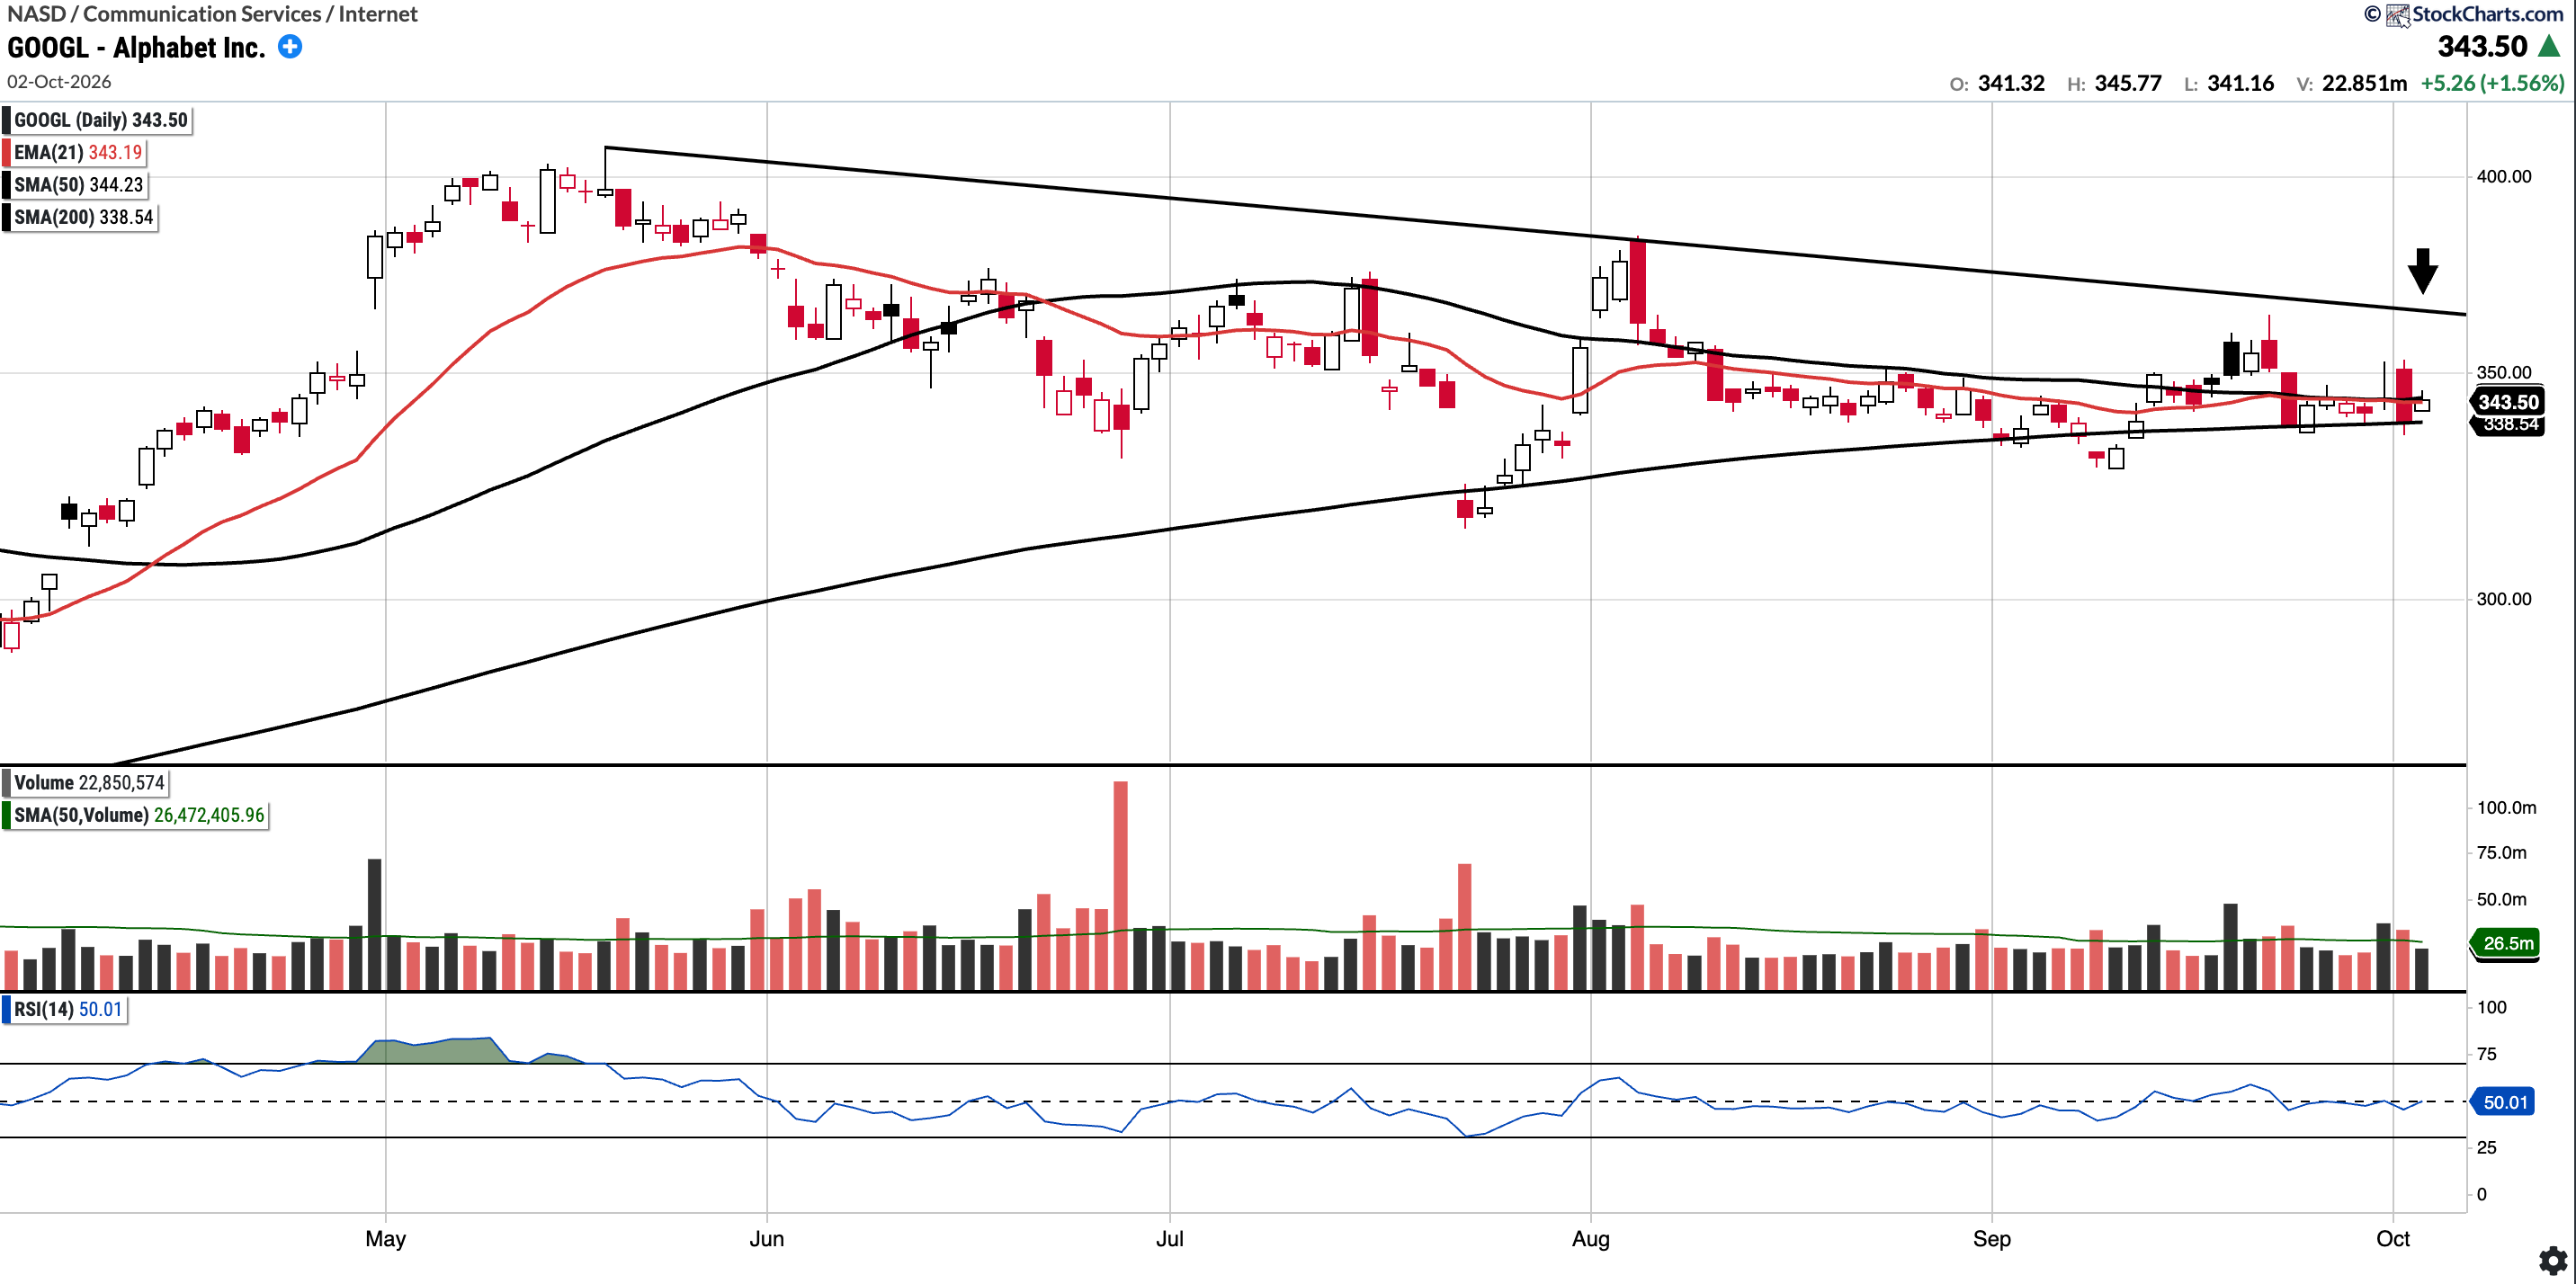
GOOGL (Currently Long)
Currently trades at $343.50, 0.21% below the 50SMA and 1.46% above the 200SMA.
RSI 50.01
9.21% YTD
GOOGL once again tested the 200-day SMA ($338.54), the level I have flagged as key support over the past few weeks, before Friday’s bounce took price back up to its 21EMA and 50-day SMA ($343–$344). Price remains compressed between the 200-day and 50-day SMAs, with the descending trendline from the May high (see arrow), near $365, as overhead resistance. Bulls need to reclaim the 50-day SMA and break above that trendline to confirm a breakout, with a potential rally into all time highs past $400-$410.
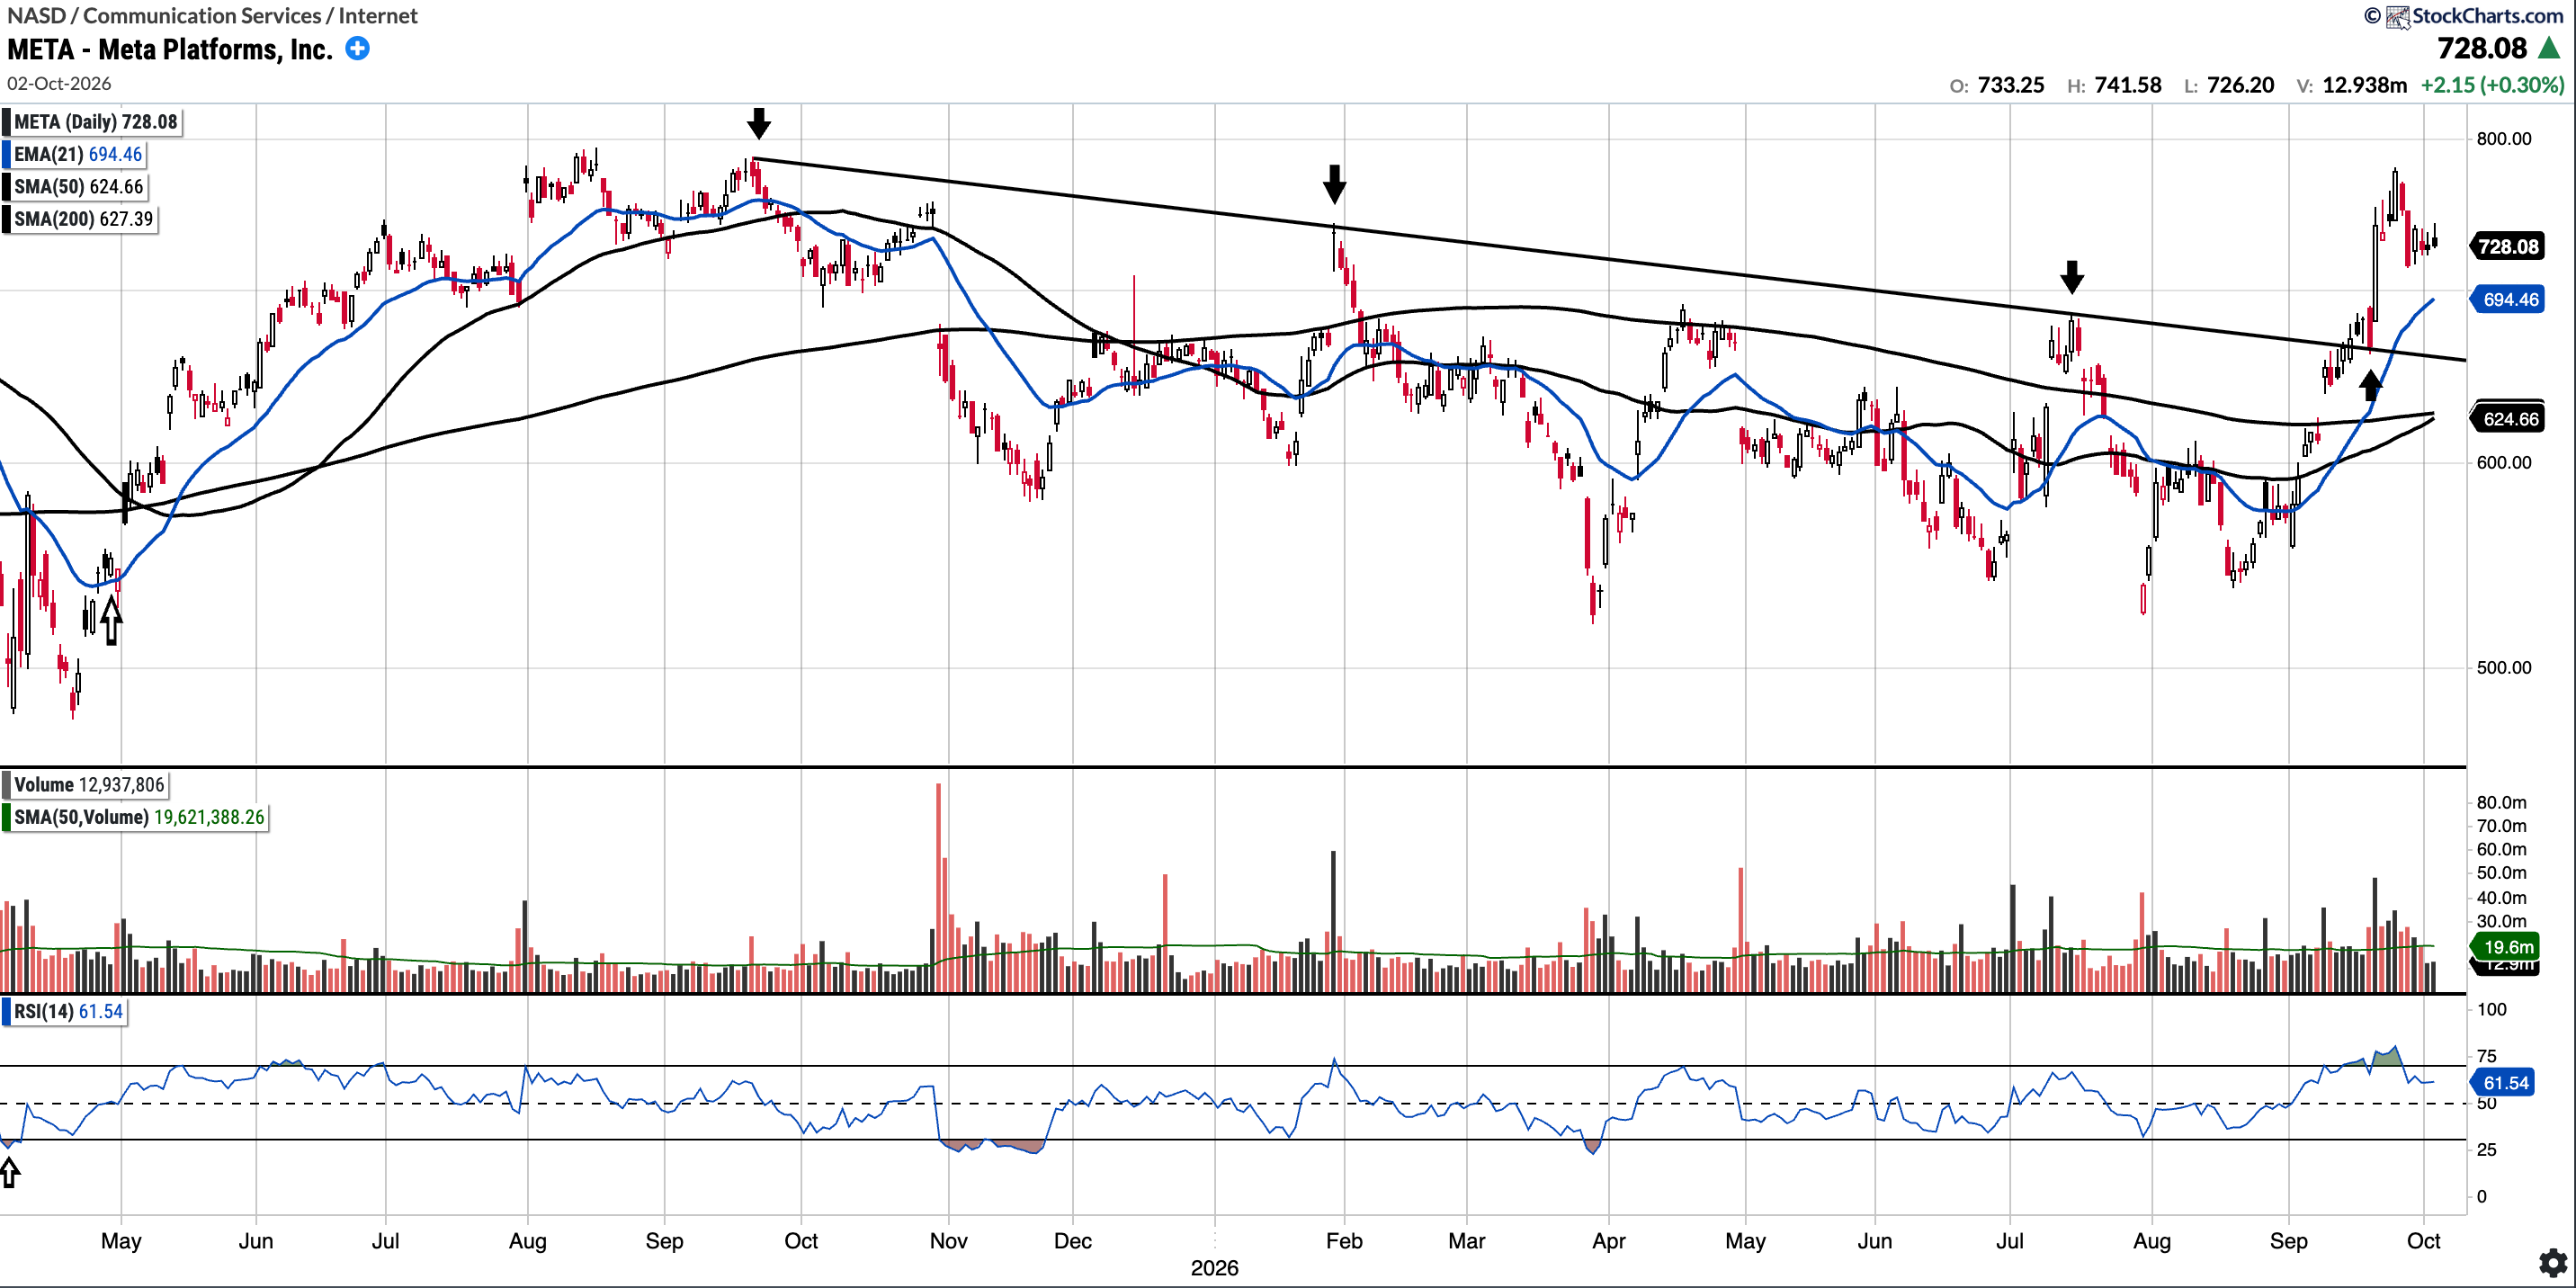
META (Currently Long)
Currently trades at $728.08, 16.56% above the 50SMA and 16.05% above the 200SMA.
RSI 61.54
12.23% YTD
META pulled back this week as expected, consolidating after its run toward 2026 highs and finding support at the $713.5 level (see arrow). Friday’s close at $728.08 keeps price above its key moving averages, and well above the year-long descending trendline. $710-$715 is the level bulls need to defend before another attempt at another rally.
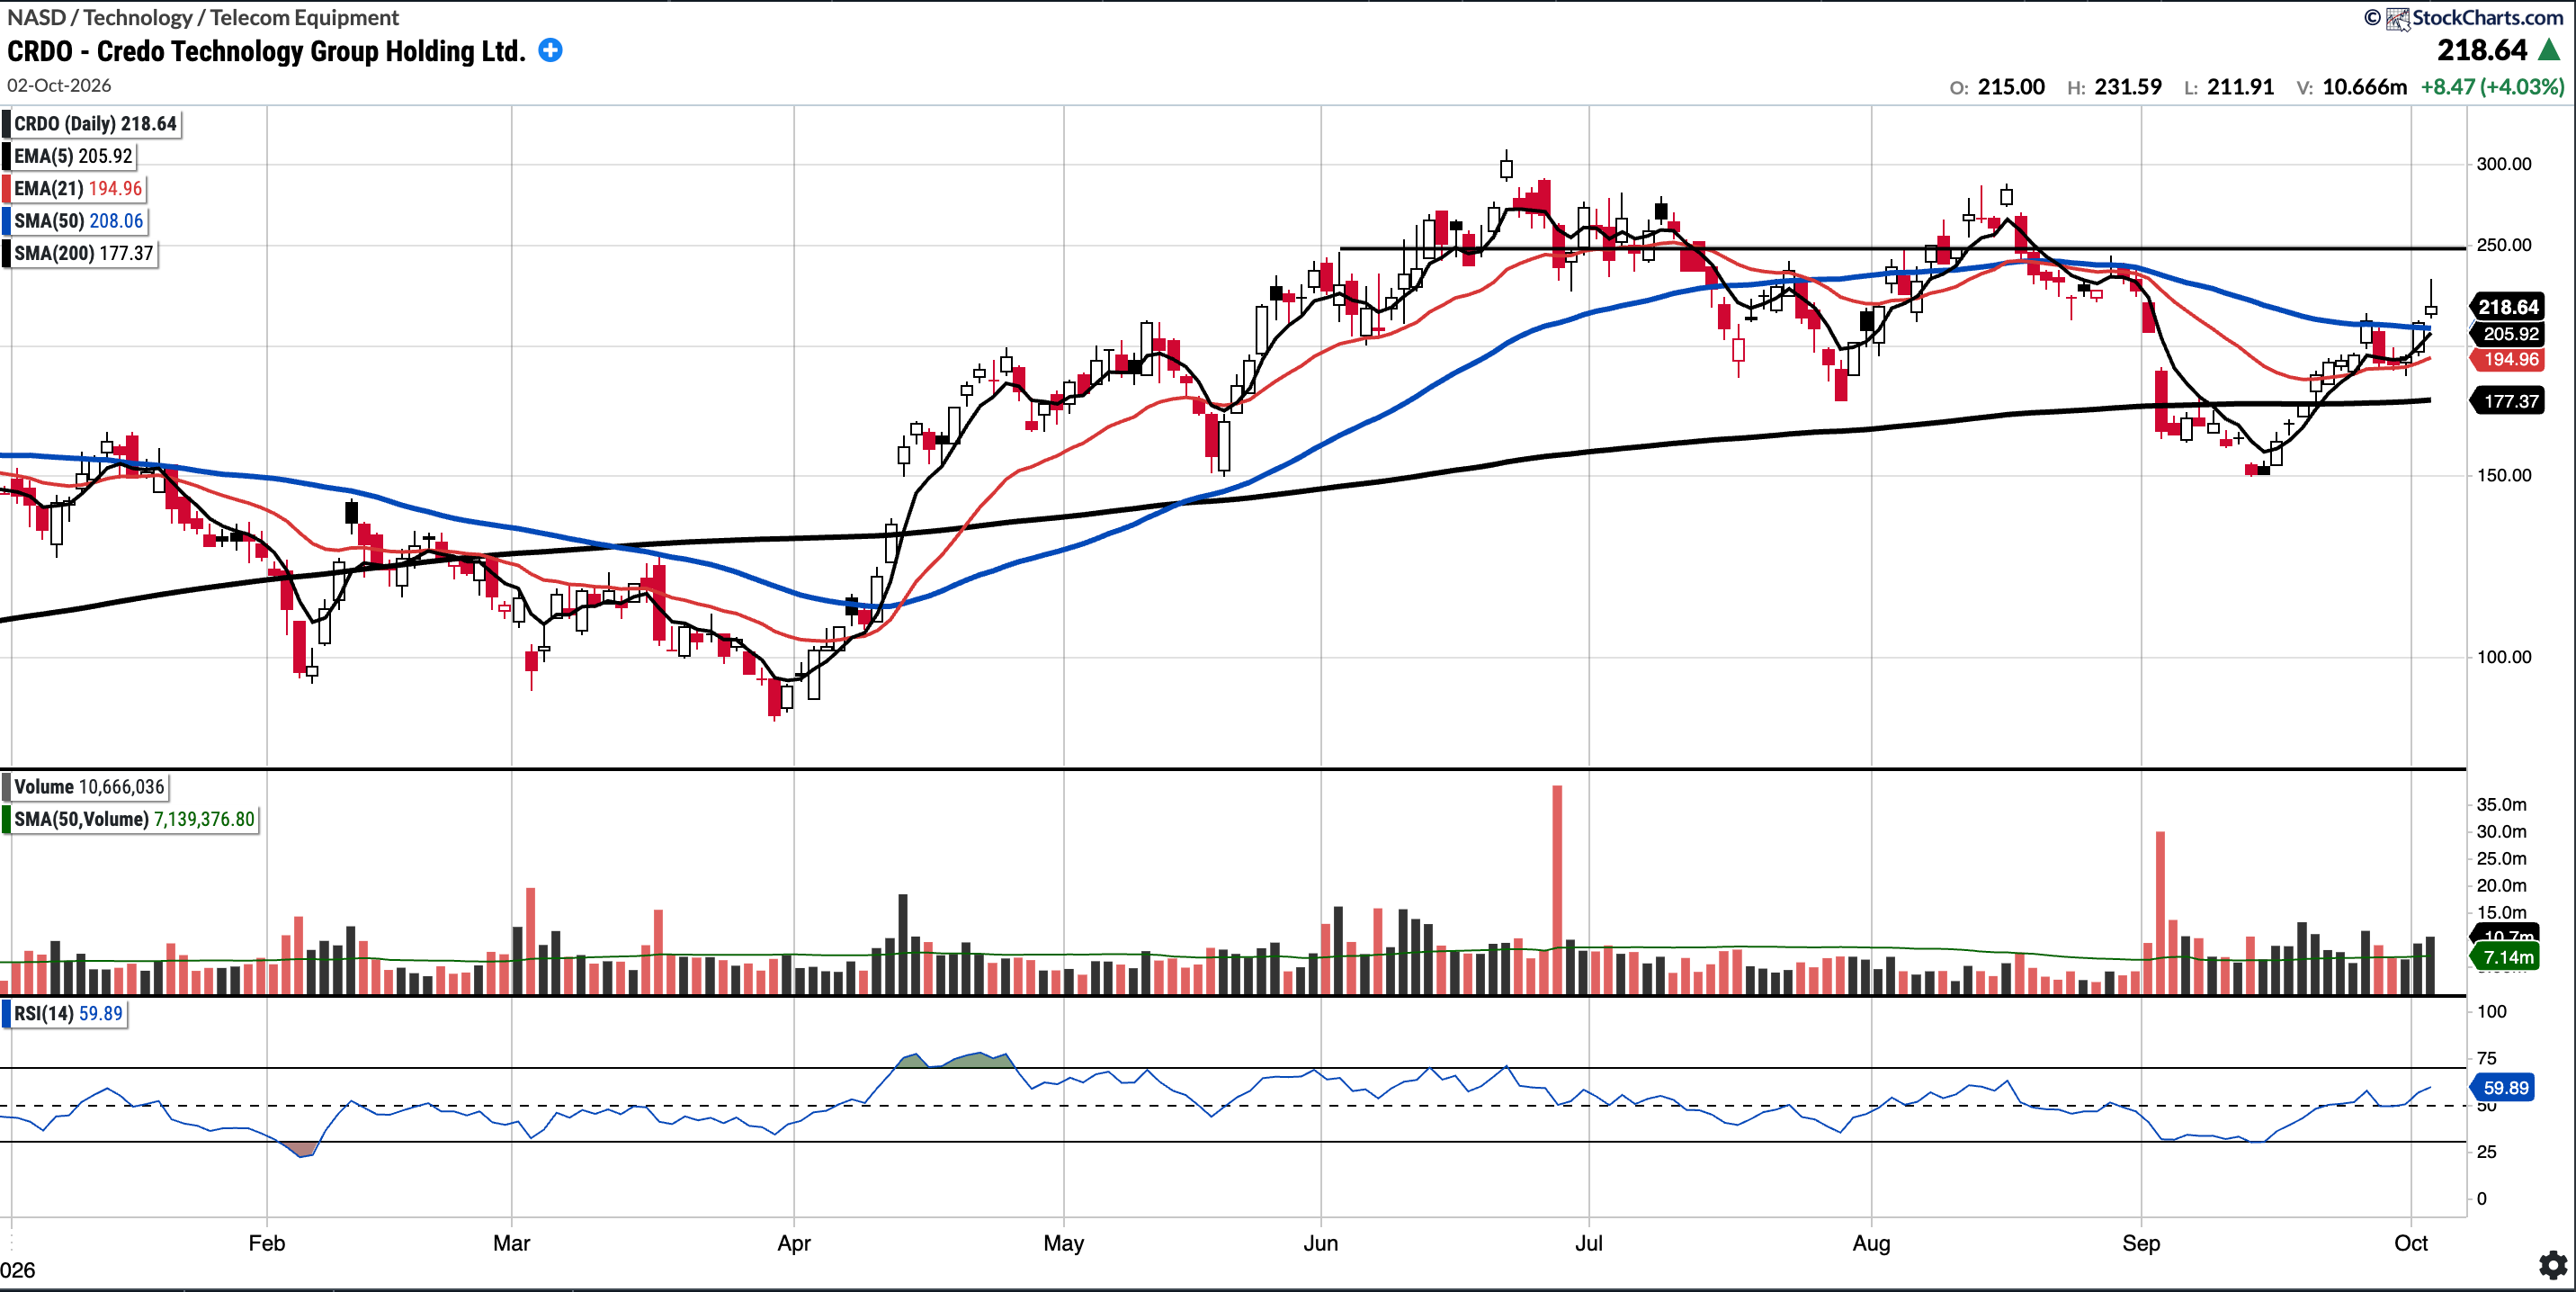
CRDO
Currently trades at $218.64, 5.08% above the 50SMA and 23.27% above the 200SMA.
RSI 59.89
52.66% YTD
CRDO found support at the 21-EMA on Thursday and then rallied above its 50-SMA, trading as high as 231 before closing at 218. It is now above all of its key moving averages. Bulls will want to see the 50-SMA flipped to support and the overhead 250 level reclaimed, as that has been a resistance level.
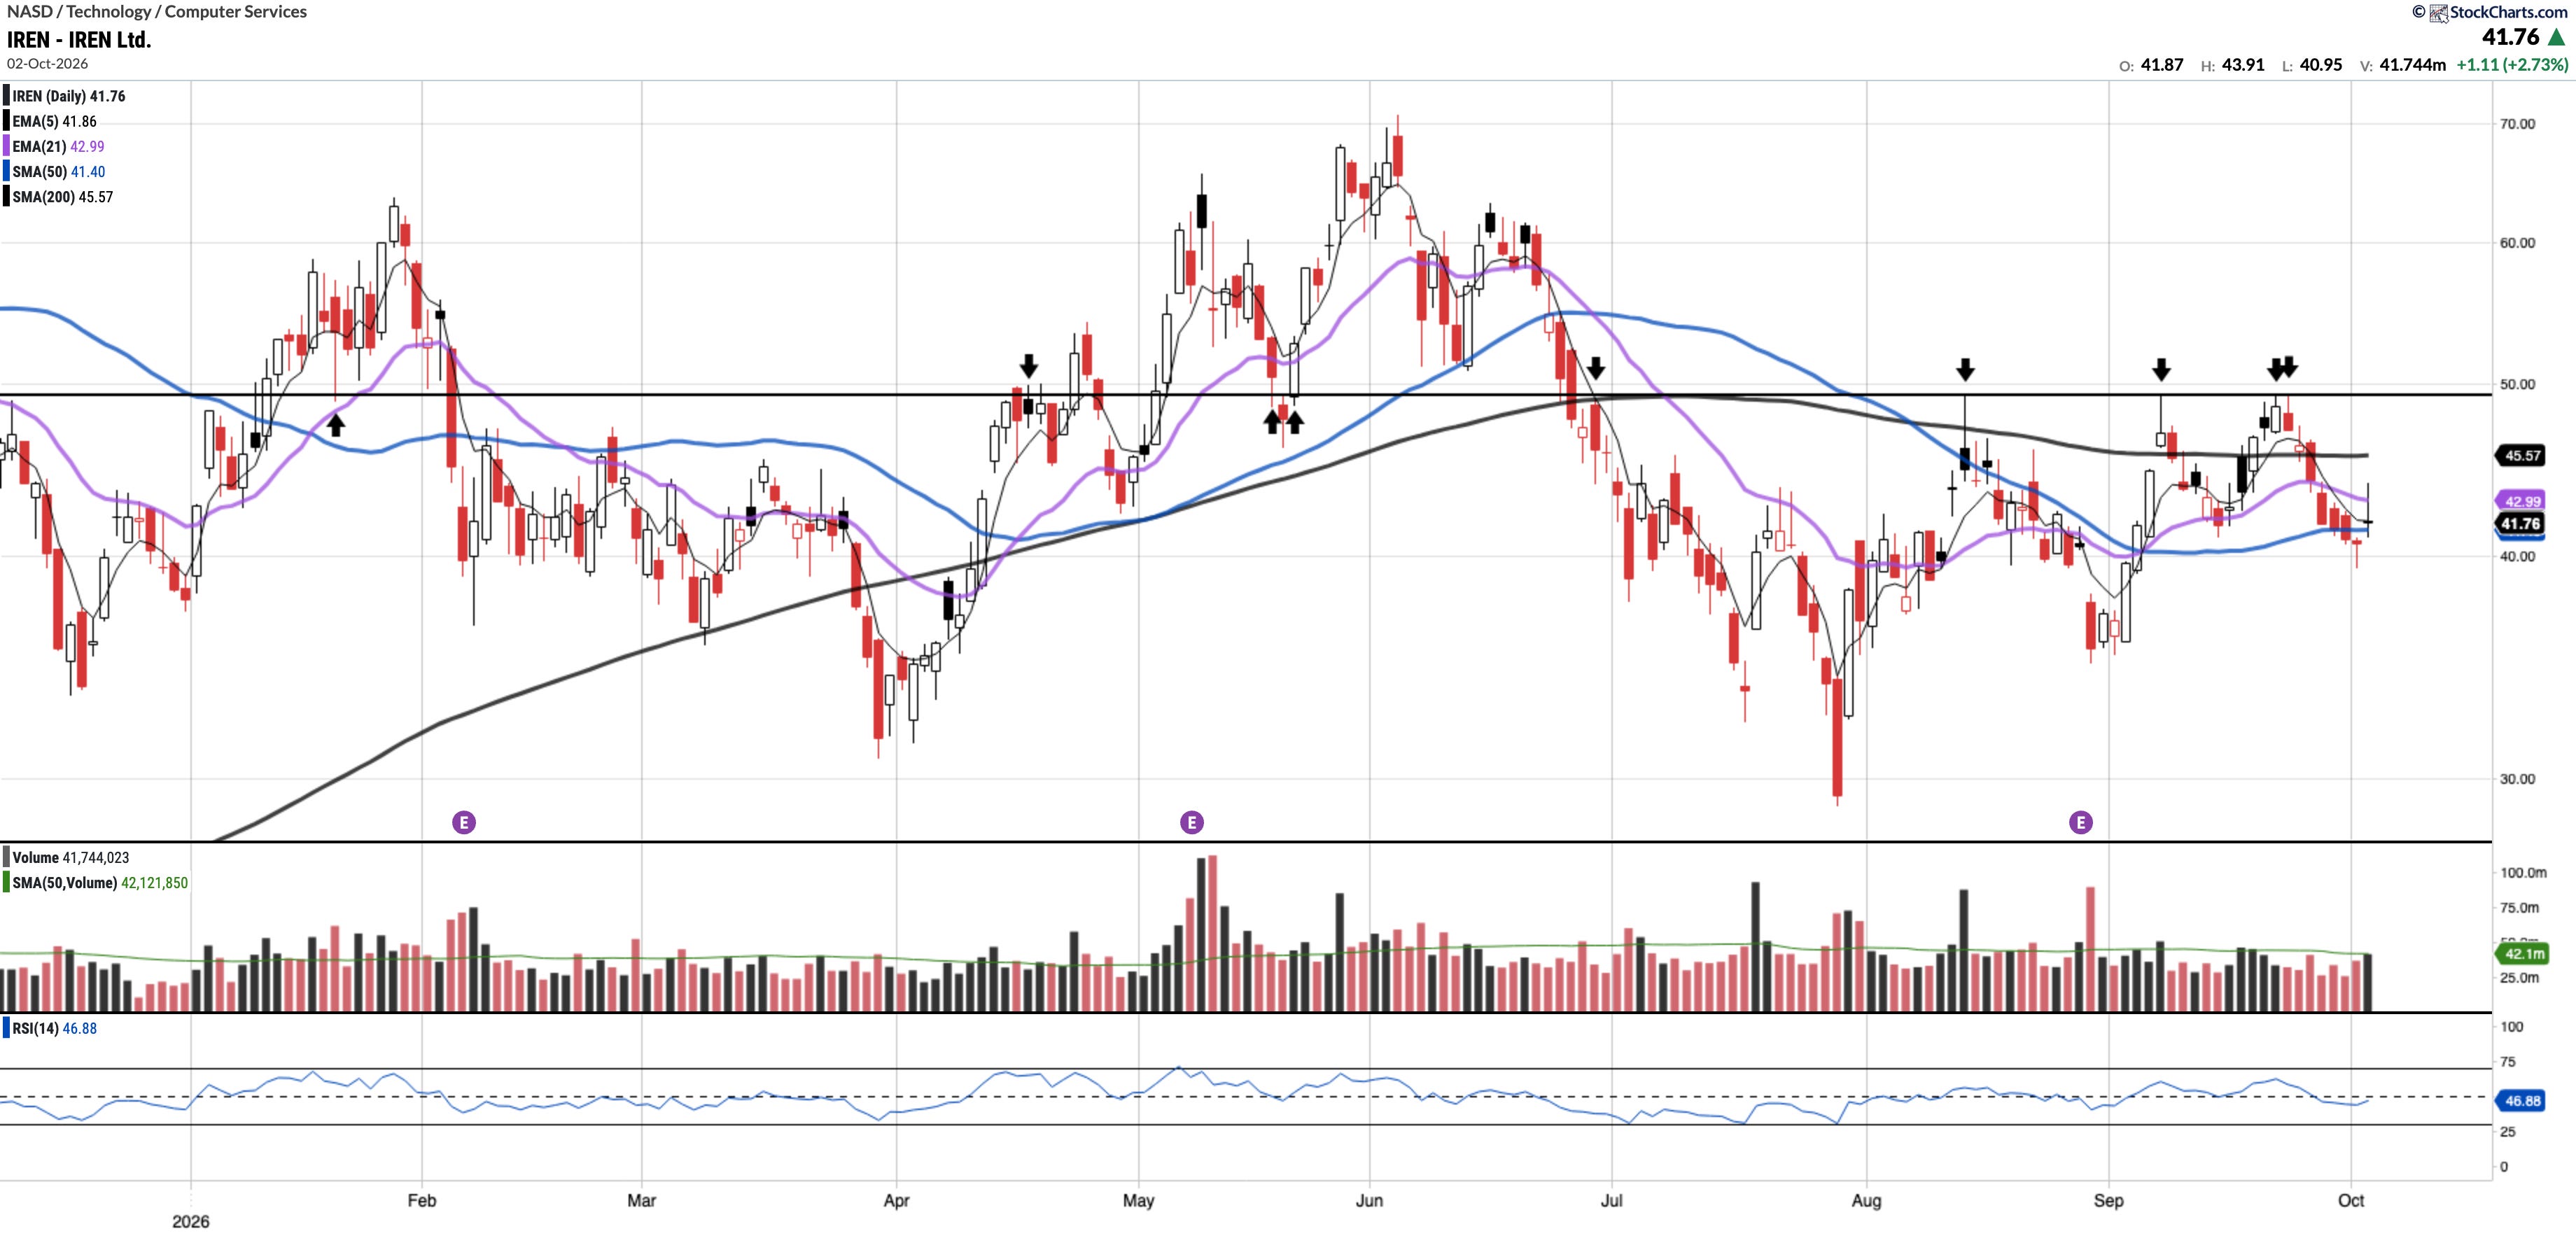
IREN (Currently Long)
Currently trades at $41.76, 0.88% above the 50SMA and 8.37% below the 200SMA.
RSI 46.88
-2.20% YTD
IREN pulled back after its latest rejection at the $49 mark (see arrows), falling below its 50SMA ($41.40) on Thursday before reclaiming it on Friday. Price is back below the 21EMA ($42.99) and the 200SMA ($45.57), which are now the immediate resistance. If price reclaims both, the $49 level is back in focus, and a break of that level would likely see price rally into the $60s.
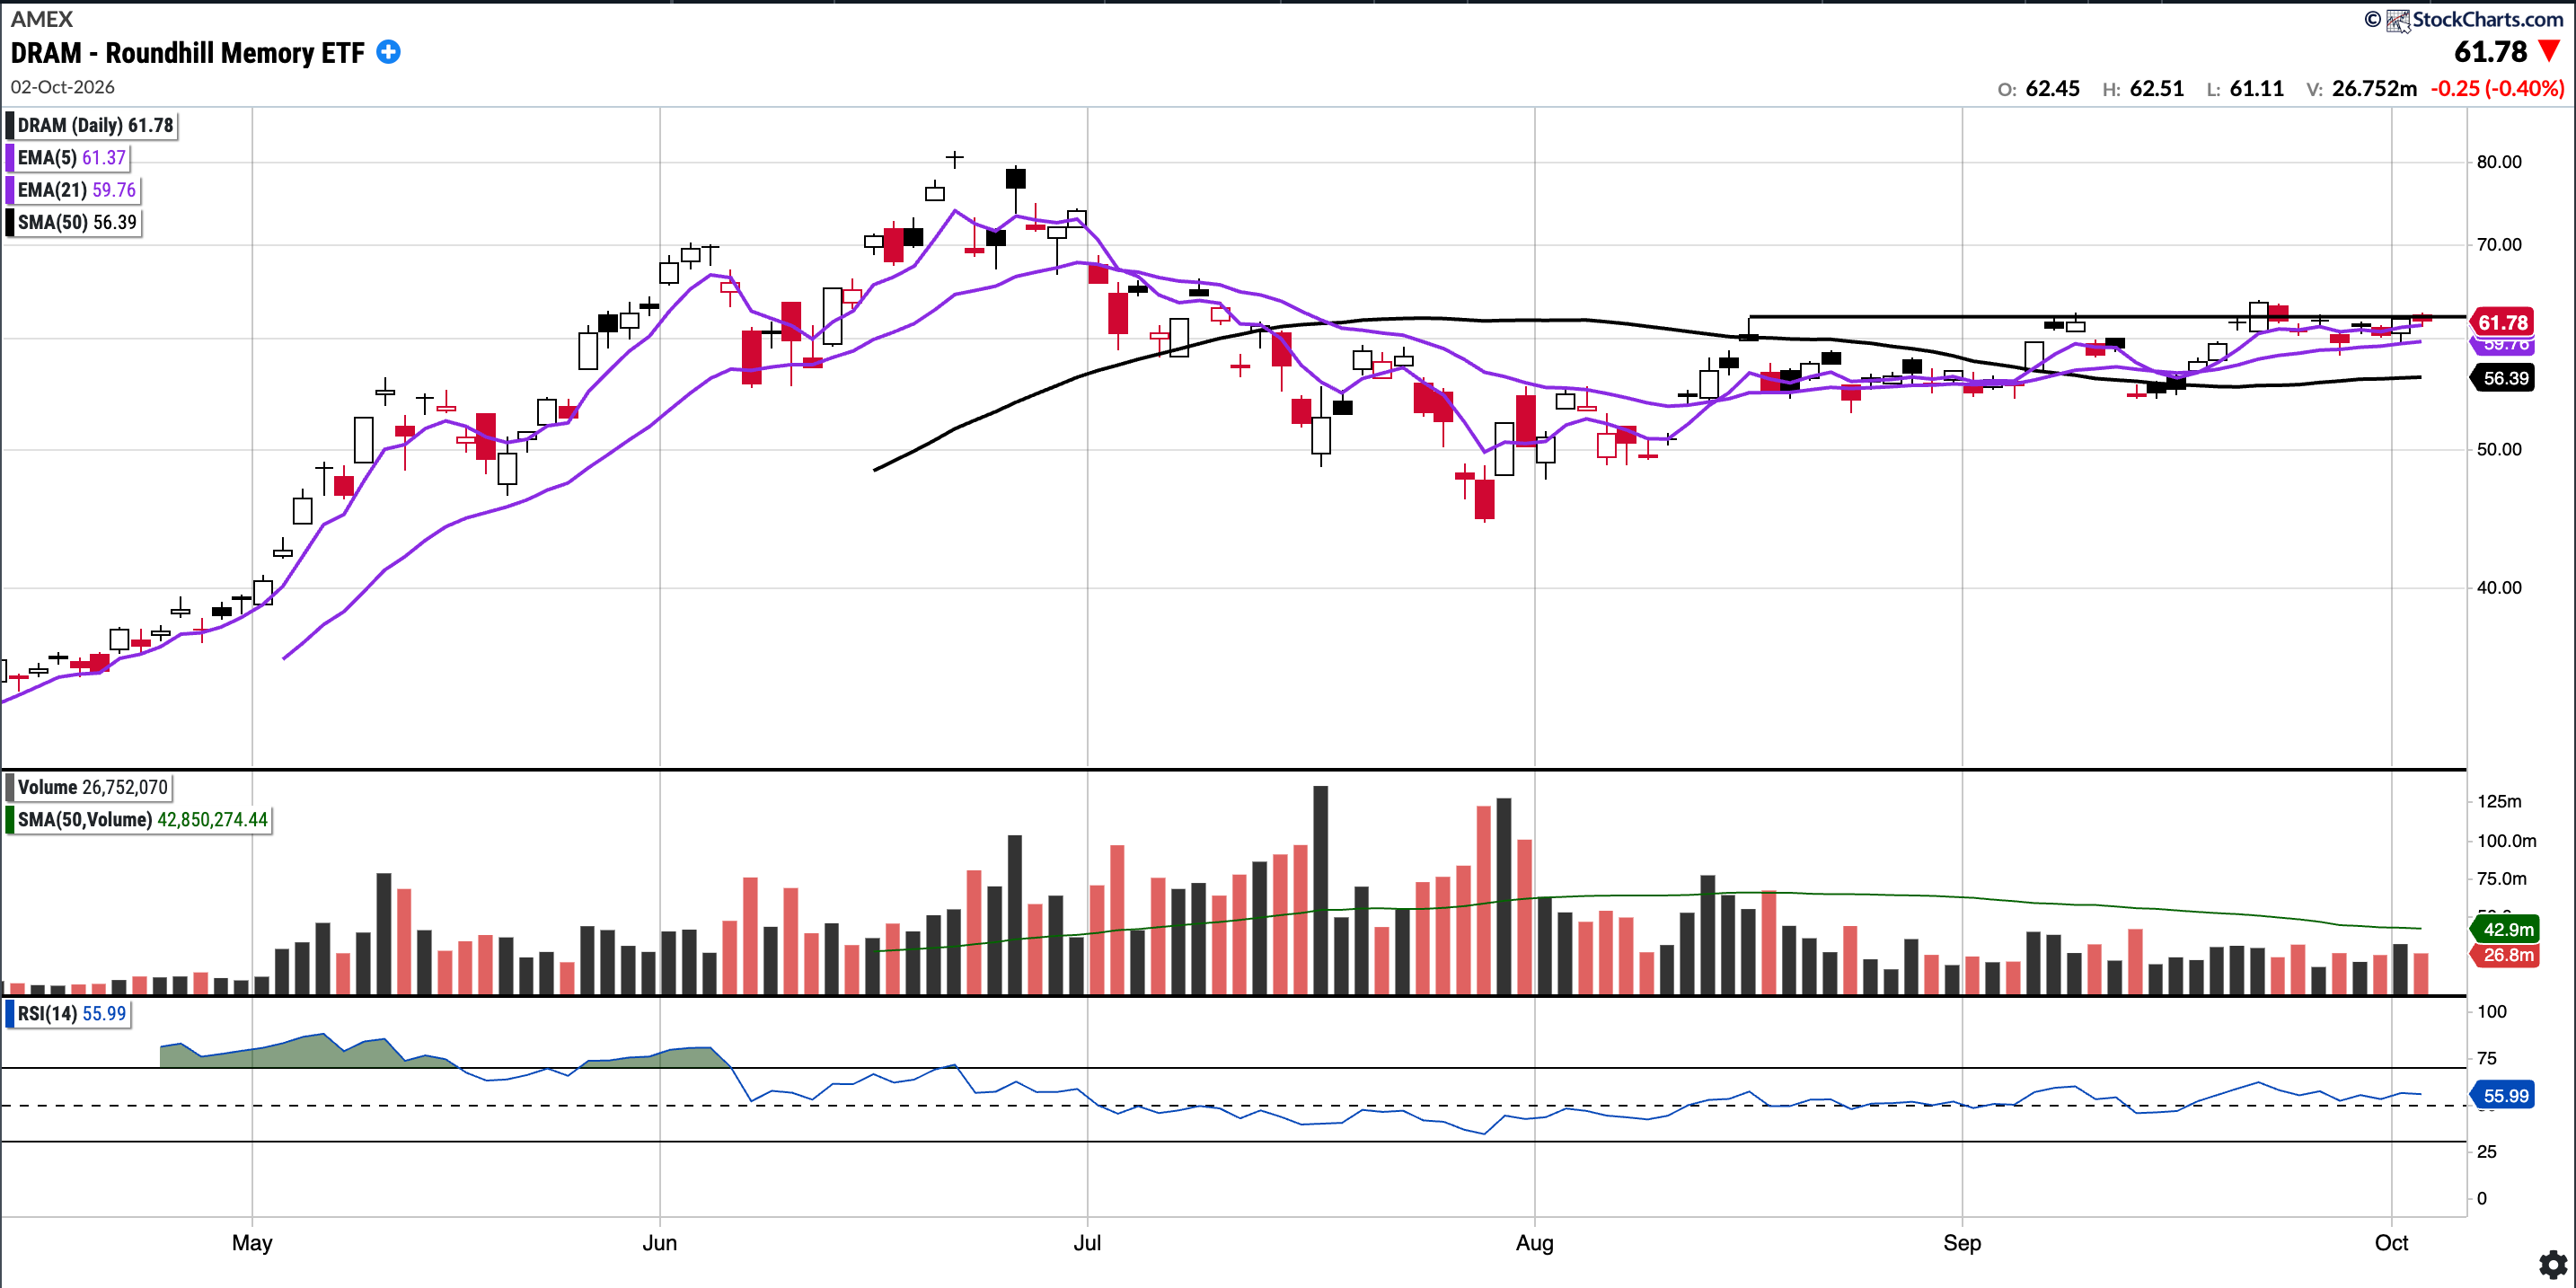
DRAM
Currently trades at $61.78, 9.56% above the 50SMA.
RSI 55.99
122.55% YTD
DRAM has repeatedly struggled to break above the $62 level since mid-July, and again most recently on Friday when it closed just beneath it at $61.78. However, DRAM has been holding the 21-EMA, which is encouraging. A decisive close above $62 would open the possibility of a rally toward the June highs.
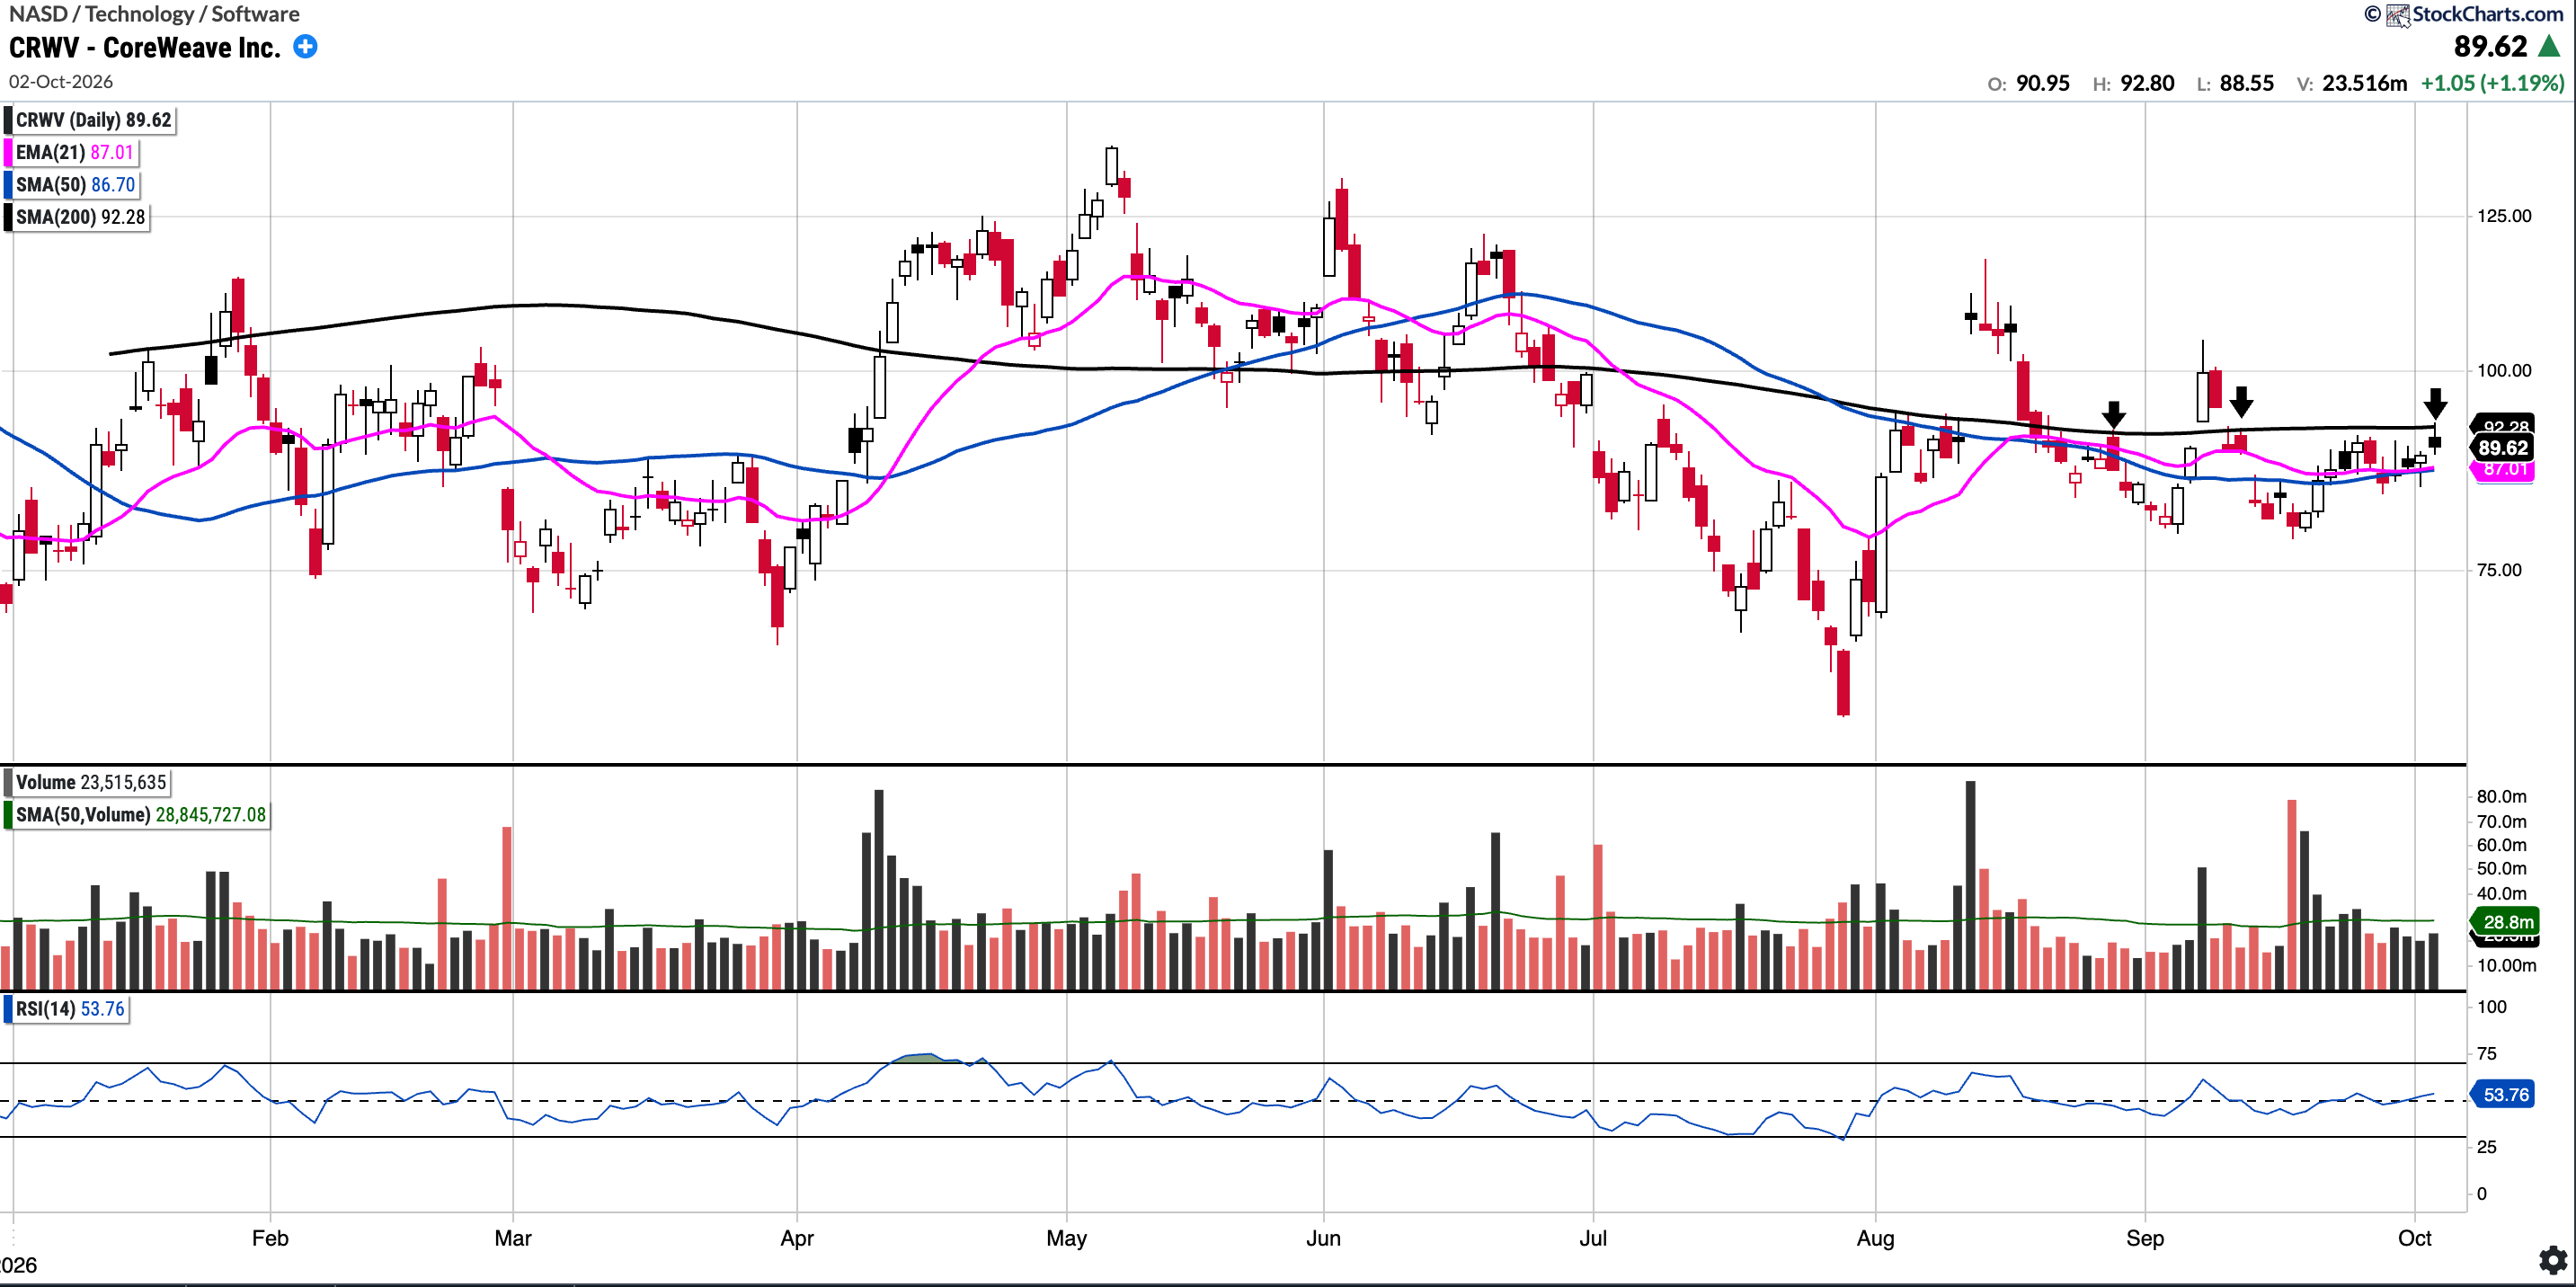
CRWV (Currently Long)
Currently trades at $89.62, 3.37% above the 50SMA and 2.88% below the 200SMA.
RSI 53.76
12.99% YTD
CRWV continues to see the 200-day SMA ($92.28) act as resistance, with attempts since August failing at the level (see downward arrows). This happened again on Friday when price touched $92.80 intraday before closing at $89.62. Price is holding above its 21EMA and the 50-day SMA ($86.70) which indicates supportive price action. A decisive close above the 200-day SMA would open the door to a rally to the $110-$115 level, as CRWV has done previously on breaks above the 200-SMA (see upward arrows).
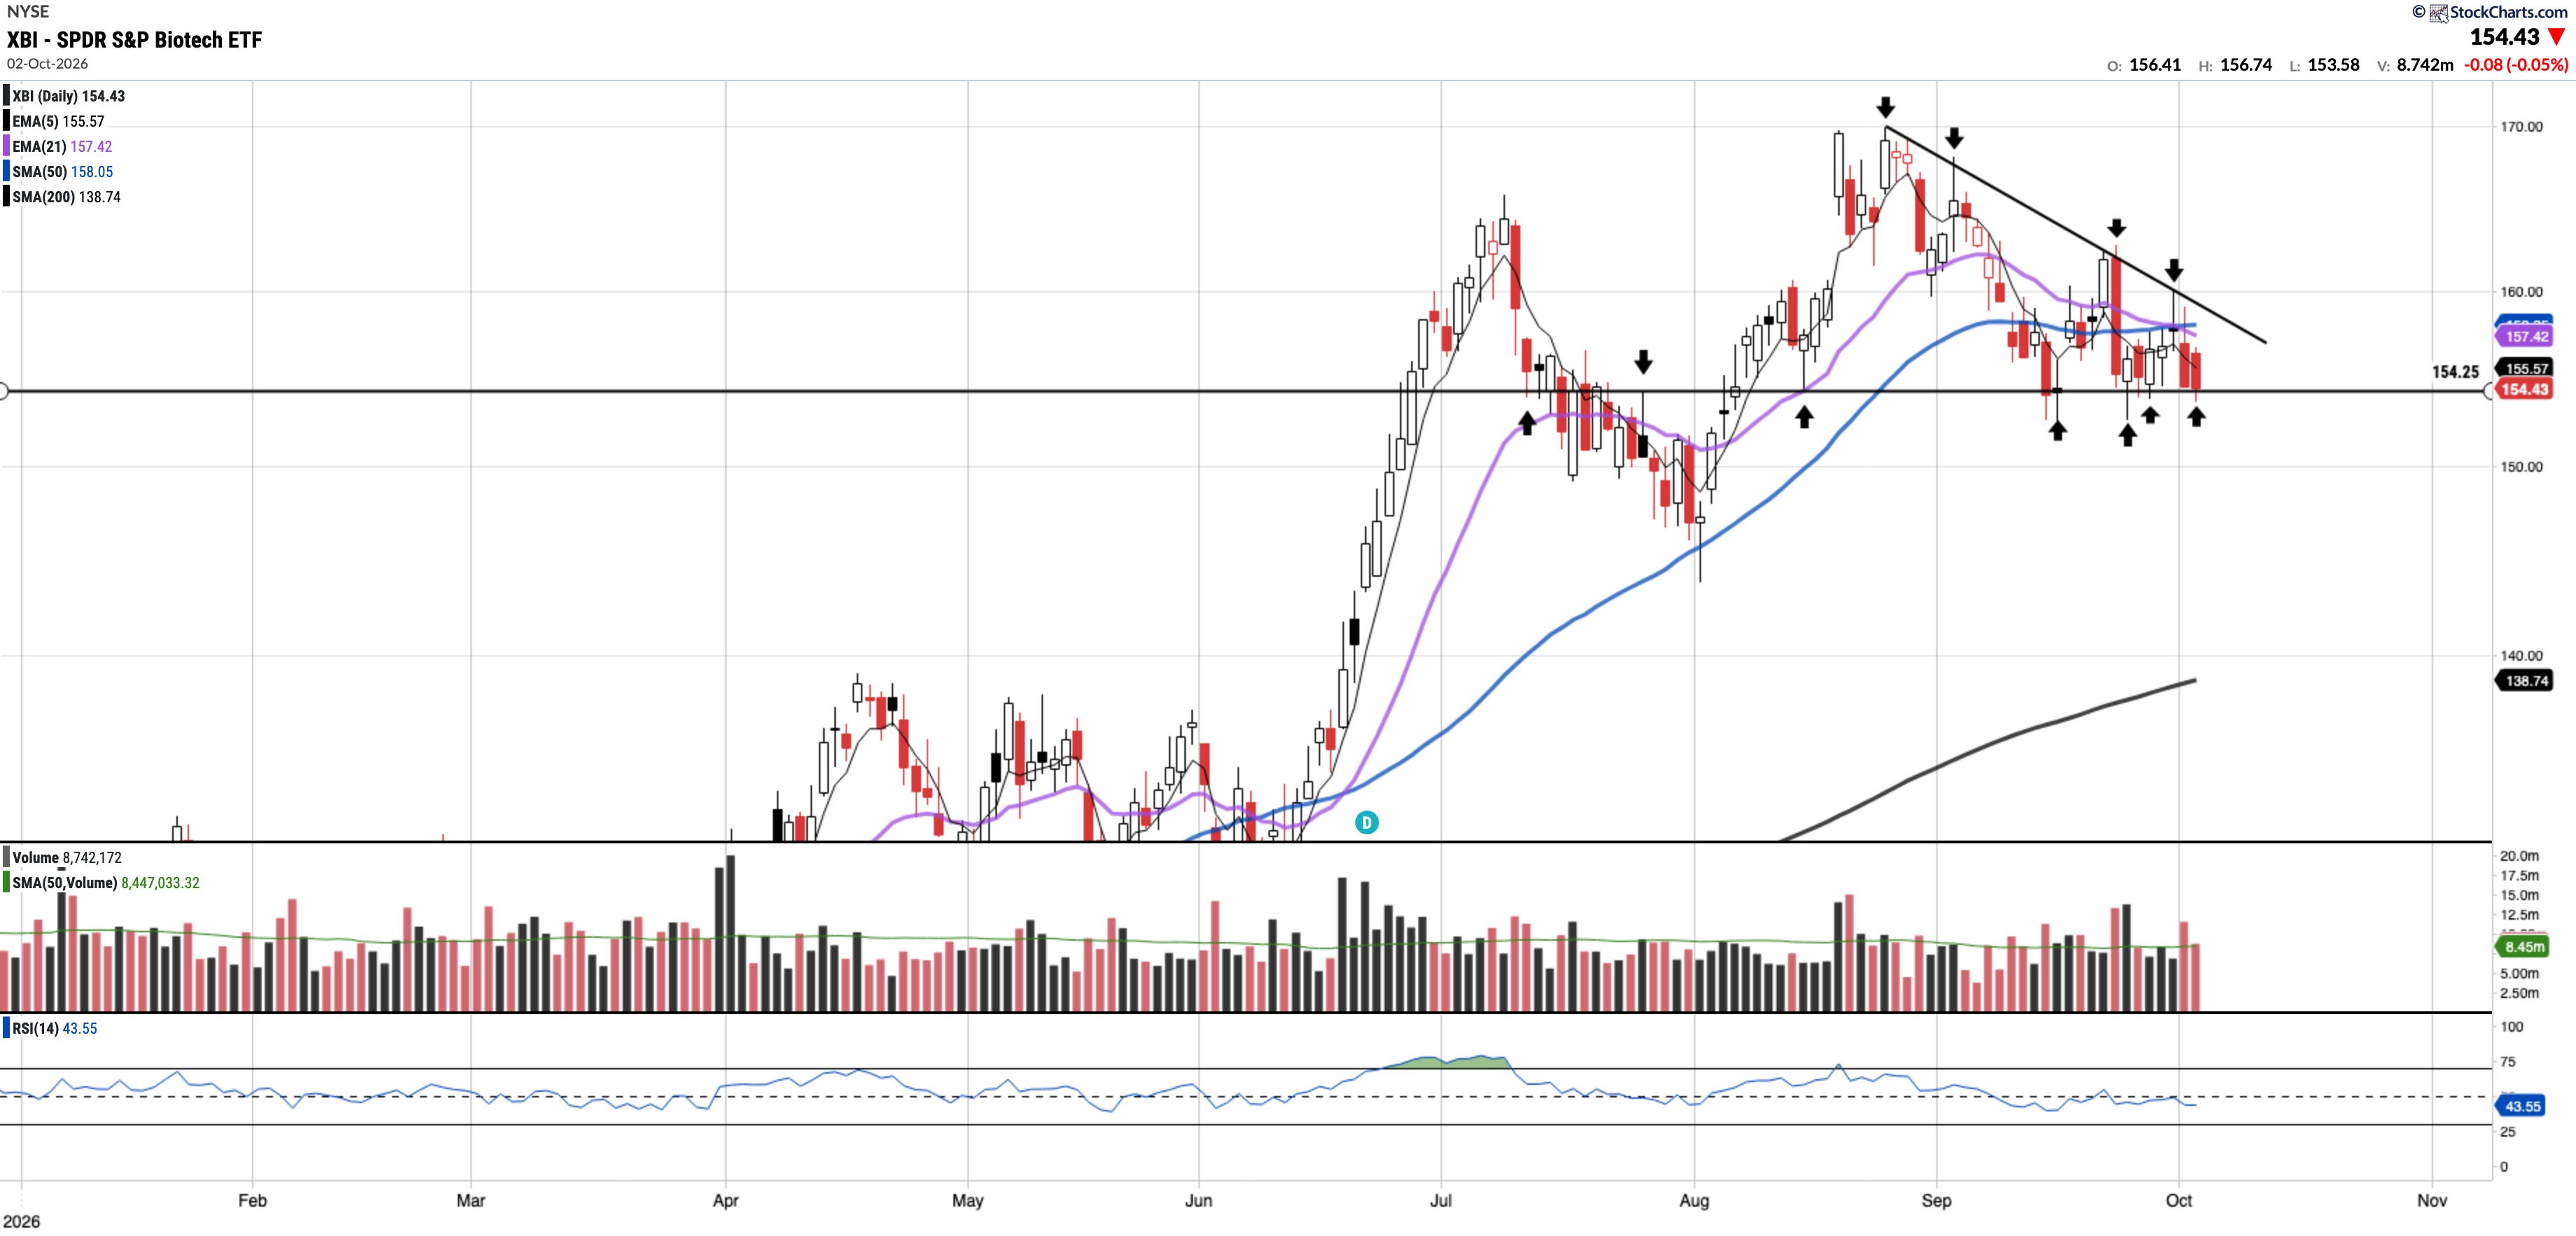
XBI
Currently trades at $154.43, 2.29% below the 50SMA and 11.31% above the 200SMA.
RSI 43.55
27.21% YTD
XBI continues to make lower highs along its descending trendline (see arrows), with another rejection near $160 on Wednesday. The support level at $154 has been tested repeatedly and held. Price closed the week right on that level, below its 5EMA, 21EMA and 50SMA, which are now stacked just above it. Bulls need to reclaim those moving averages and break the trendline to restore the uptrend, while a loss of $154 would risk a breakdown.
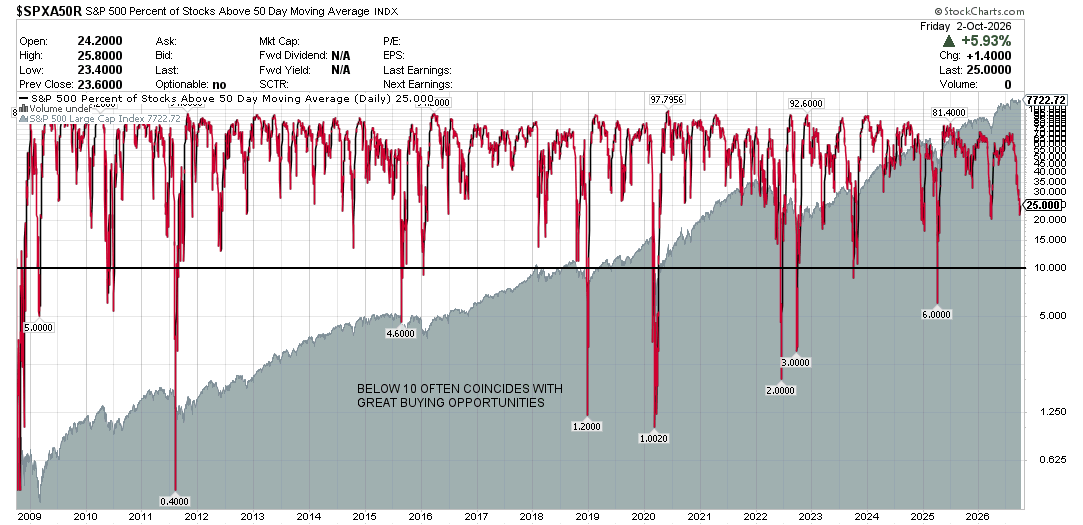
S&P 500 Percentage of Stocks Above the 50 Day Moving Average: Currently 25.00%
Breadth decreased slightly this week, with the percentage of stocks above the 50-day moving average now at 25.00% compared to 27.60% last week.
Notable portfolio changes in previous week (all updated live in subscriber channels):