
Hope you all are having a good weekend. Below, we will be previewing the upcoming week’s events and providing a portfolio update as usual.
Format for what is covered in this weekly preview:
A Look at the Indices
Key Upcoming Economic Events
Upcoming Earnings
Charts
Current Portfolio Holdings
Sizing | Cost Basis | Timeframe | Planned Moves
Closing Thoughts (Scroll to here for my Market Commentary)
I recommend checking out the most recent in-depth Monthly Portfolio and Performance Update below (the new post will also be published within the next day).

For all readers a reminder that a premium subscription includes:
Live Portfolio updates (All Buys and Sells) in Subscriber only Channels
Favourite set-up Ideas, Market Memos plus Full archive
Monthly in depth portfolio & performance updates
Annual Tier: Discord access for live trading account updates and AMAs.
Indices
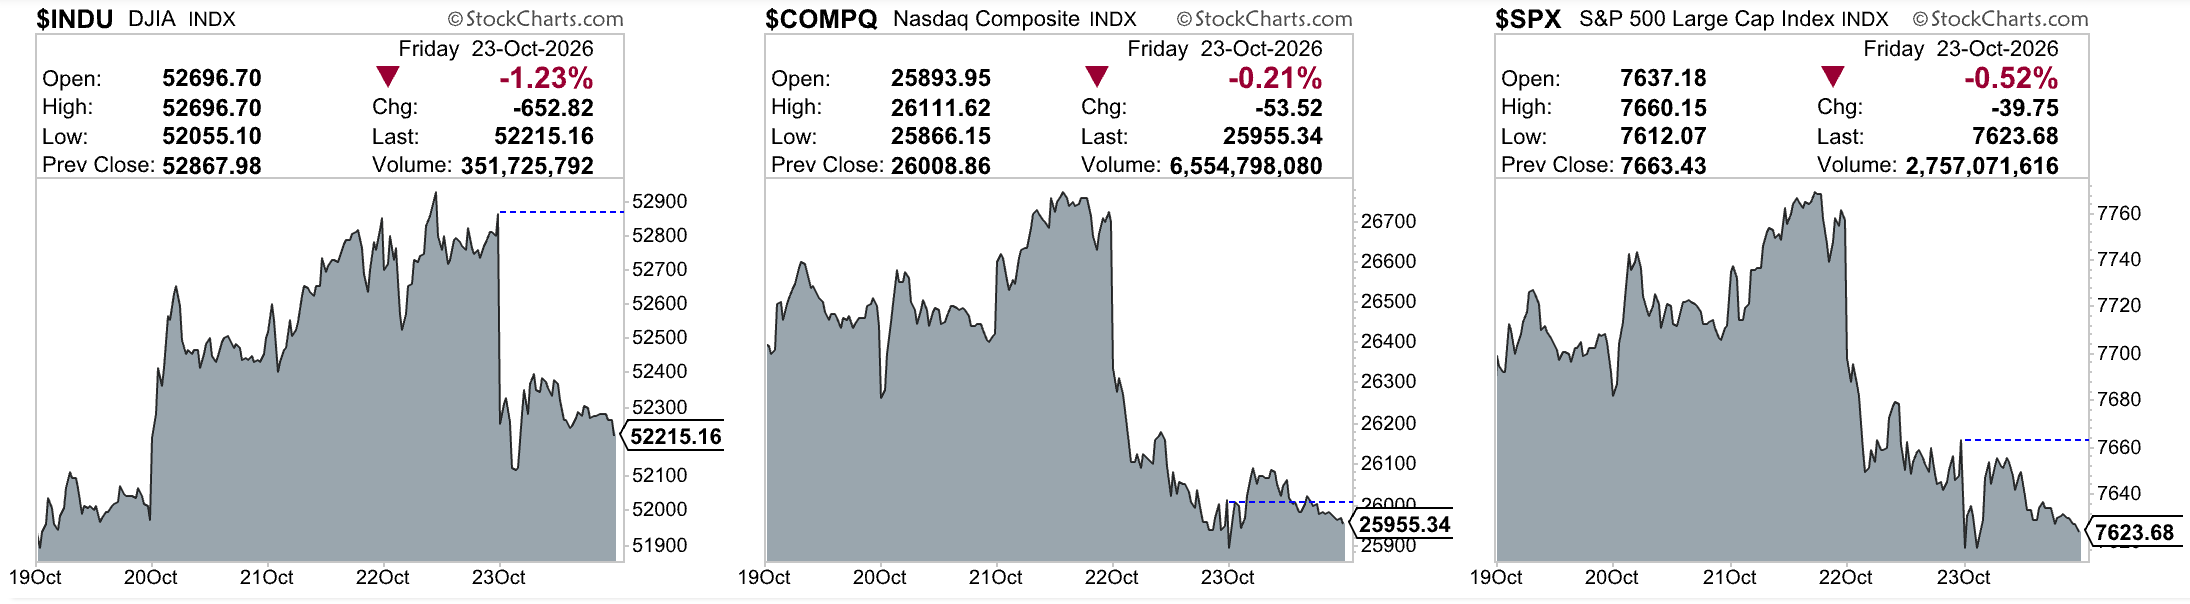
Dow Jones Industrial Average advanced +0.41% in the last week
S&P 500 declined -0.47% in the last week
Nasdaq Composite declined -0.71% in the last week
IWM advanced +1.96% in the last week
Key upcoming economic events
Monday, October 26
Chicago Fed National Activity Index (September)
Dallas Fed Manufacturing Survey (October)
Tuesday, October 27
FOMC meeting begins (two-day meeting)
Durable Goods Orders, advance (September)
New Home Sales (September)
Case-Shiller and FHFA Home Price Indexes (August)
Conference Board Consumer Confidence (October)
Wednesday, October 28
FOMC interest rate decision, followed by press conference
MBA Mortgage Applications
Advance Goods Trade Balance and Retail and Wholesale Inventories (September)
BLS Metropolitan Area Employment and Unemployment (September)
Housing Vacancies and Homeownership (Q3)
BLS Business Employment Dynamics (Q1)
Thursday, October 29
GDP, advance estimate (Q3)
Personal Income and Outlays, including PCE Price Index (September)
Initial and Continuing Jobless Claims
Fed H.4.1 balance sheet release
Friday, October 30
Employment Cost Index (Q3)
Chicago PMI (October)
Upcoming Earnings
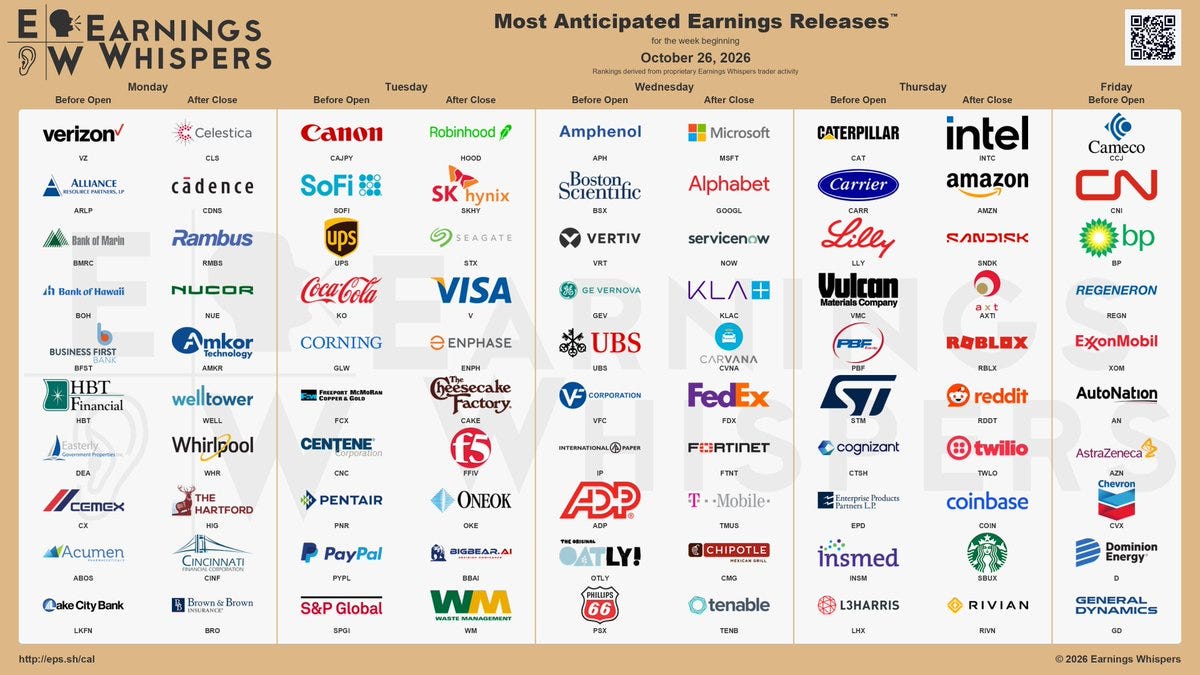
Below is the infographic by Earnings Whispers highlighting the schedule for this week:
Charts
SPX
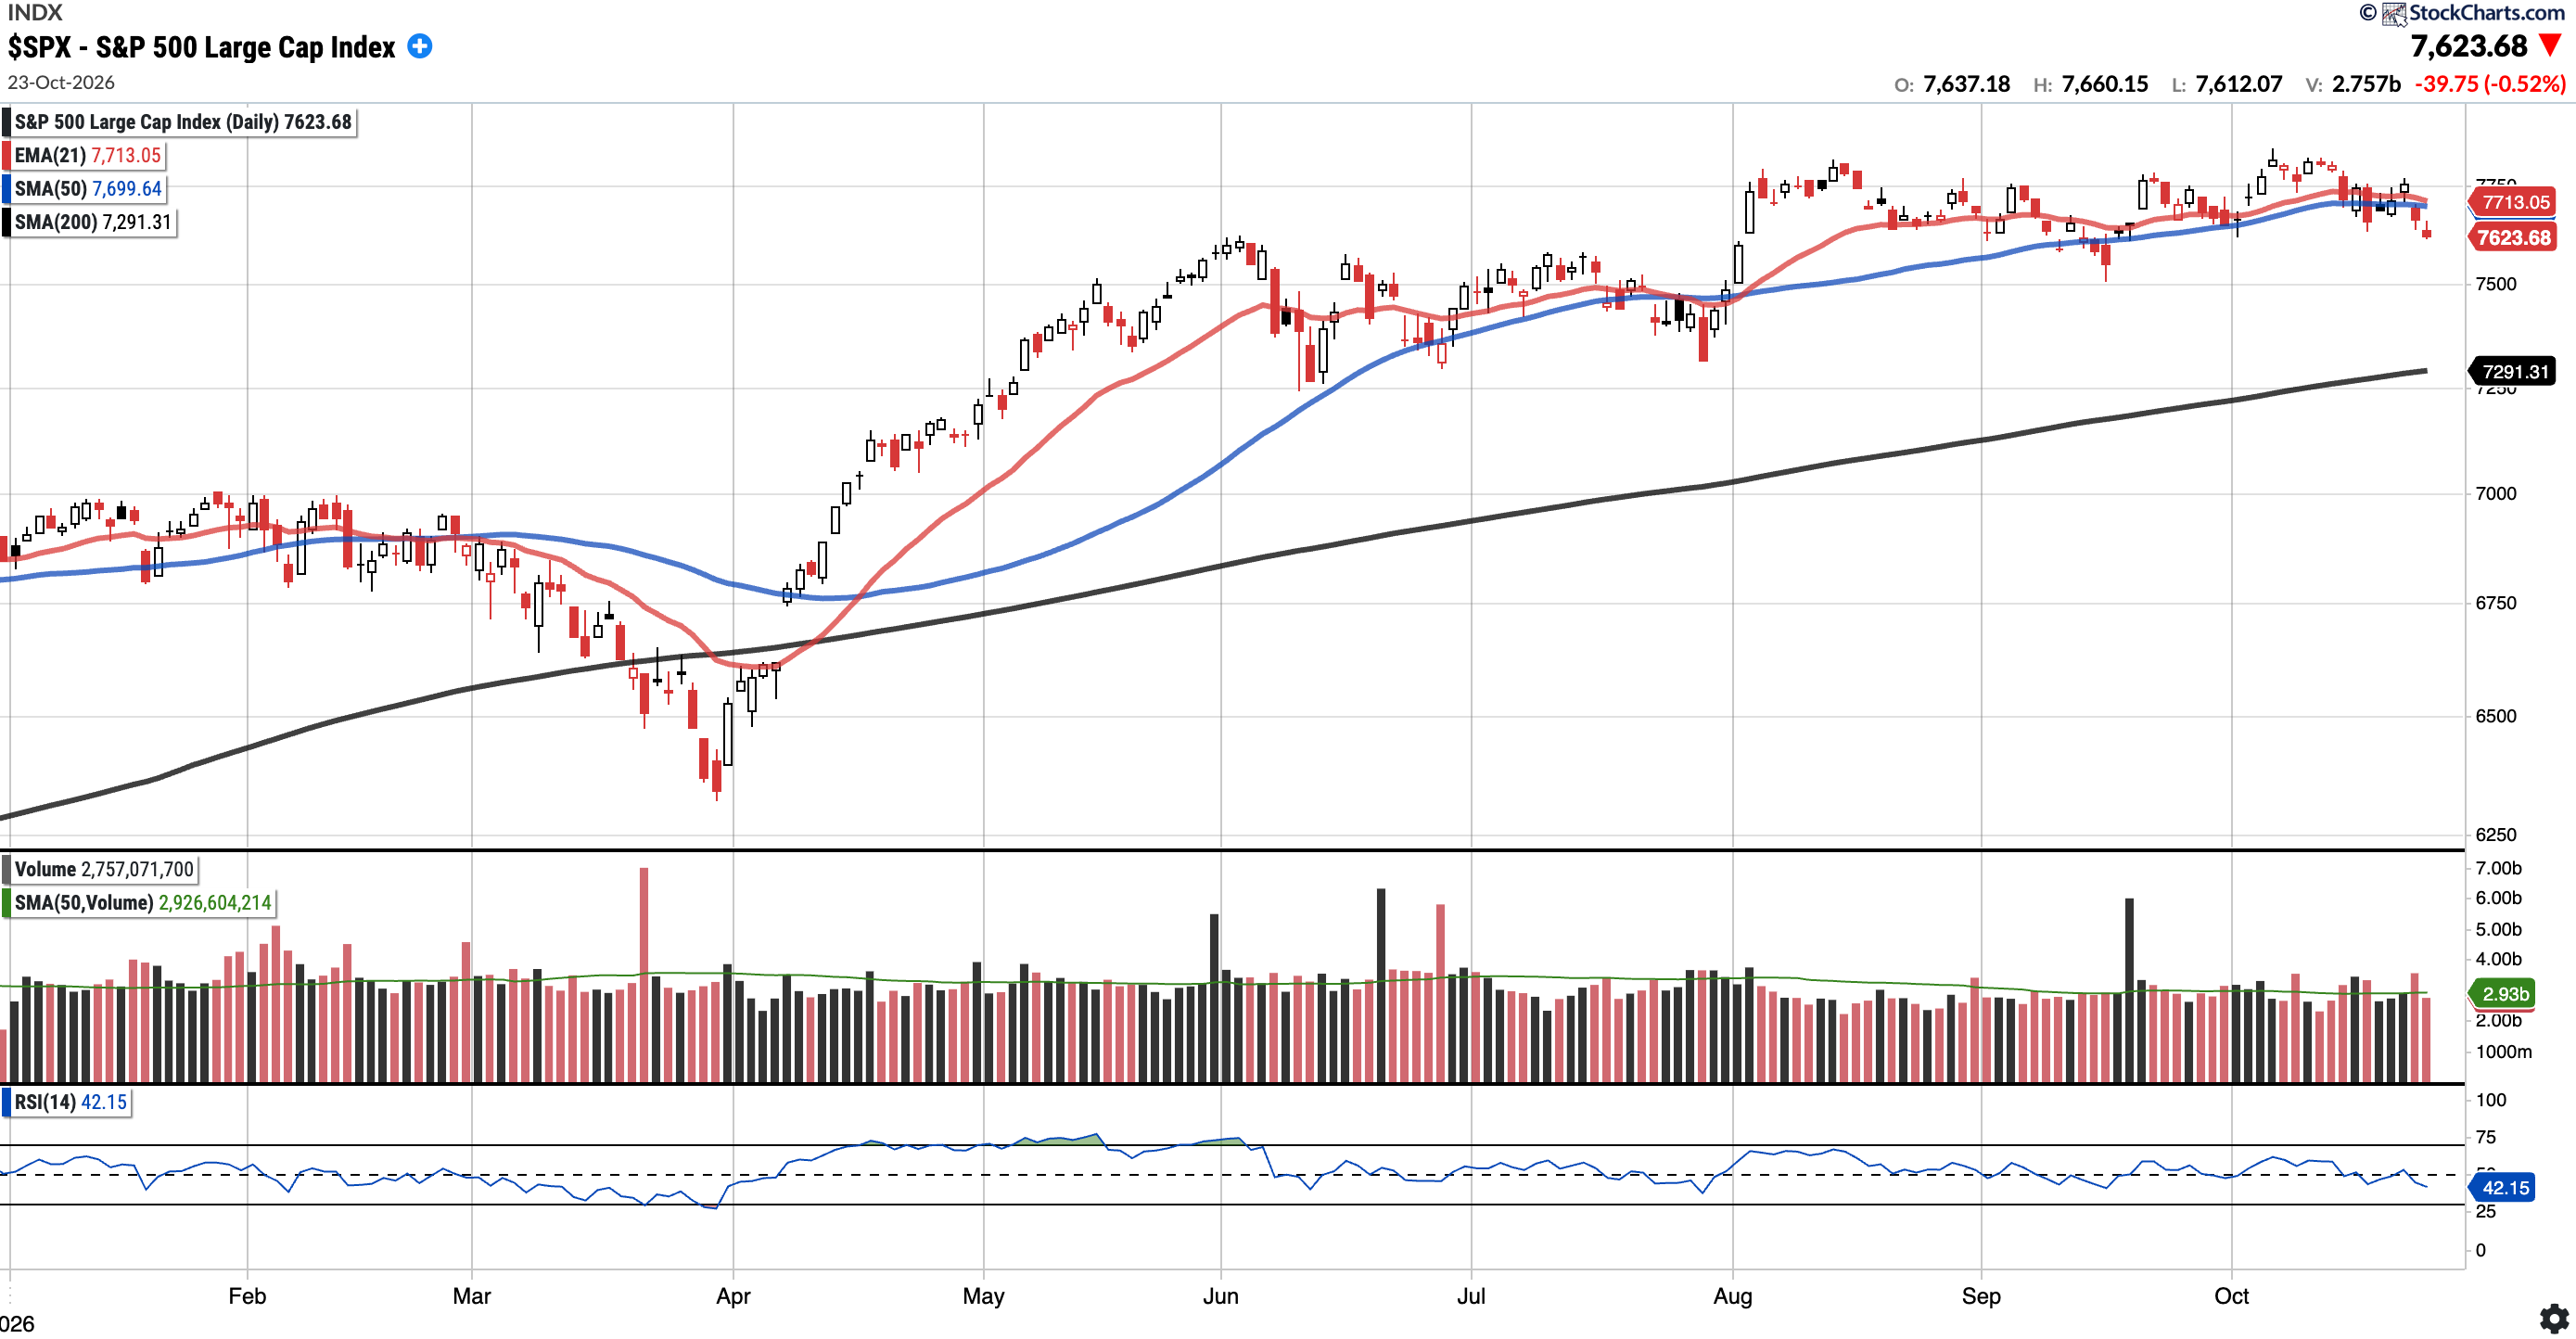
Currently trades at $7,623.68, 0.99% below the 50SMA and 4.56% above the 200SMA.
RSI 42.15
11.16% YTD
Distribution days in the last week: 1
The S&P 500 closed the week below both the 21-day EMA ($7,713.05) and the 50-day SMA ($7,699.64). Bulls will want to see those levels reclaimed soon. To the downside, the 200-day SMA ($7,291.31) is the next major support and coincides with the late July lows.
COMPQ
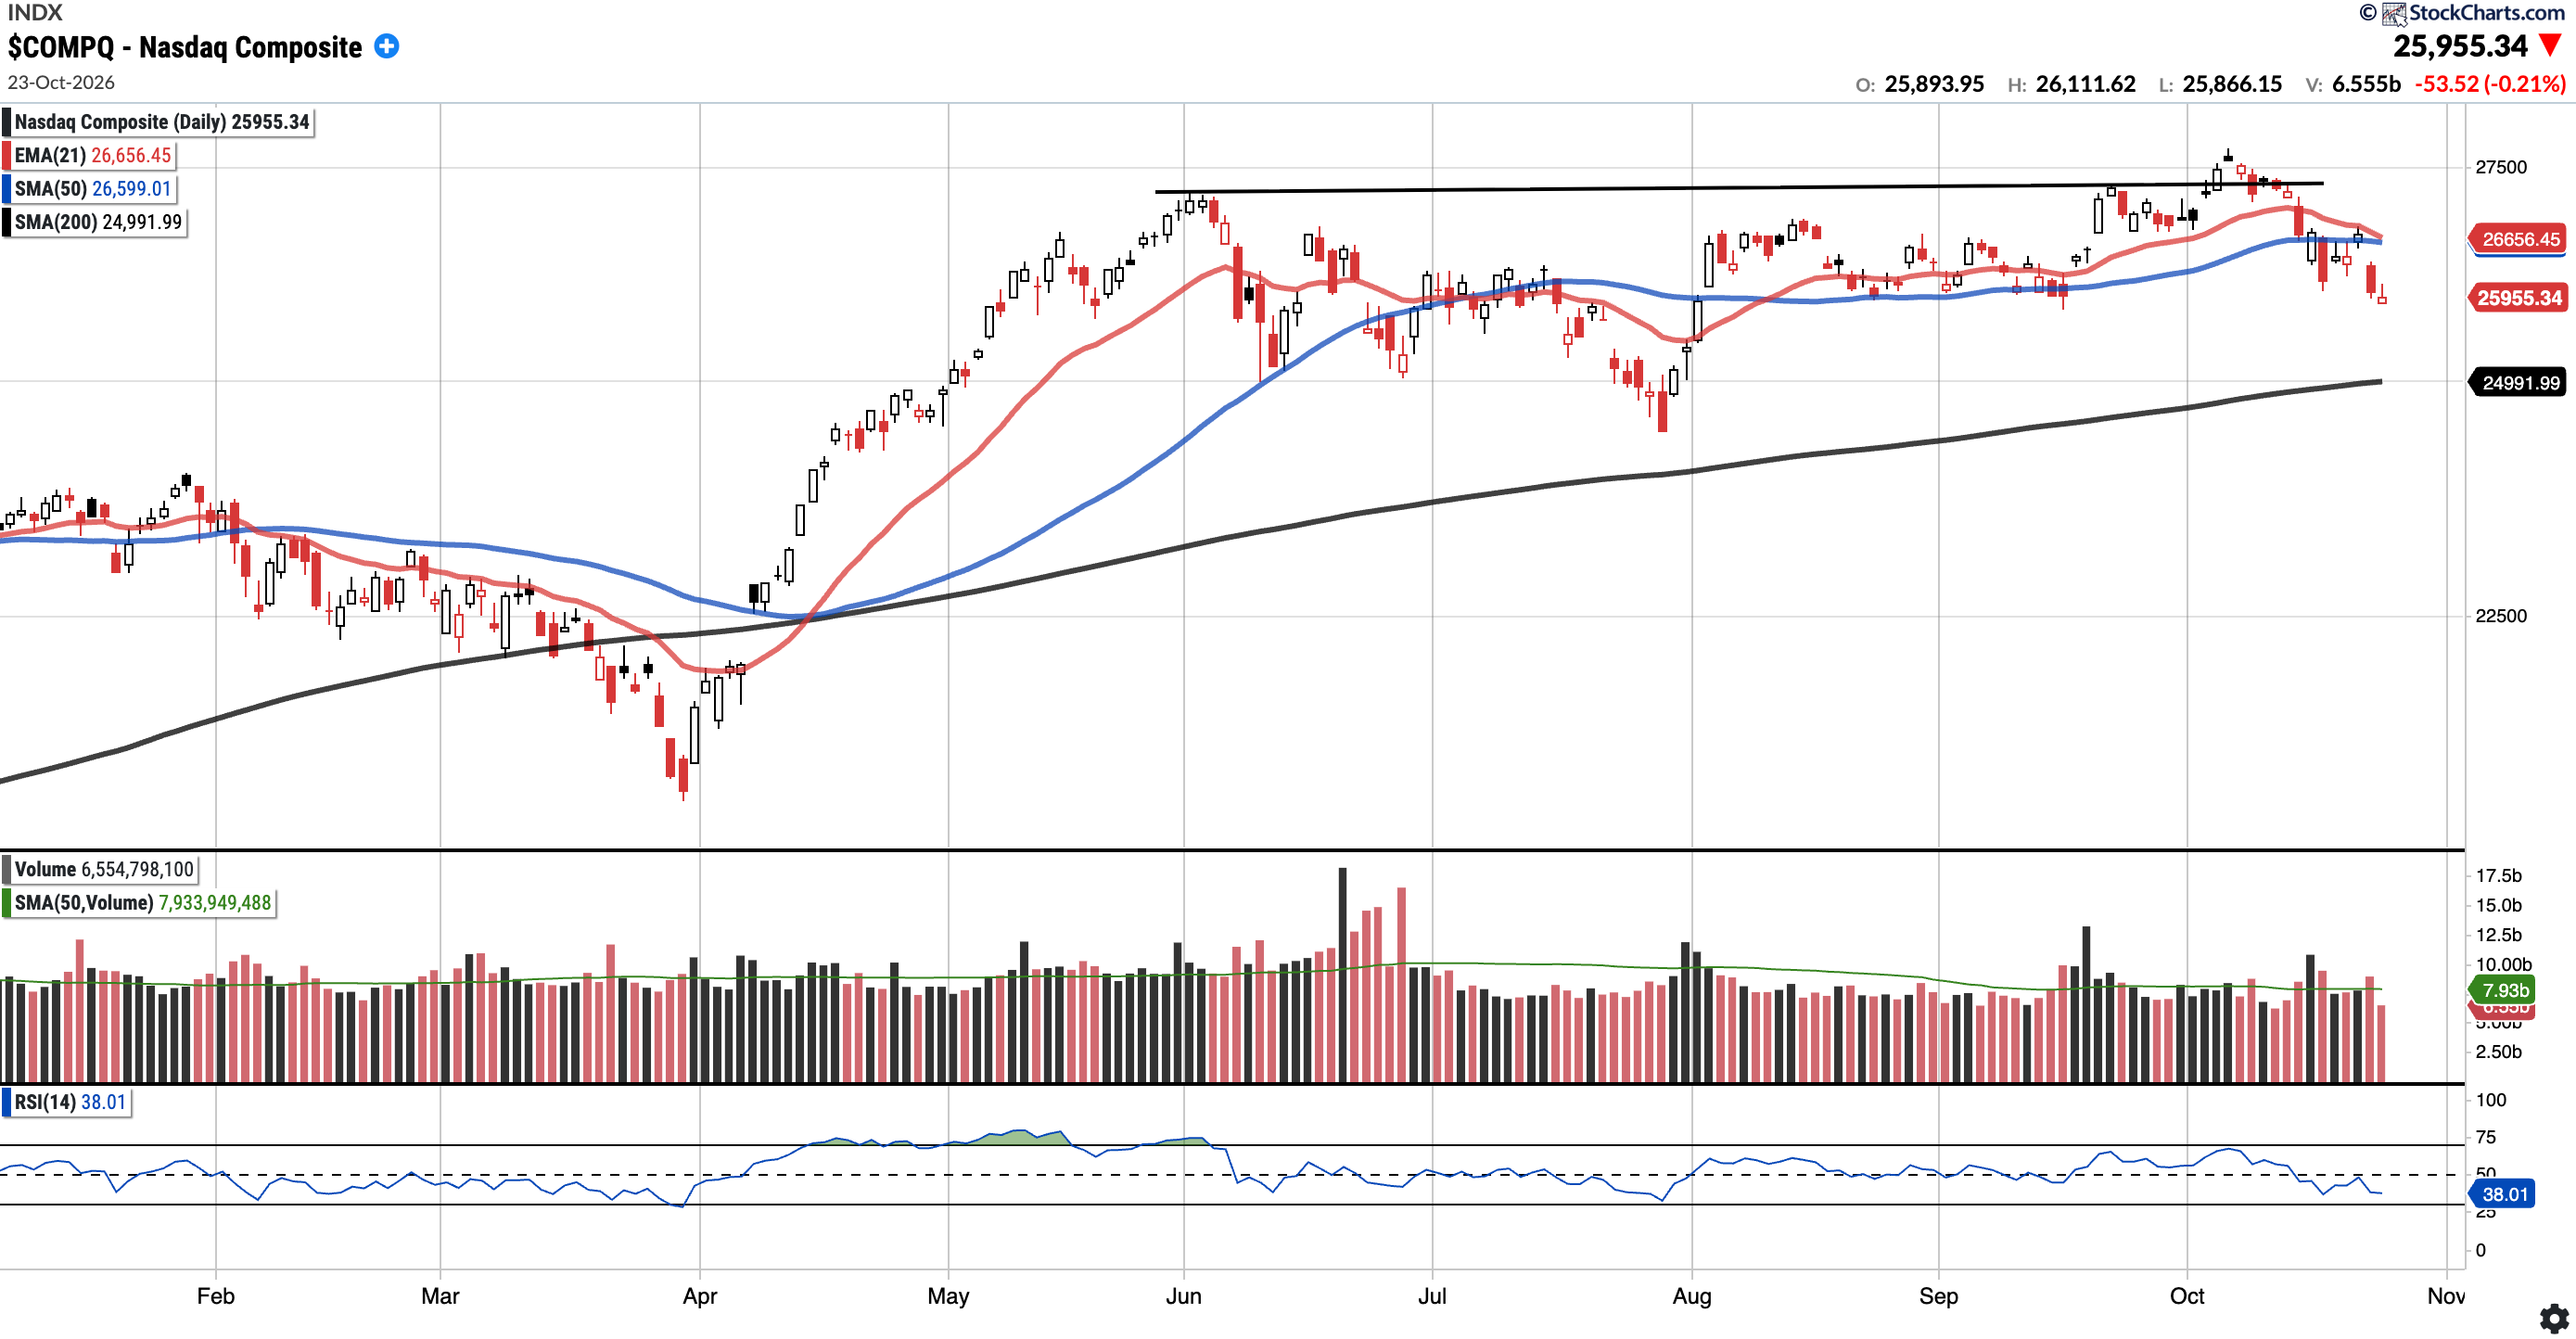
Currently trades at $25,955.34, 2.42% below the 50SMA and 3.85% above the 200SMA.
RSI 38.01
11.70% YTD
Distribution days in the last week: 1
Nasdaq Composite closed the week below both the 21-day EMA ($26,656.45) and the 50-day SMA ($26,599.01). Bulls will want to see the 50-day reclaimed sooner rather than later, whereas to the downside, the 200-day ($24,991.99) is the next major moving average support.
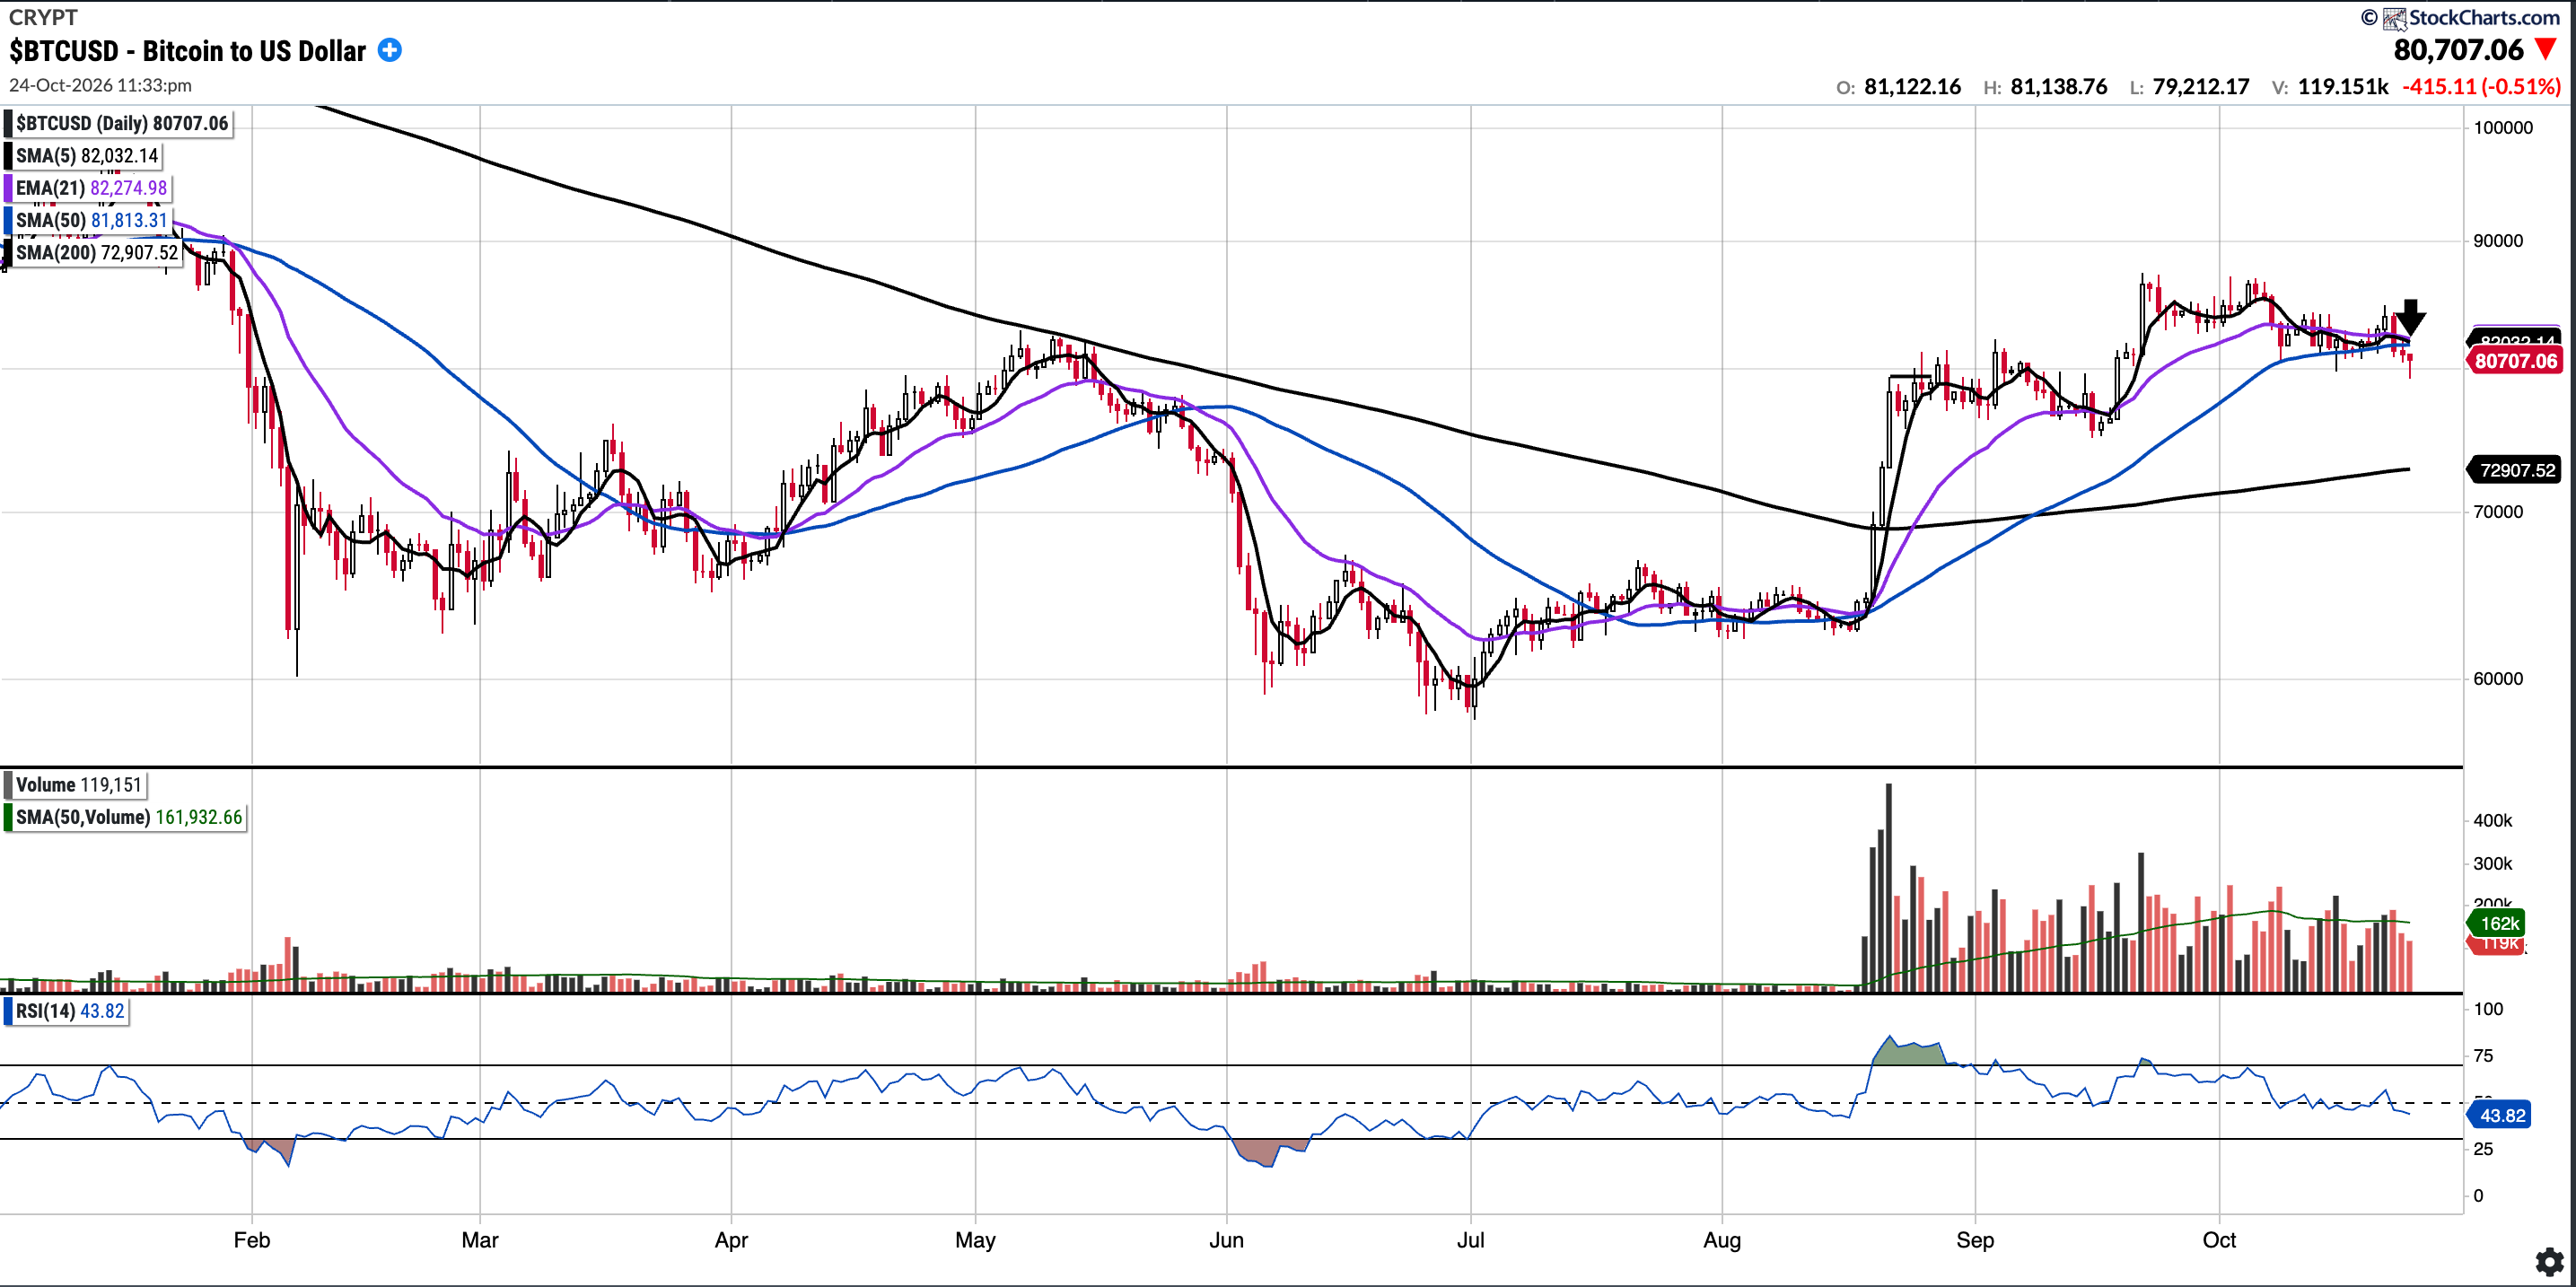
BTC (currently Long)
Currently trades at $80,707, 1.35% below the 50SMA and 10.7% above the 200SMA.
RSI 44.04
-9% YTD
As of Sunday October 24 at 00:34AM BST, BTC is trading at $80,707. It has broken below the confluence of MA’s at the 82k mark (See arrow). Bulls will want to see the 50SMA and $83K reclaimed. The $80K support level is in focus, with the 200SMA (~$72.9K) further below.
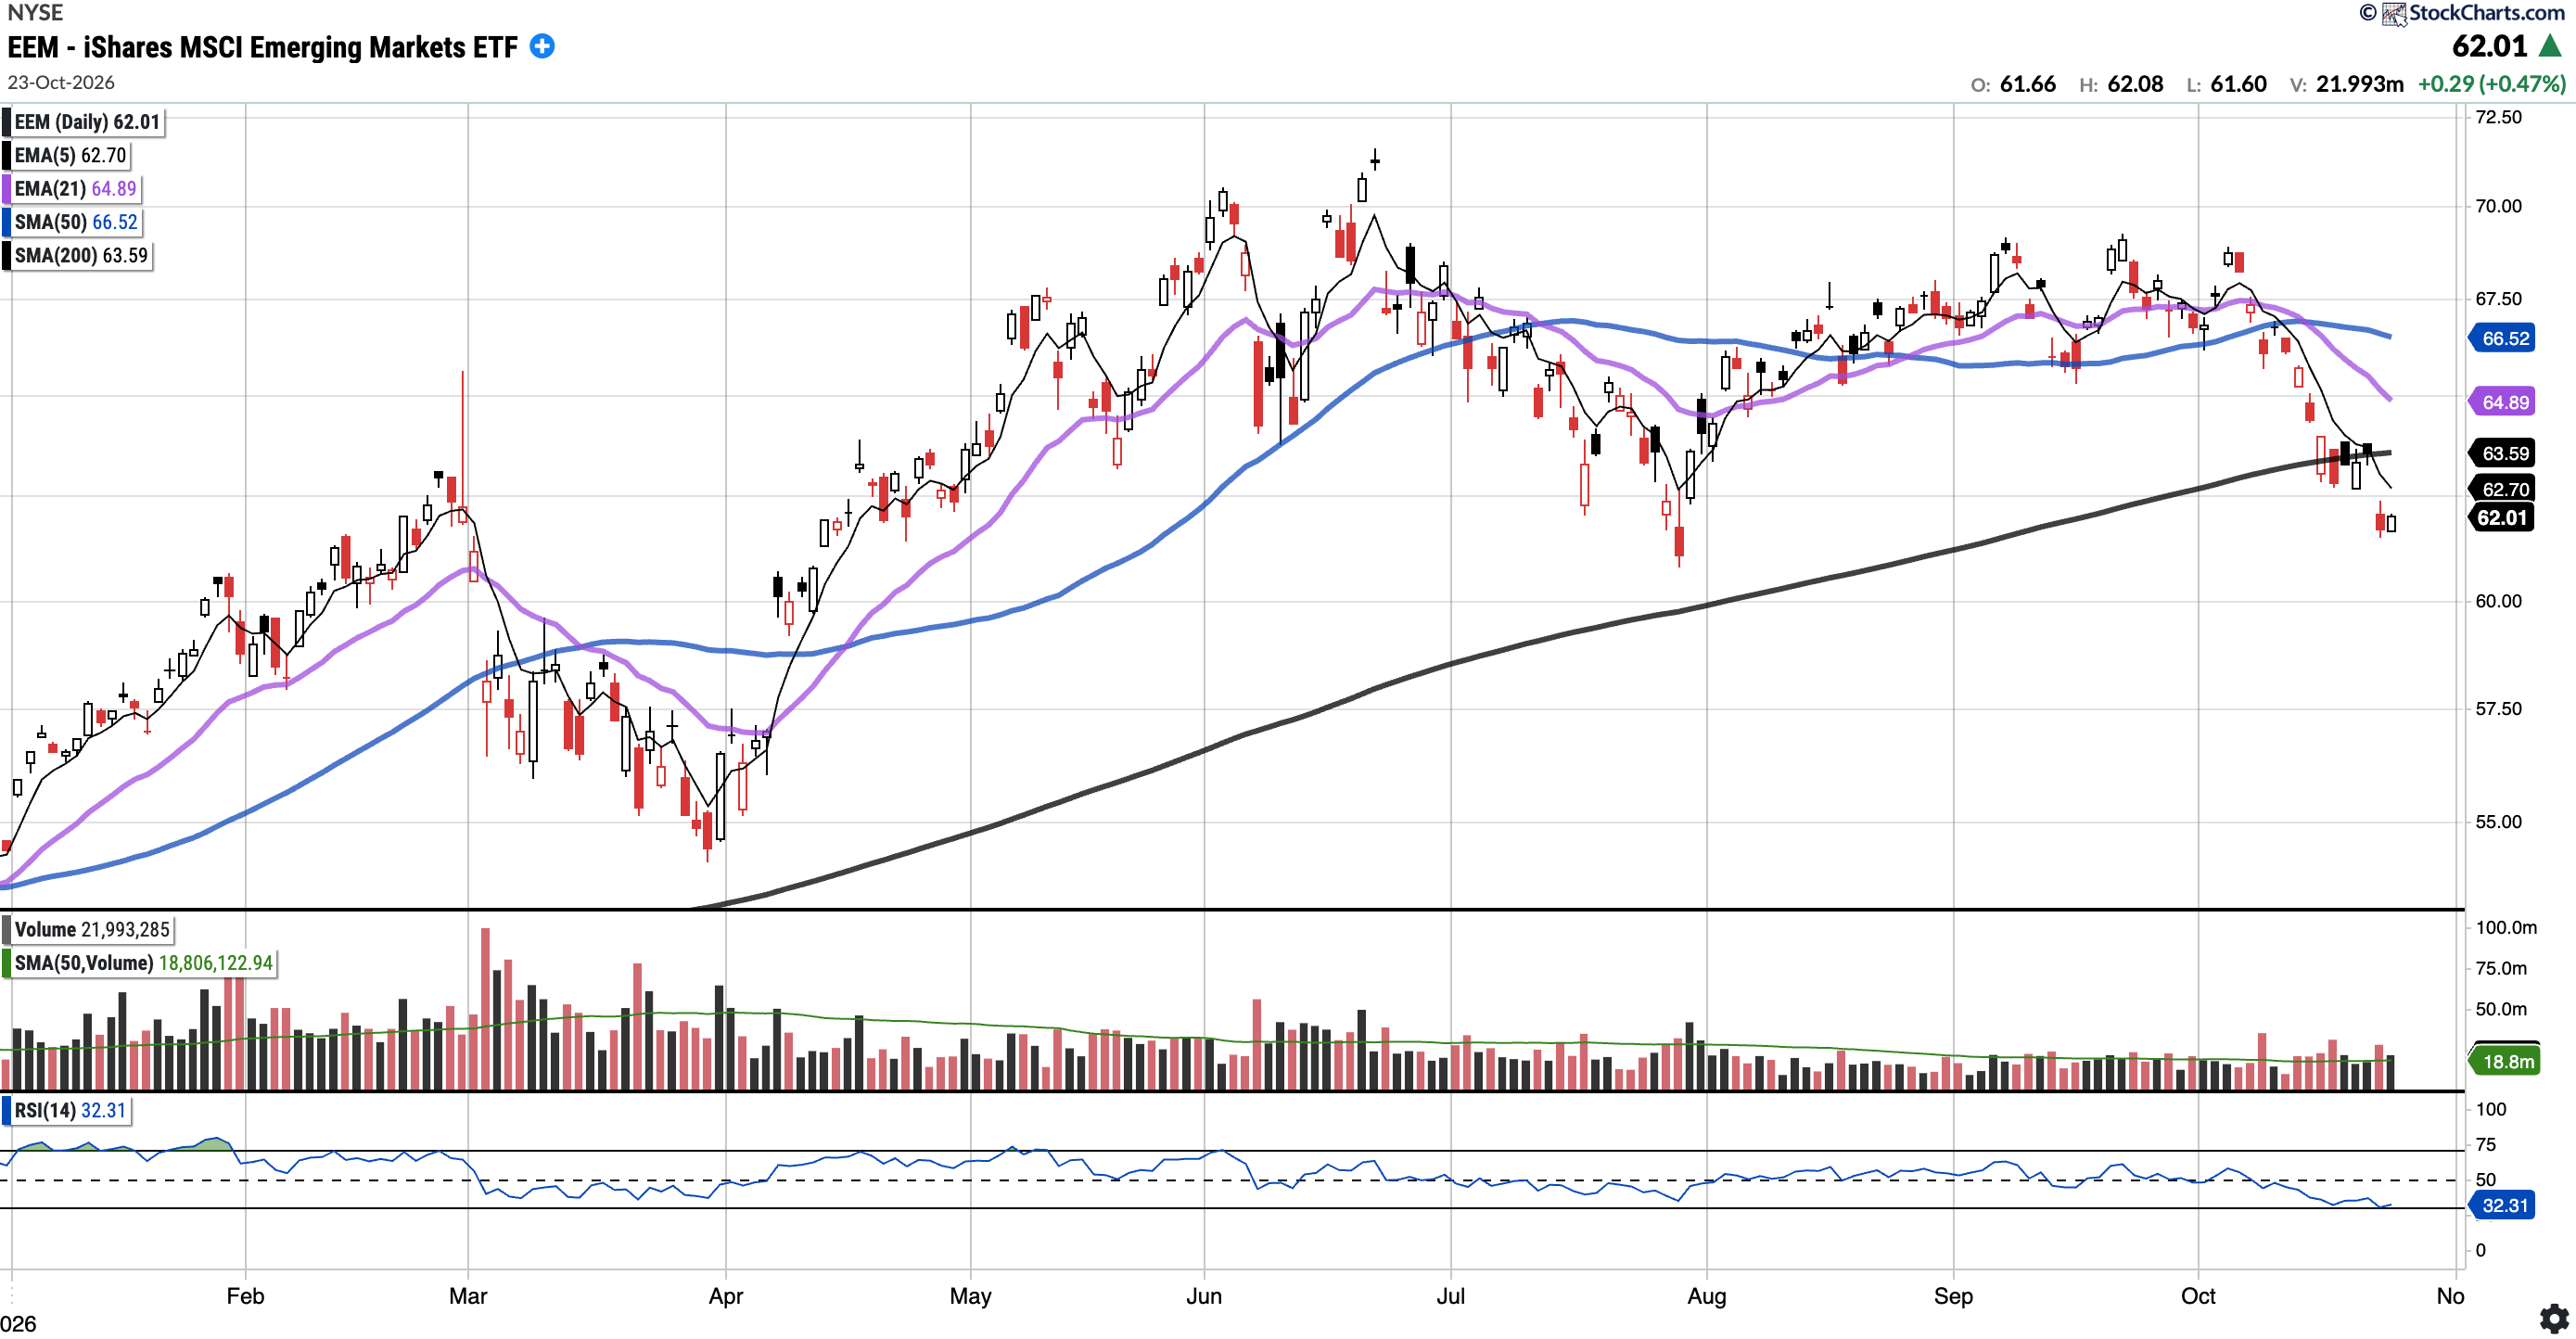
EEM
Currently trades at $62.01, 6.78% below the 50SMA and 2.48% below the 200SMA.
RSI 32.31
10.83% YTD
EEM closed the week below all of its key moving averages, with the 21EMA ($64.89) below the 50SMA ($66.52) indicating a bearish cross. Bulls will want to see the 200-day reclaimed as a start.
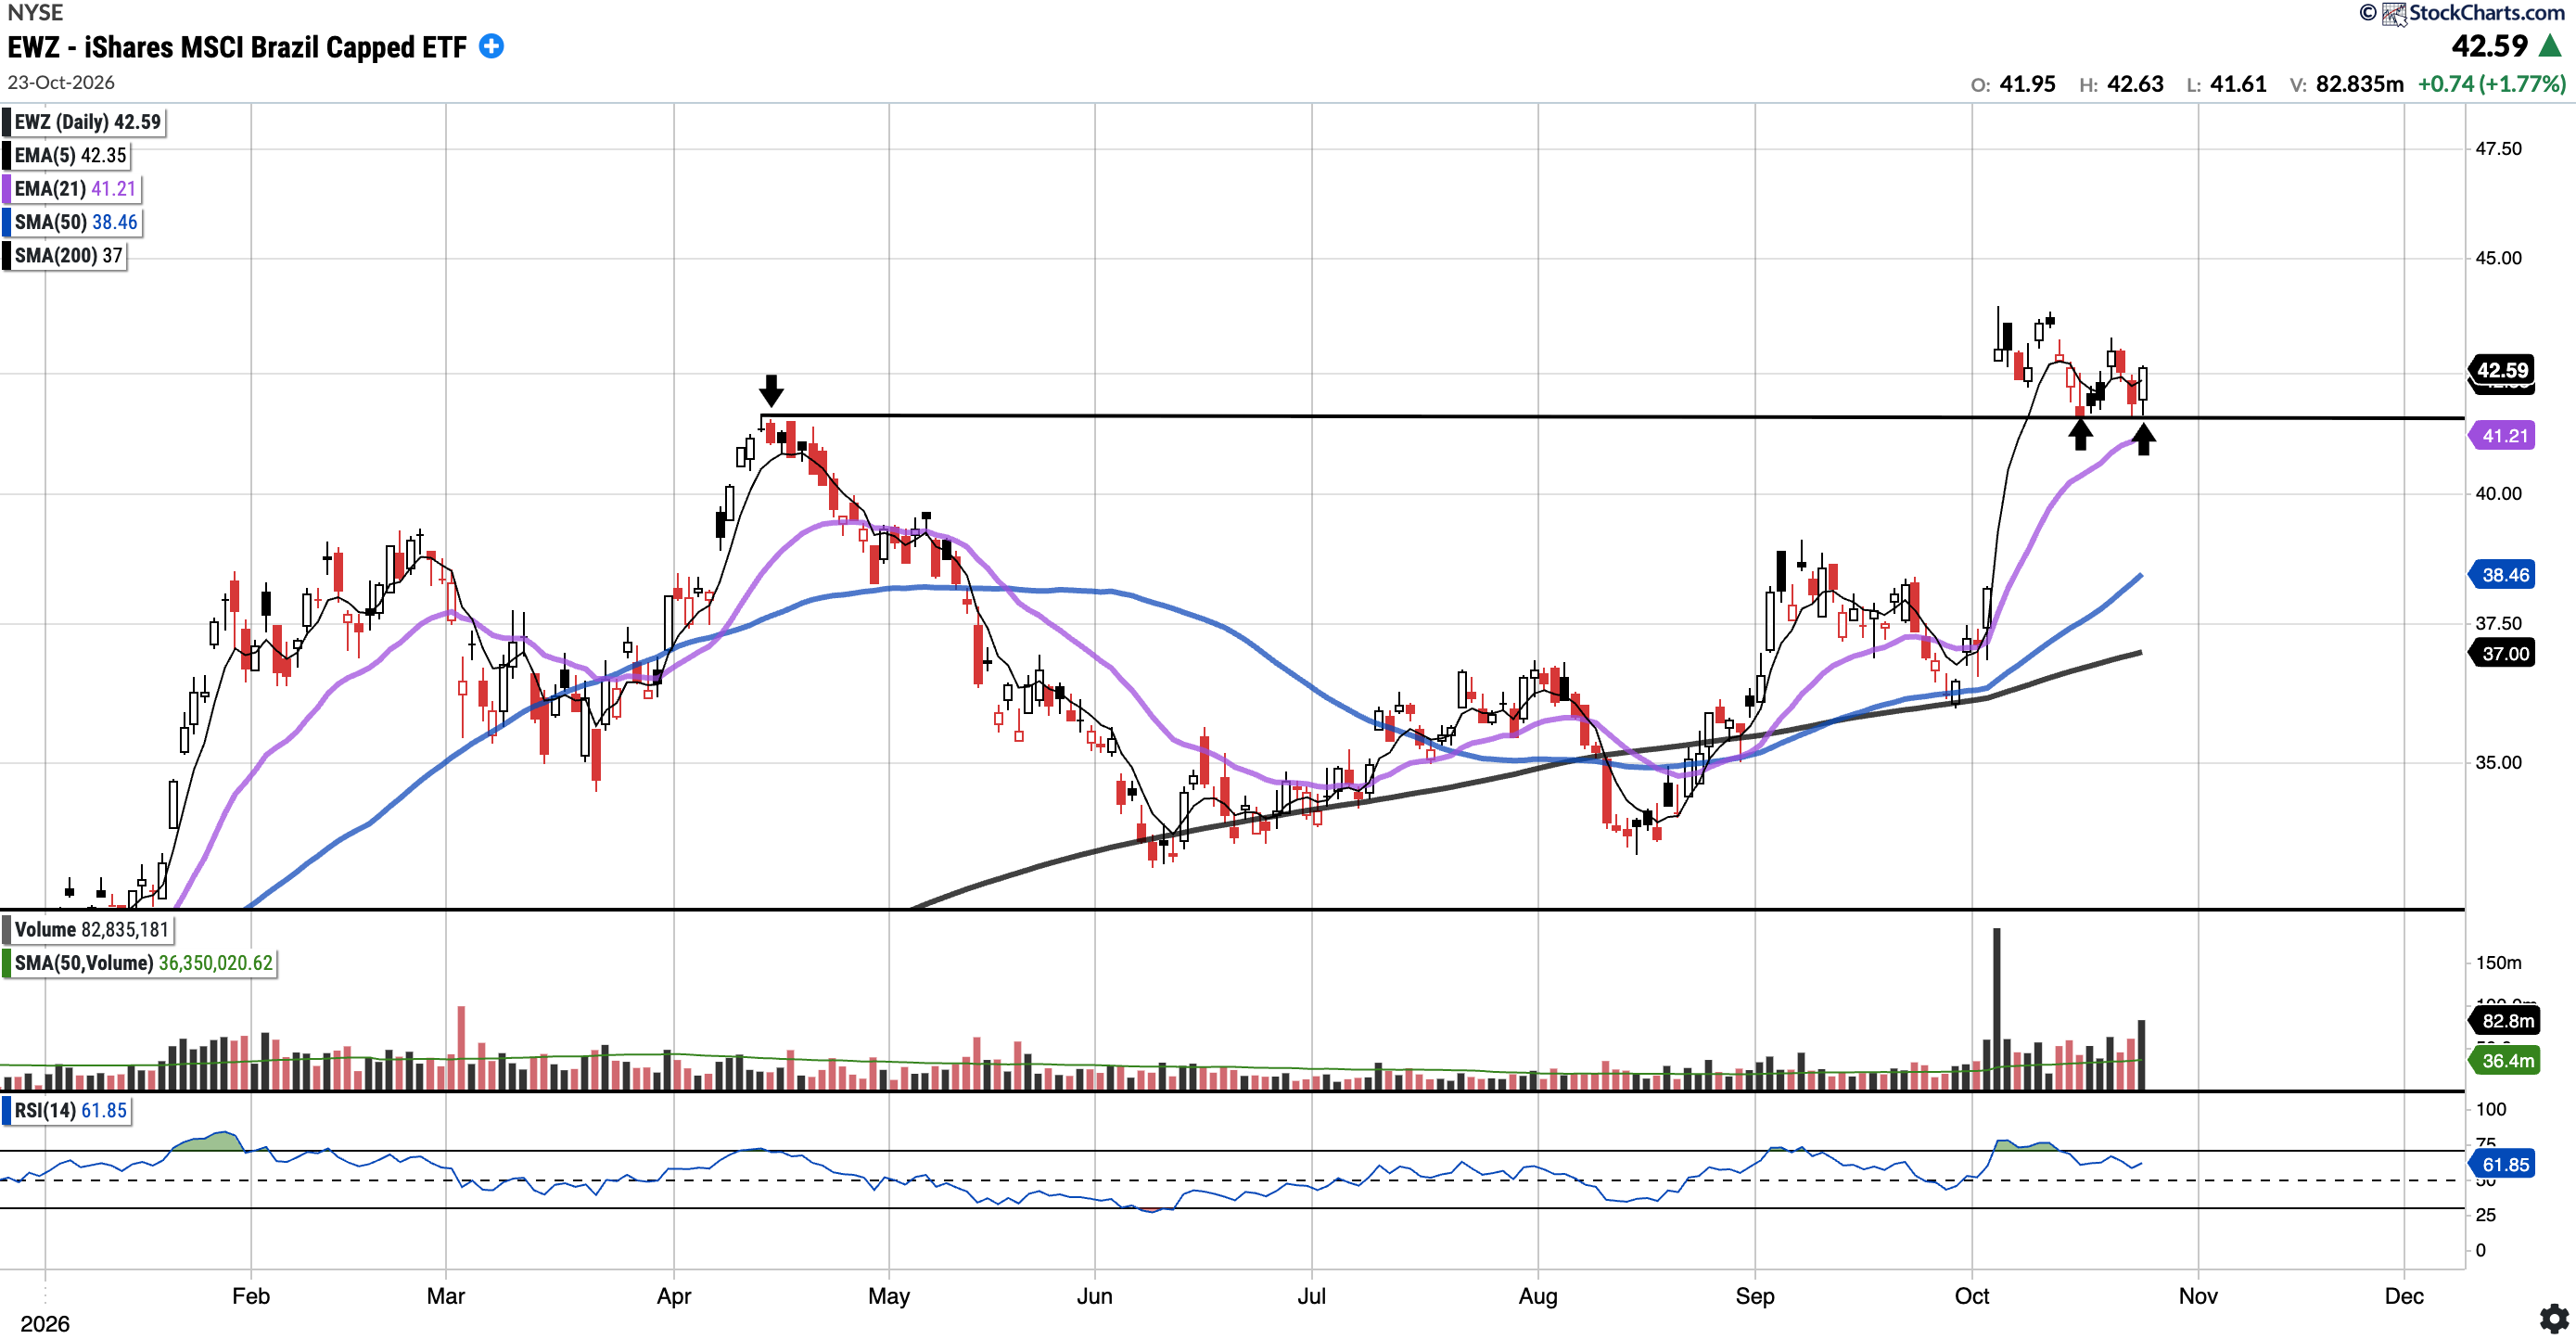
EWZ (Currently Long via IBZL)
Currently trades at $42.59, 10.74% above the 50SMA and 15.12% above the 200SMA.
RSI 61.85
33.53% YTD
EWZ held the April highs (see horizontal line) yet again, with Friday’s bounce off the level (see arrows) coming on volume well above its 50-day average. EWZ closed the week above all key moving averages. Bulls will want to see a push back toward the early October highs near $44, before any hope for continuation on a breakout.
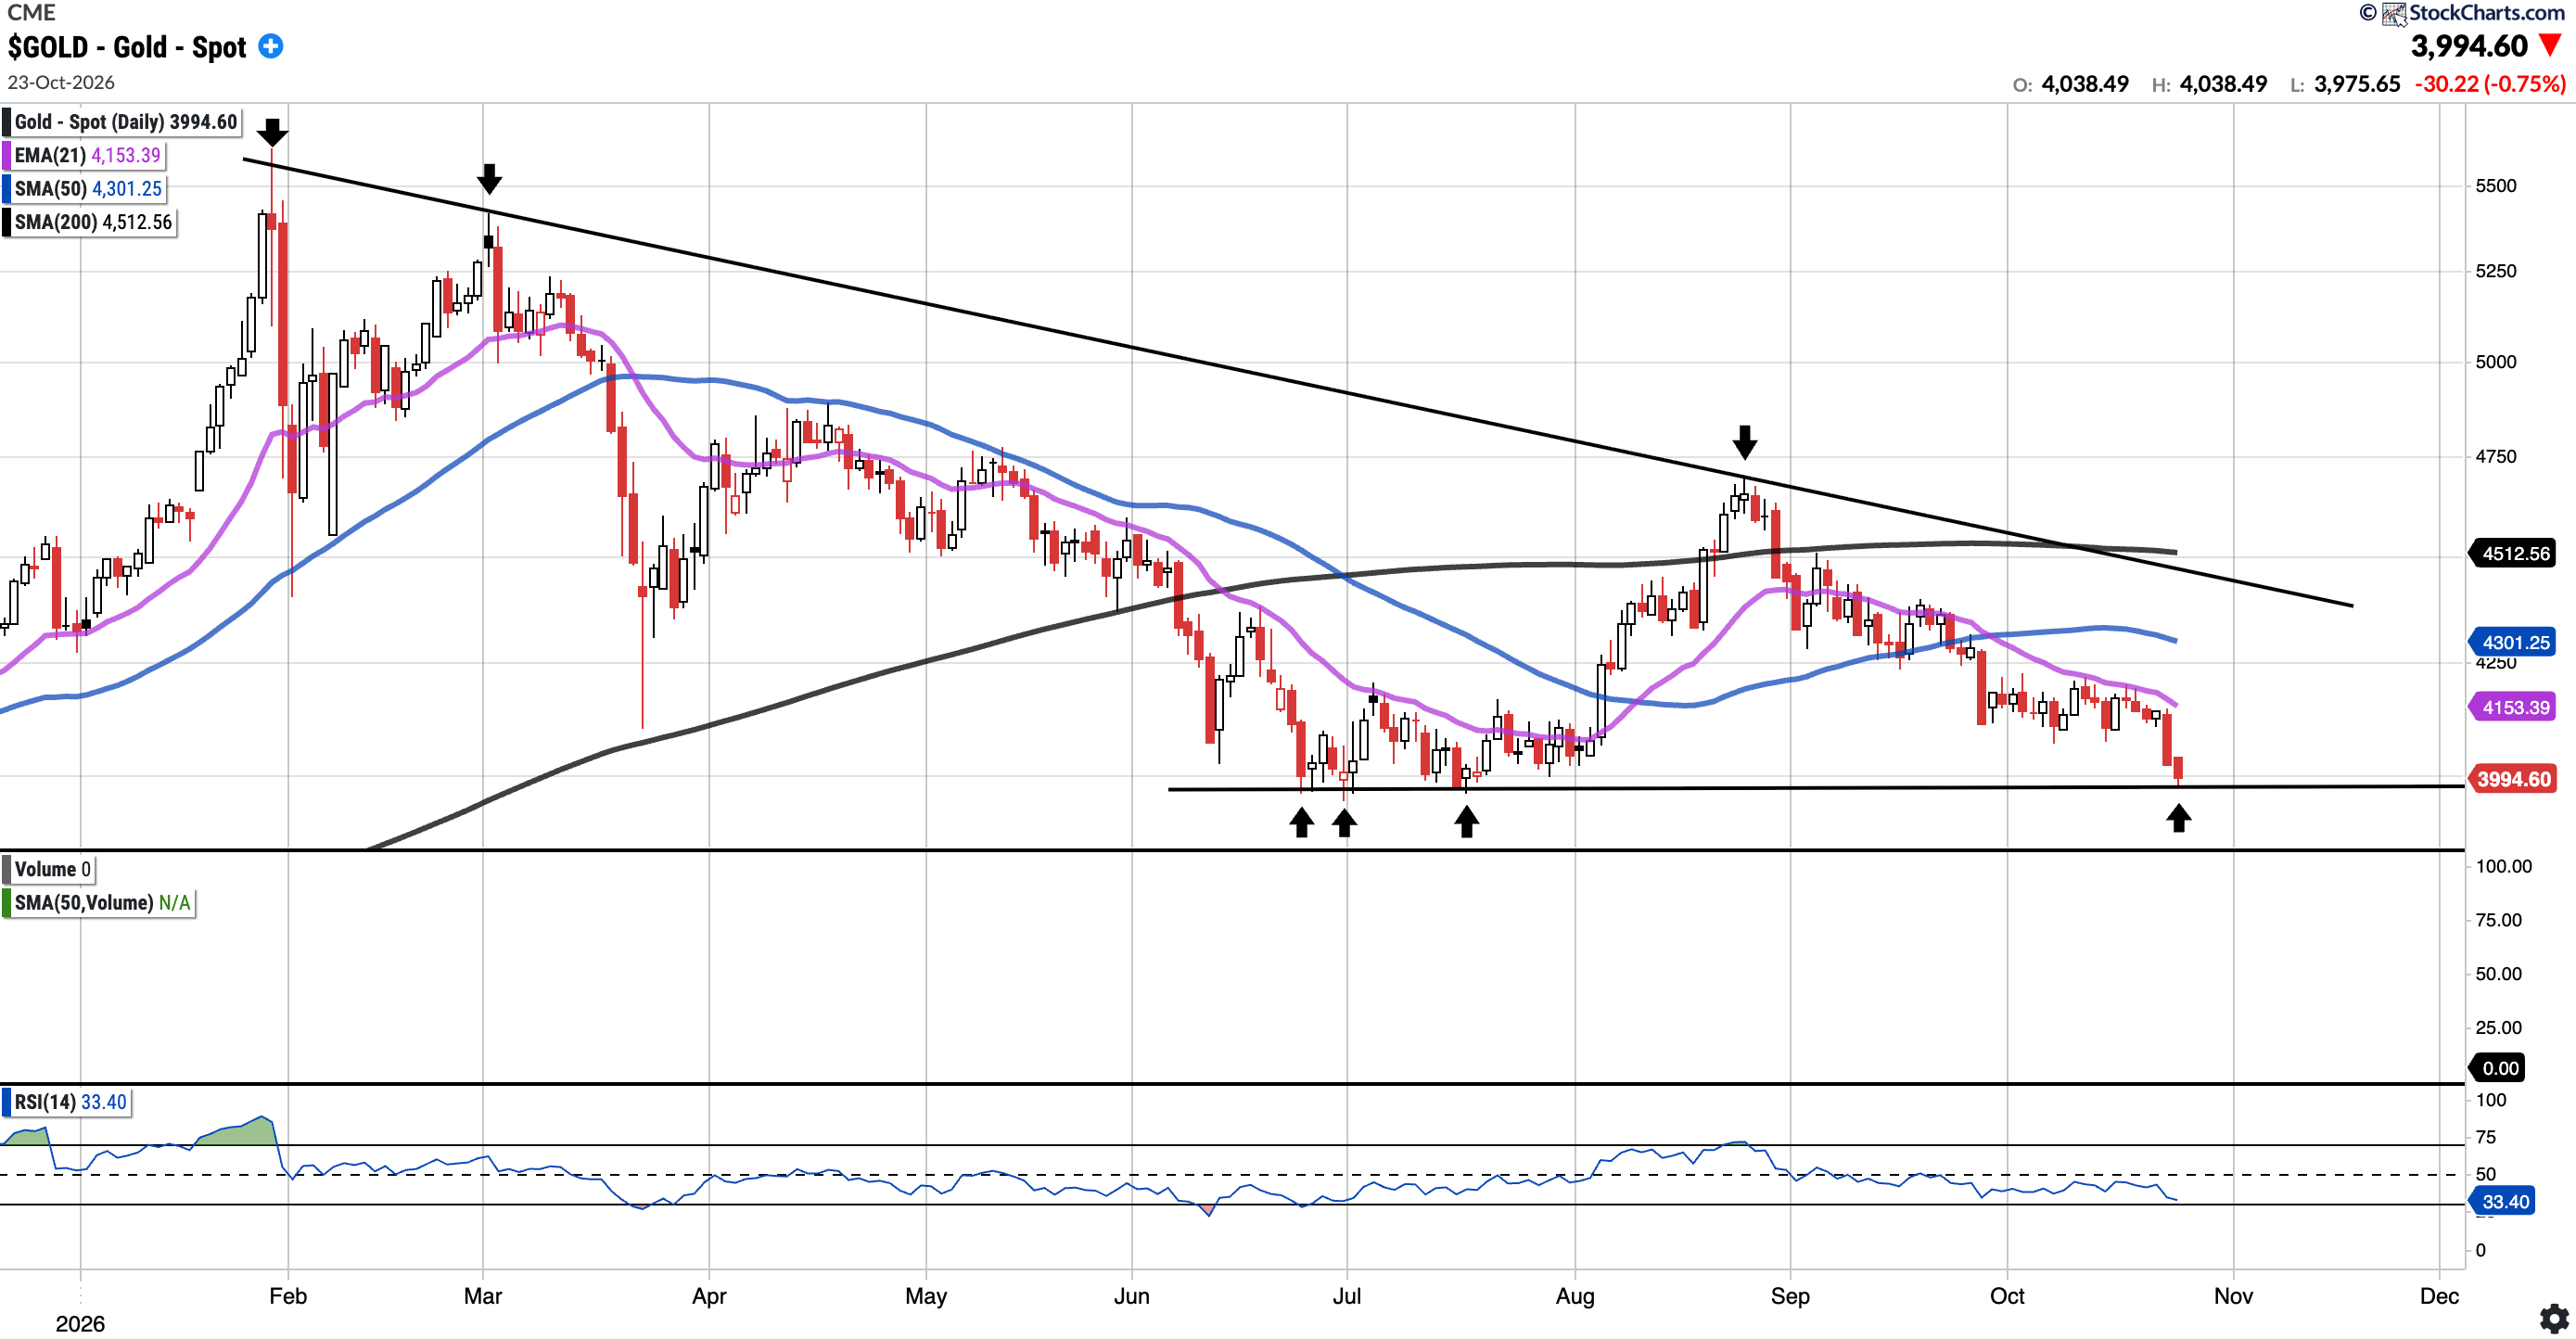
GOLD (Long Physical)
Currently trades at $3,994.60, 7.13% below the 50SMA and 11.48% below the 200SMA.
RSI 33.40
-7.59% YTD
Gold broke below the $4,100-$4,150 support level flagged last week and sold off to the $3950-4,000 zone which marked the June and July lows (see arrows). Bulls will want to see Gold find support there because those levels have served as support since late 2-2025.
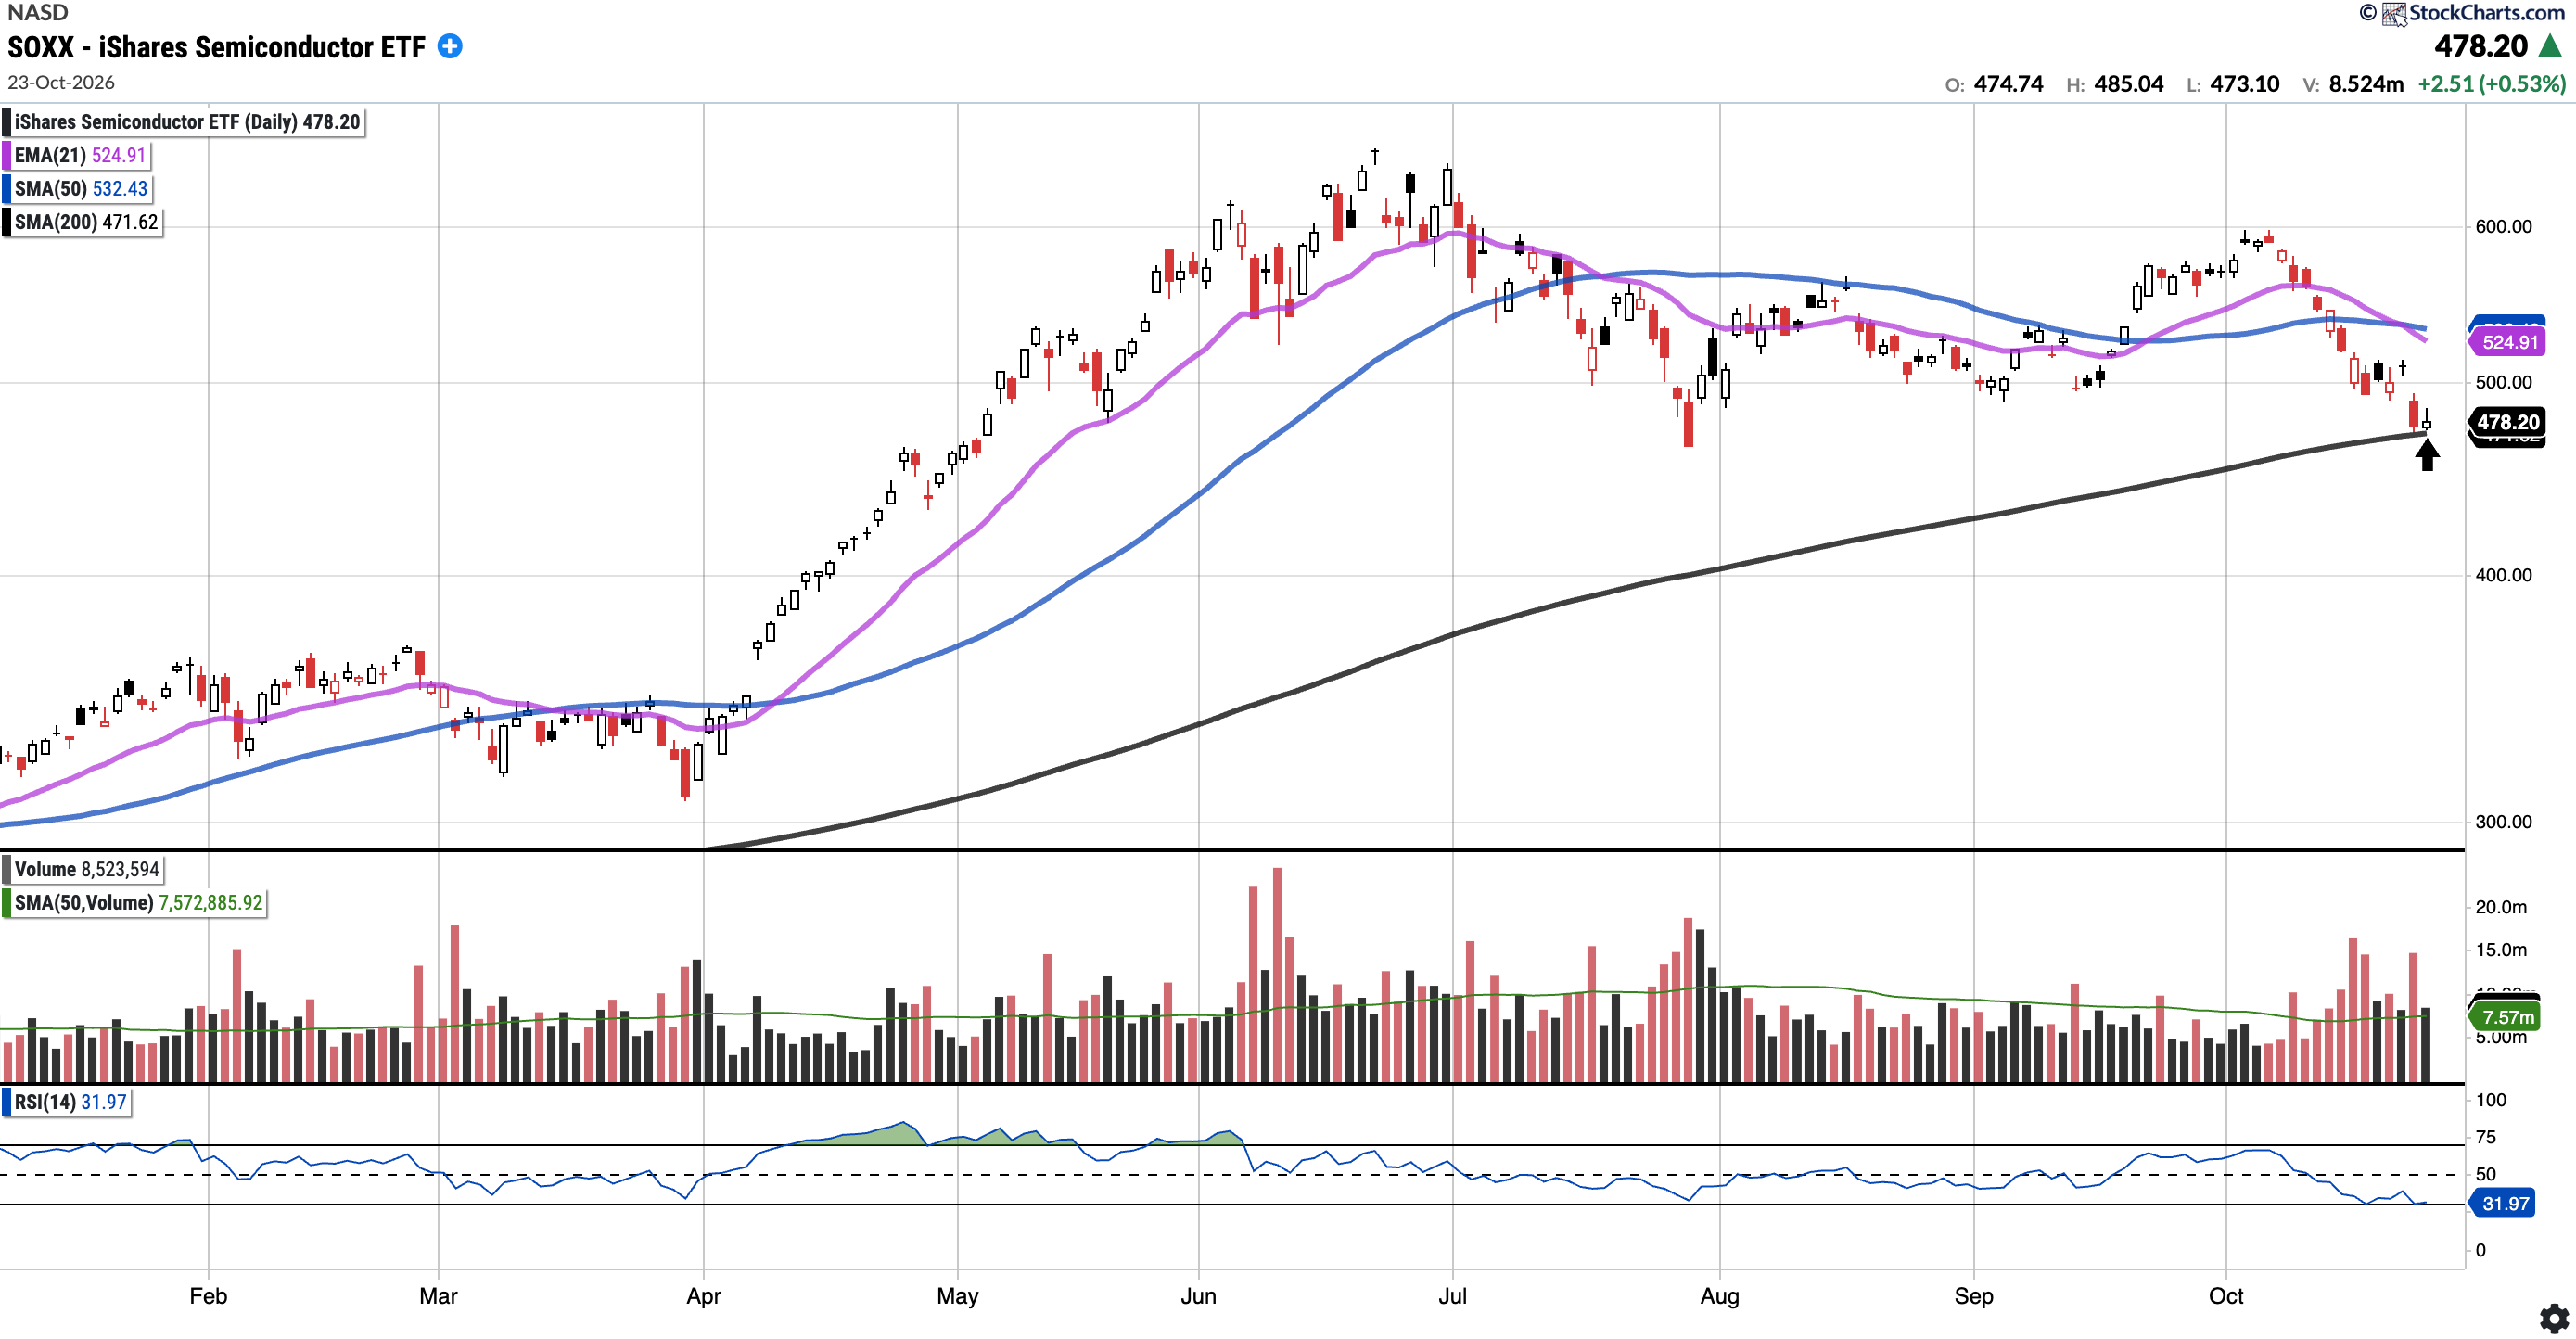
SOXX
Currently trades at $478.20, 10.19% below the 50SMA and 1.39% above the 200SMA.
RSI 31.97
52.71% YTD
SOXX tested its 200-day SMA ($471.62) after another leg lower on Thursday on above-average volume. Friday’s price action was somewhat constructive as the 200 day held as support (for now?). Bulls will want to see the 200-day hold because there is not much support below.
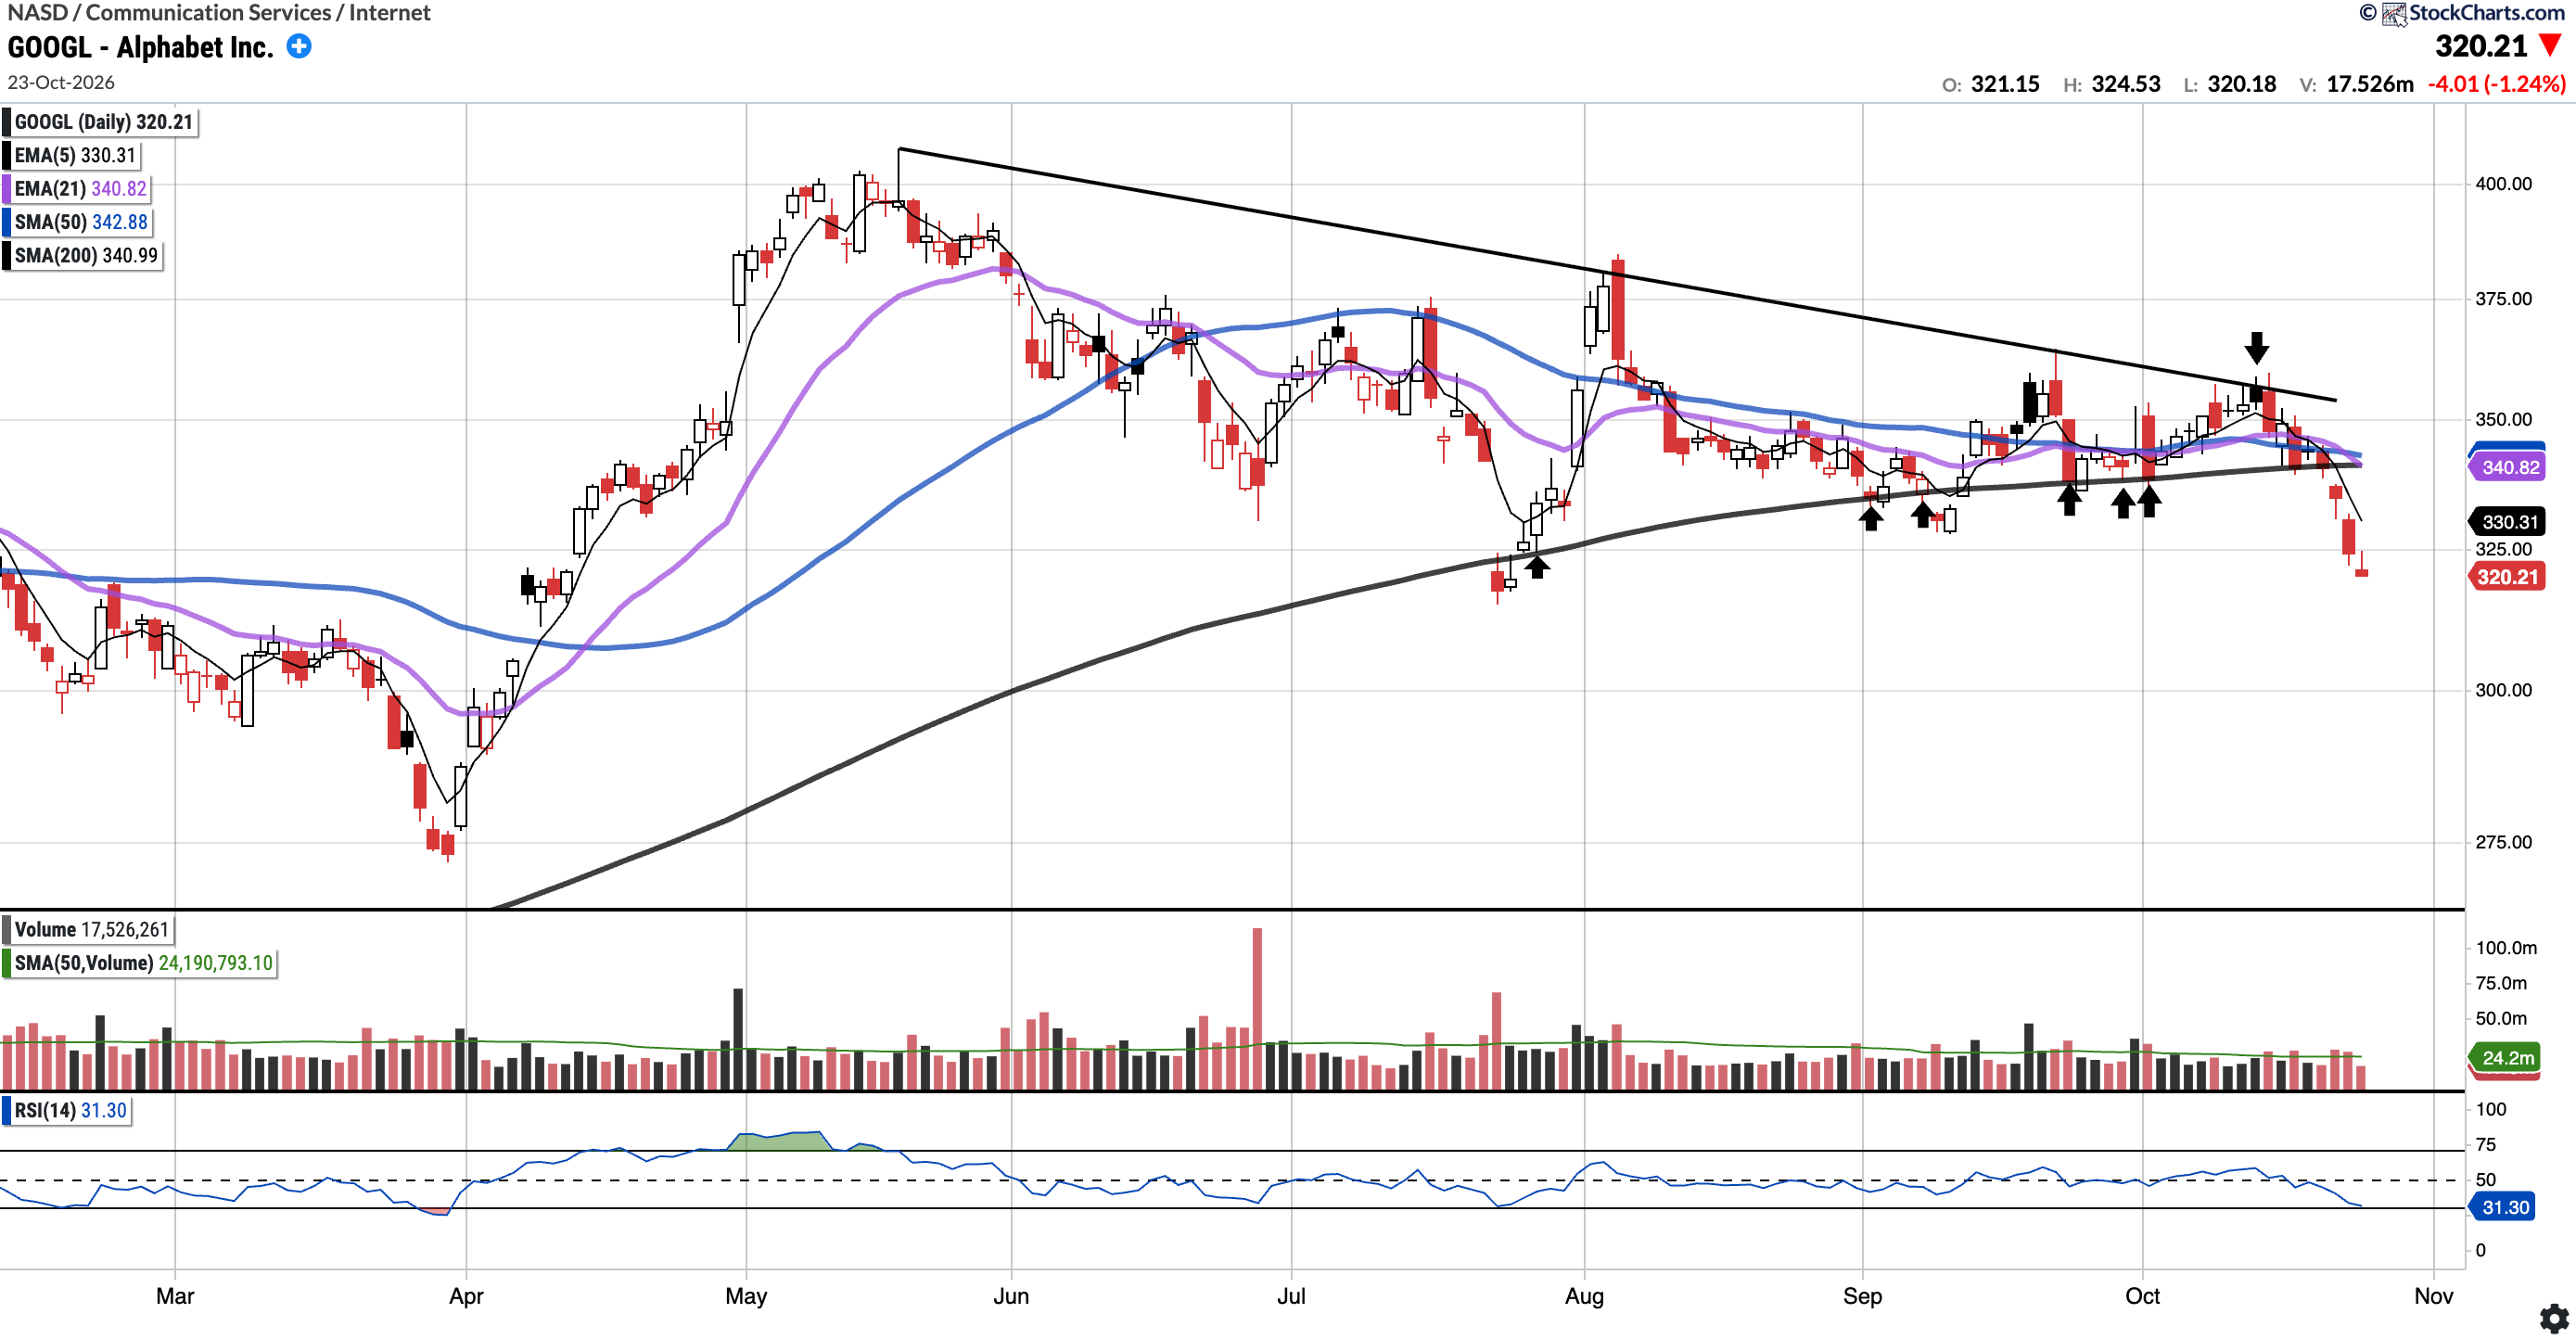
GOOGL (Currently Long)
Currently trades at $320.21, 6.61% below the 50SMA and 6.09% below the 200SMA.
RSI 31.30
1.80% YTD
GOOGL lost the 200-day SMA this week, a level that held as support on multiple tests since July (see up arrows). GOOGL closed the week at below all of its key moving averages. Bulls will want to see the 200-day ($340.99) reclaimed, followed by a break above the descending trendline (see top arrow). Earnings this week could serve as a catalyst.
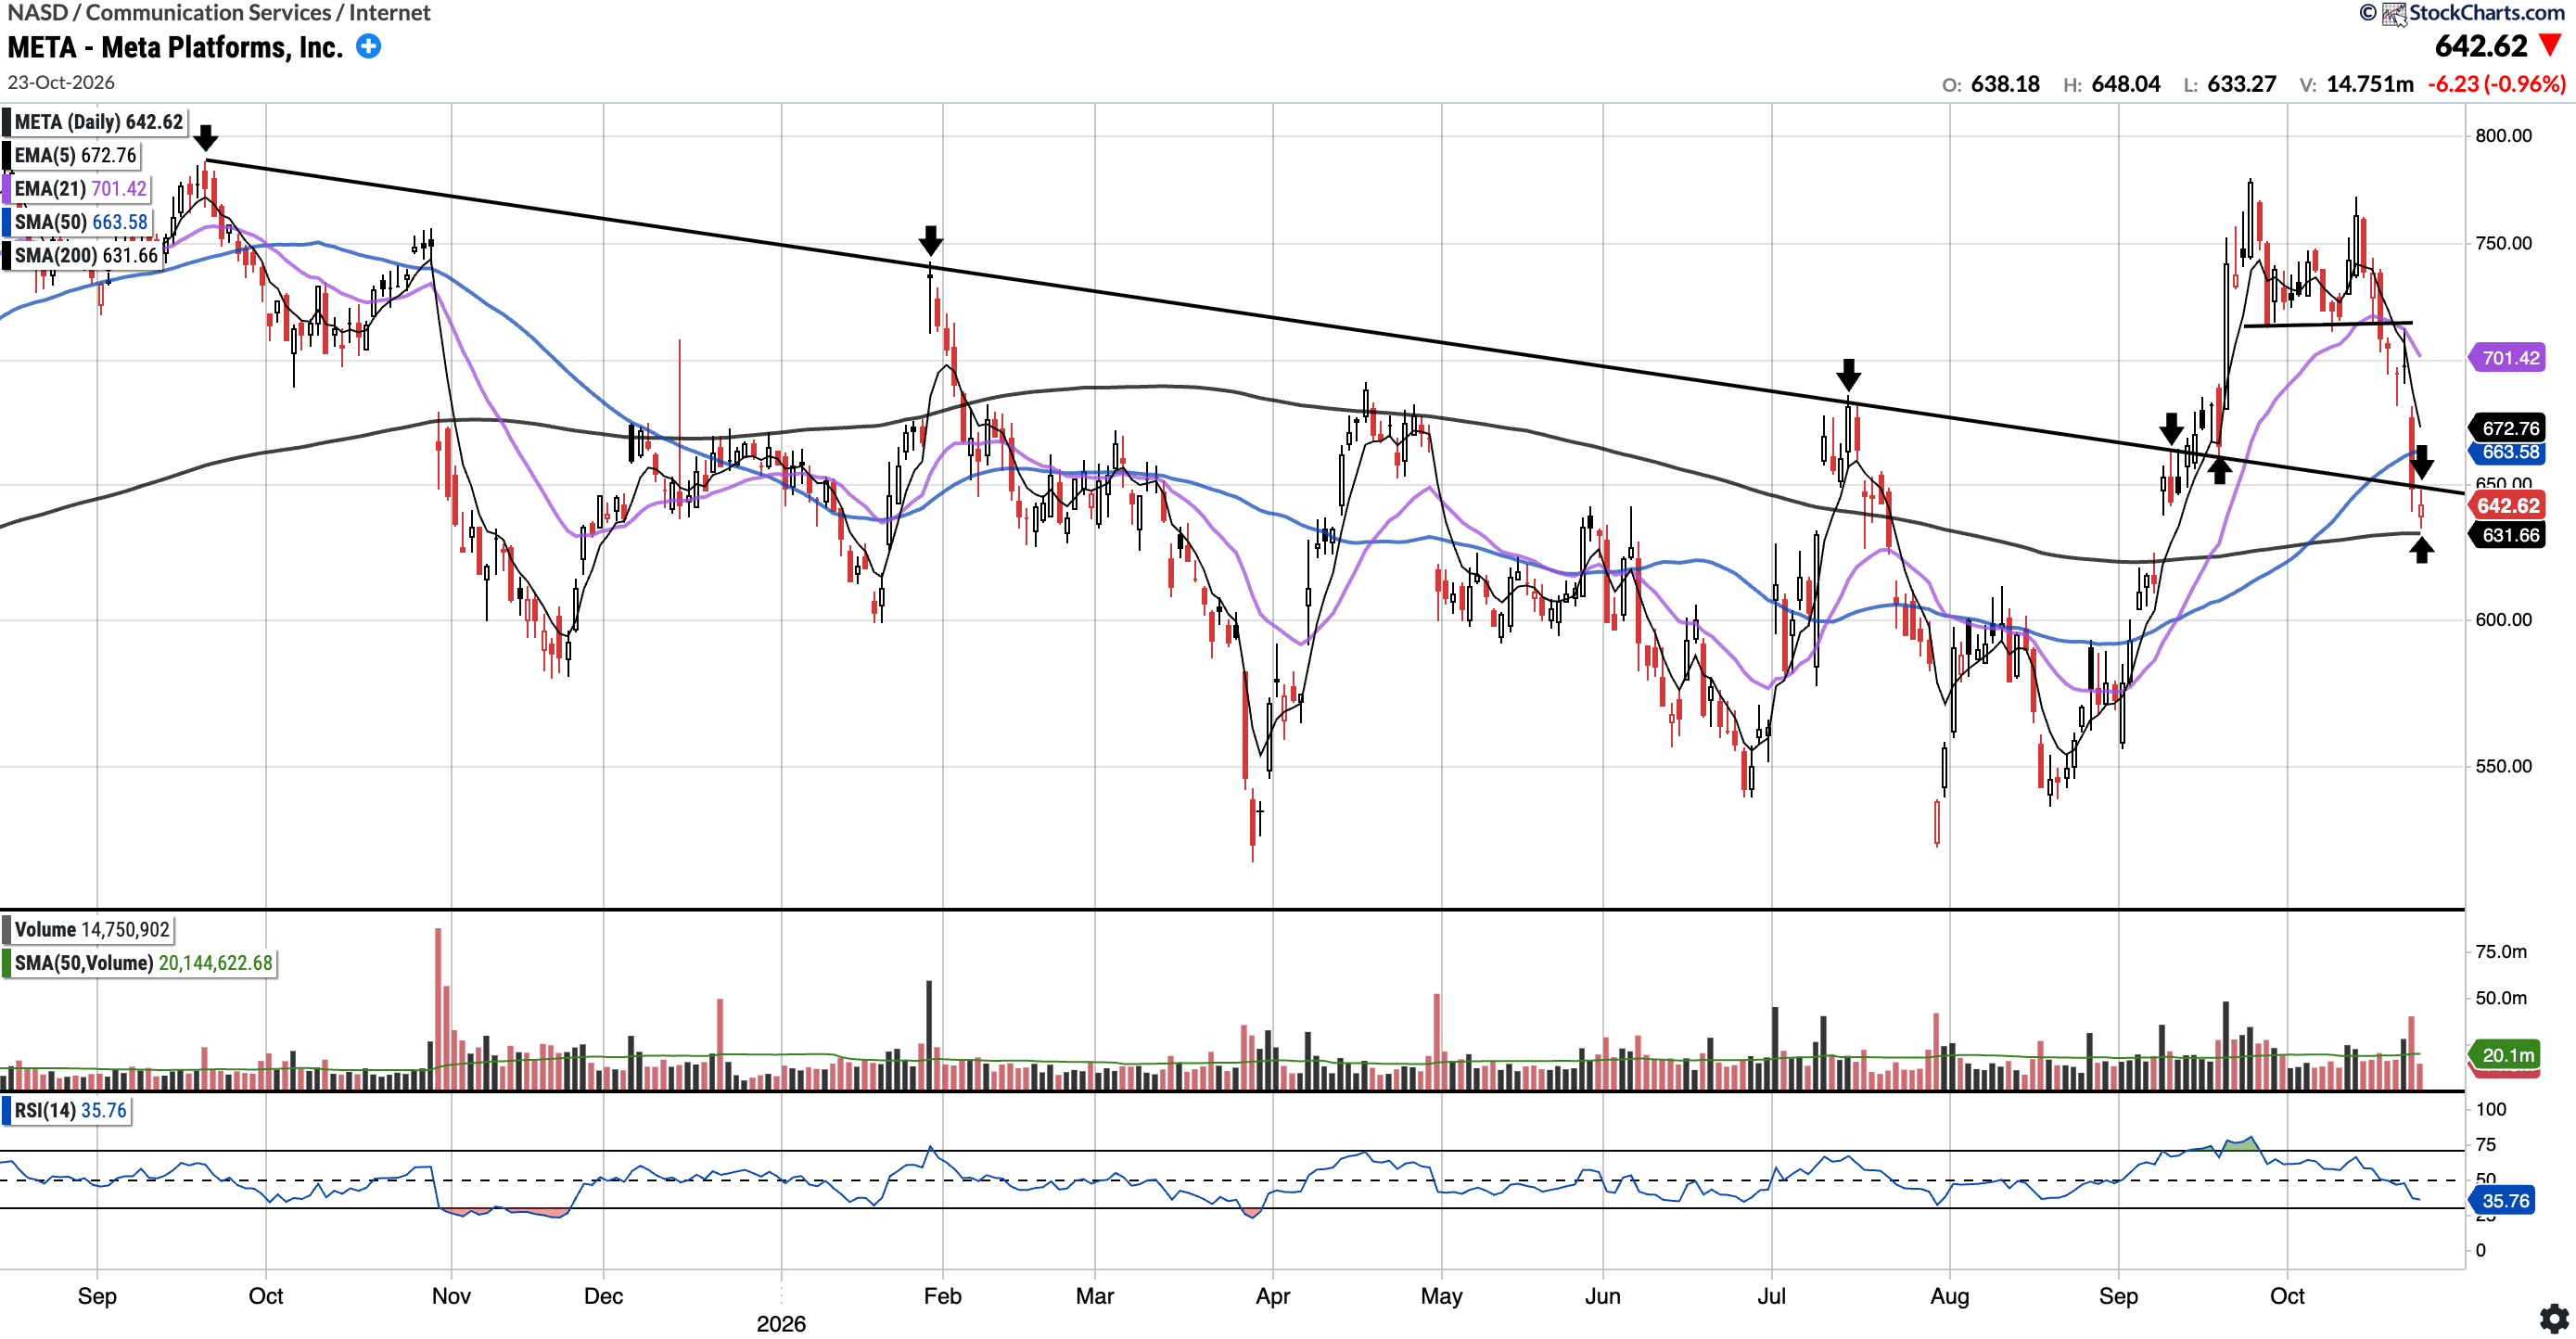
META (Currently Long)
Currently trades at $642.62, 3.16% below the 50SMA and 1.74% above the 200SMA.
RSI 35.76
-0.94% YTD
META sold off sharply on Thursday following earnings, losing the $710-$715 level, its 21-day EMA ($701.42) and the 50-day SMA ($663.58). Price also fell below the descending trendline (see arrows).
META now sits right above the 200-day SMA ($631.66). Bulls will want to see the overhead moving averages reclaimed and those looking for a fresh entry may want to apply the “three-day rule” post earnings.
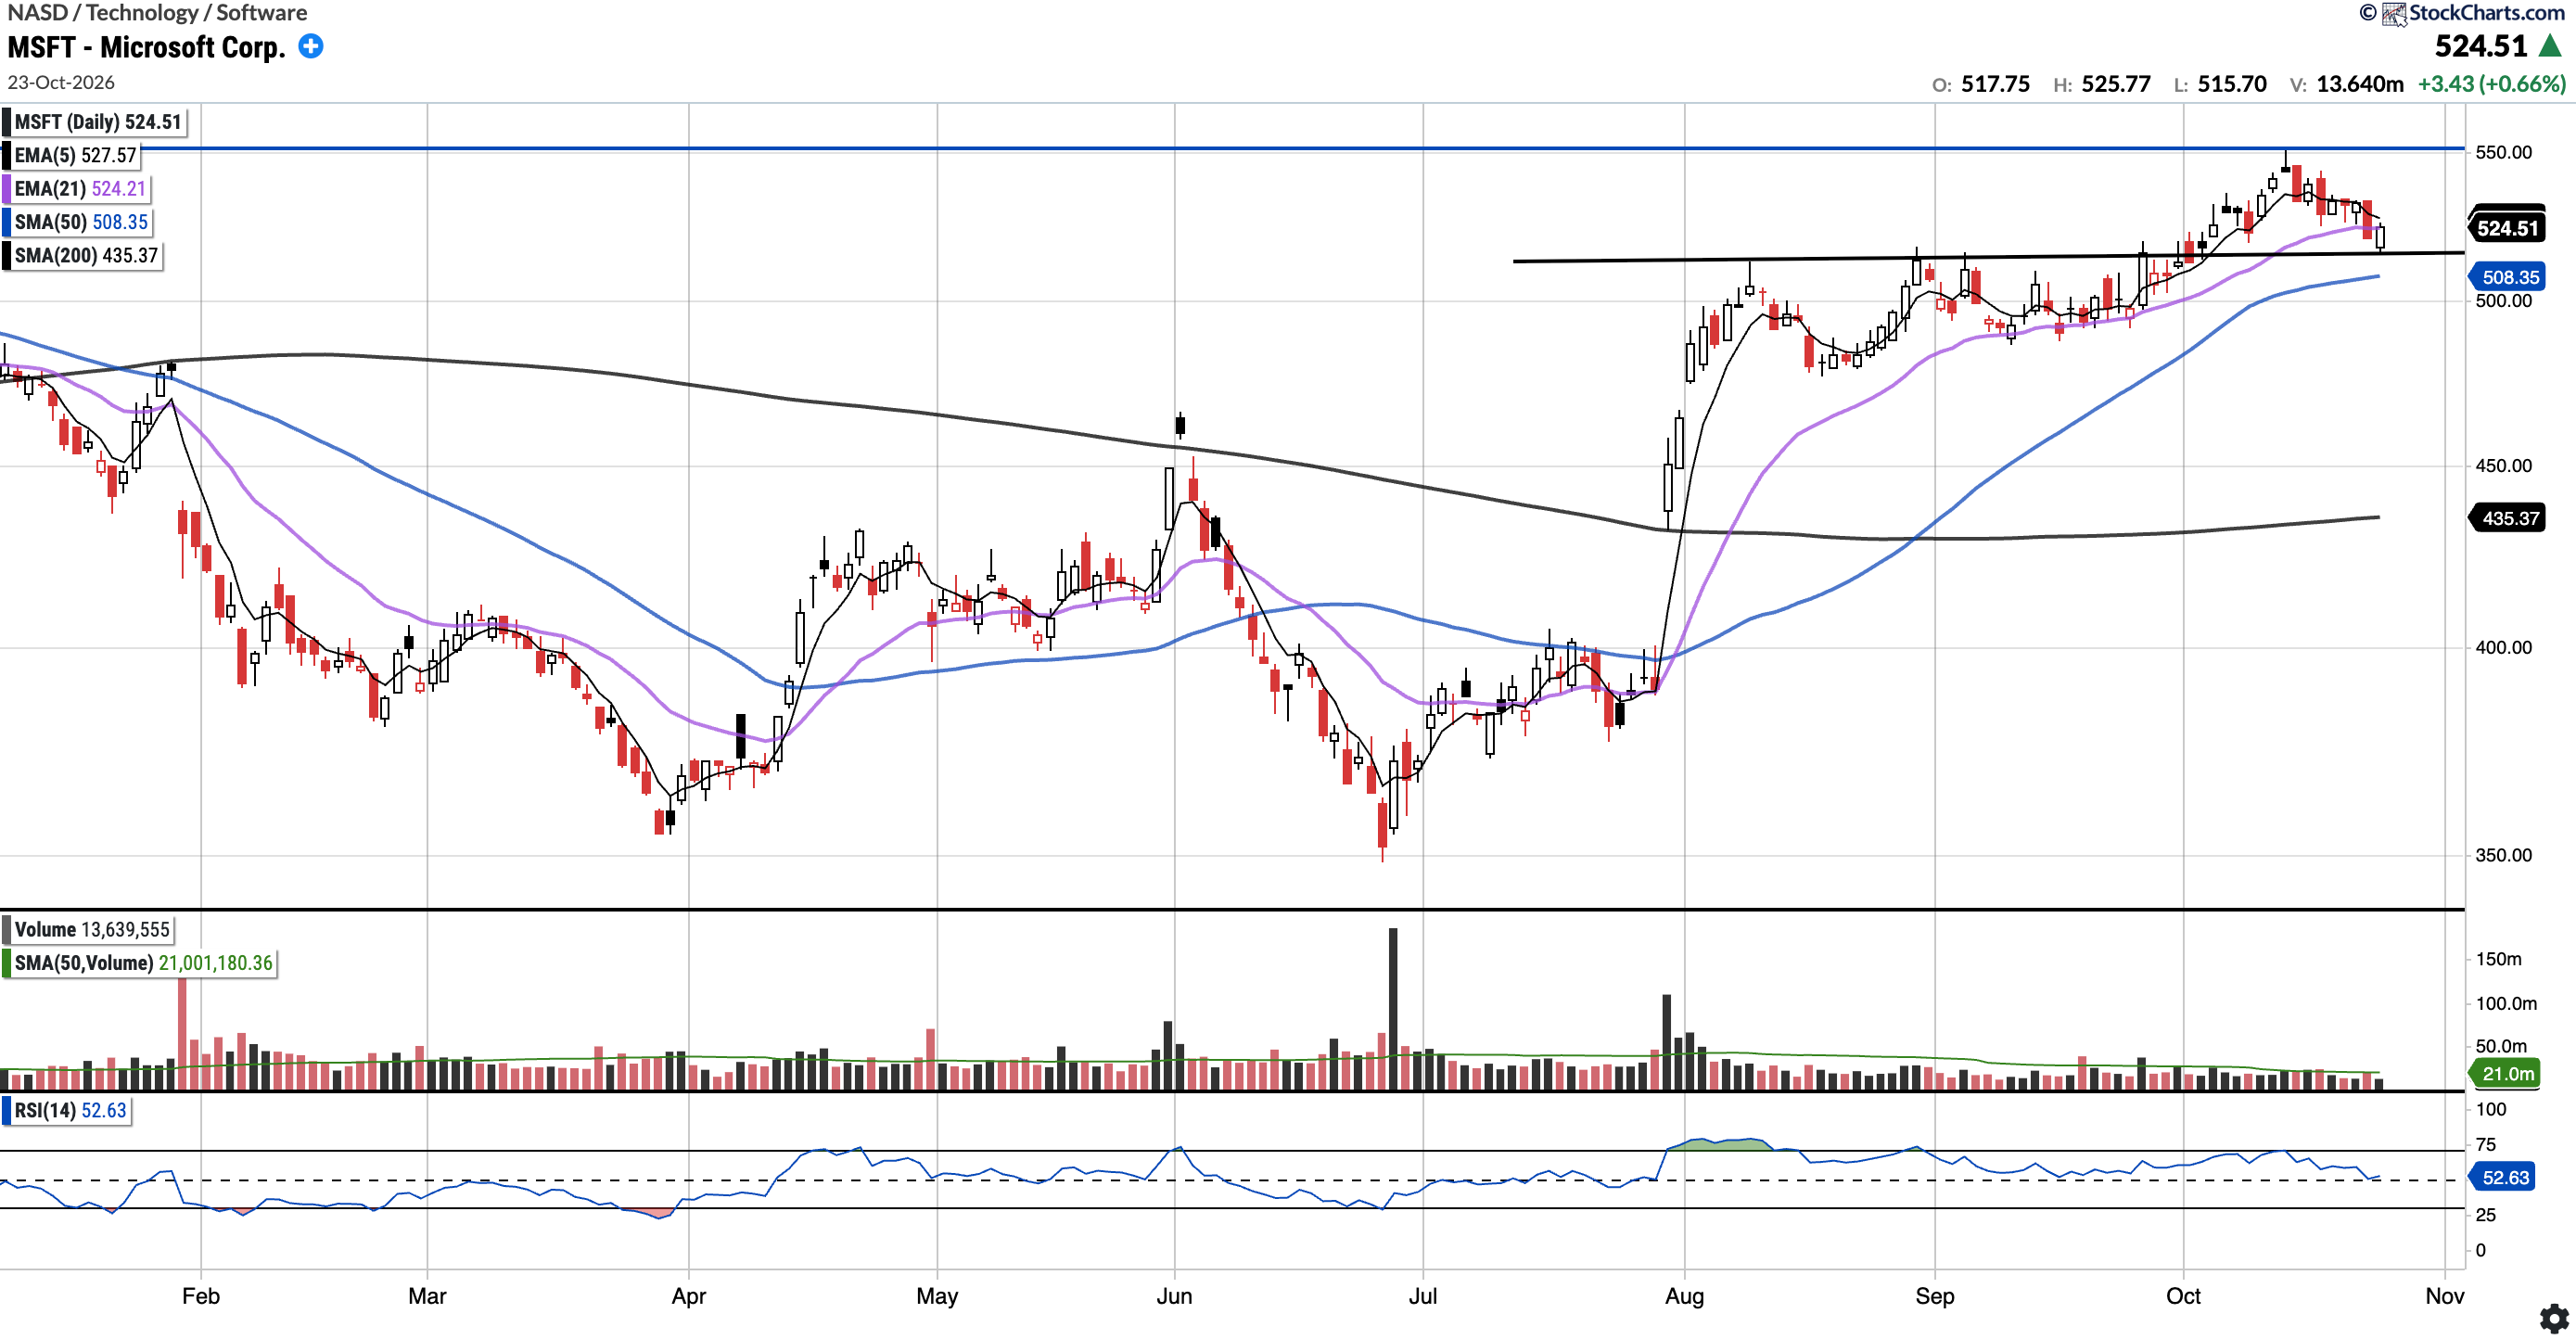
MSFT (Currently Long)
Currently trades at $524.51, 3.18% above the 50SMA and 20.48% above the 200SMA.
RSI 52.63
11.61% YTD
Since MSFT rejected the $550 level (blue horizontal line) last week, the stock has consolidated. Friday’s low coincided with support at $516 (black horizontal line), as price managed to close just at the 21EMA ($524.21). Earnings are this week, and should there be a post-earnings dip, the 50-day SMA ($508.35) is an area of interest.
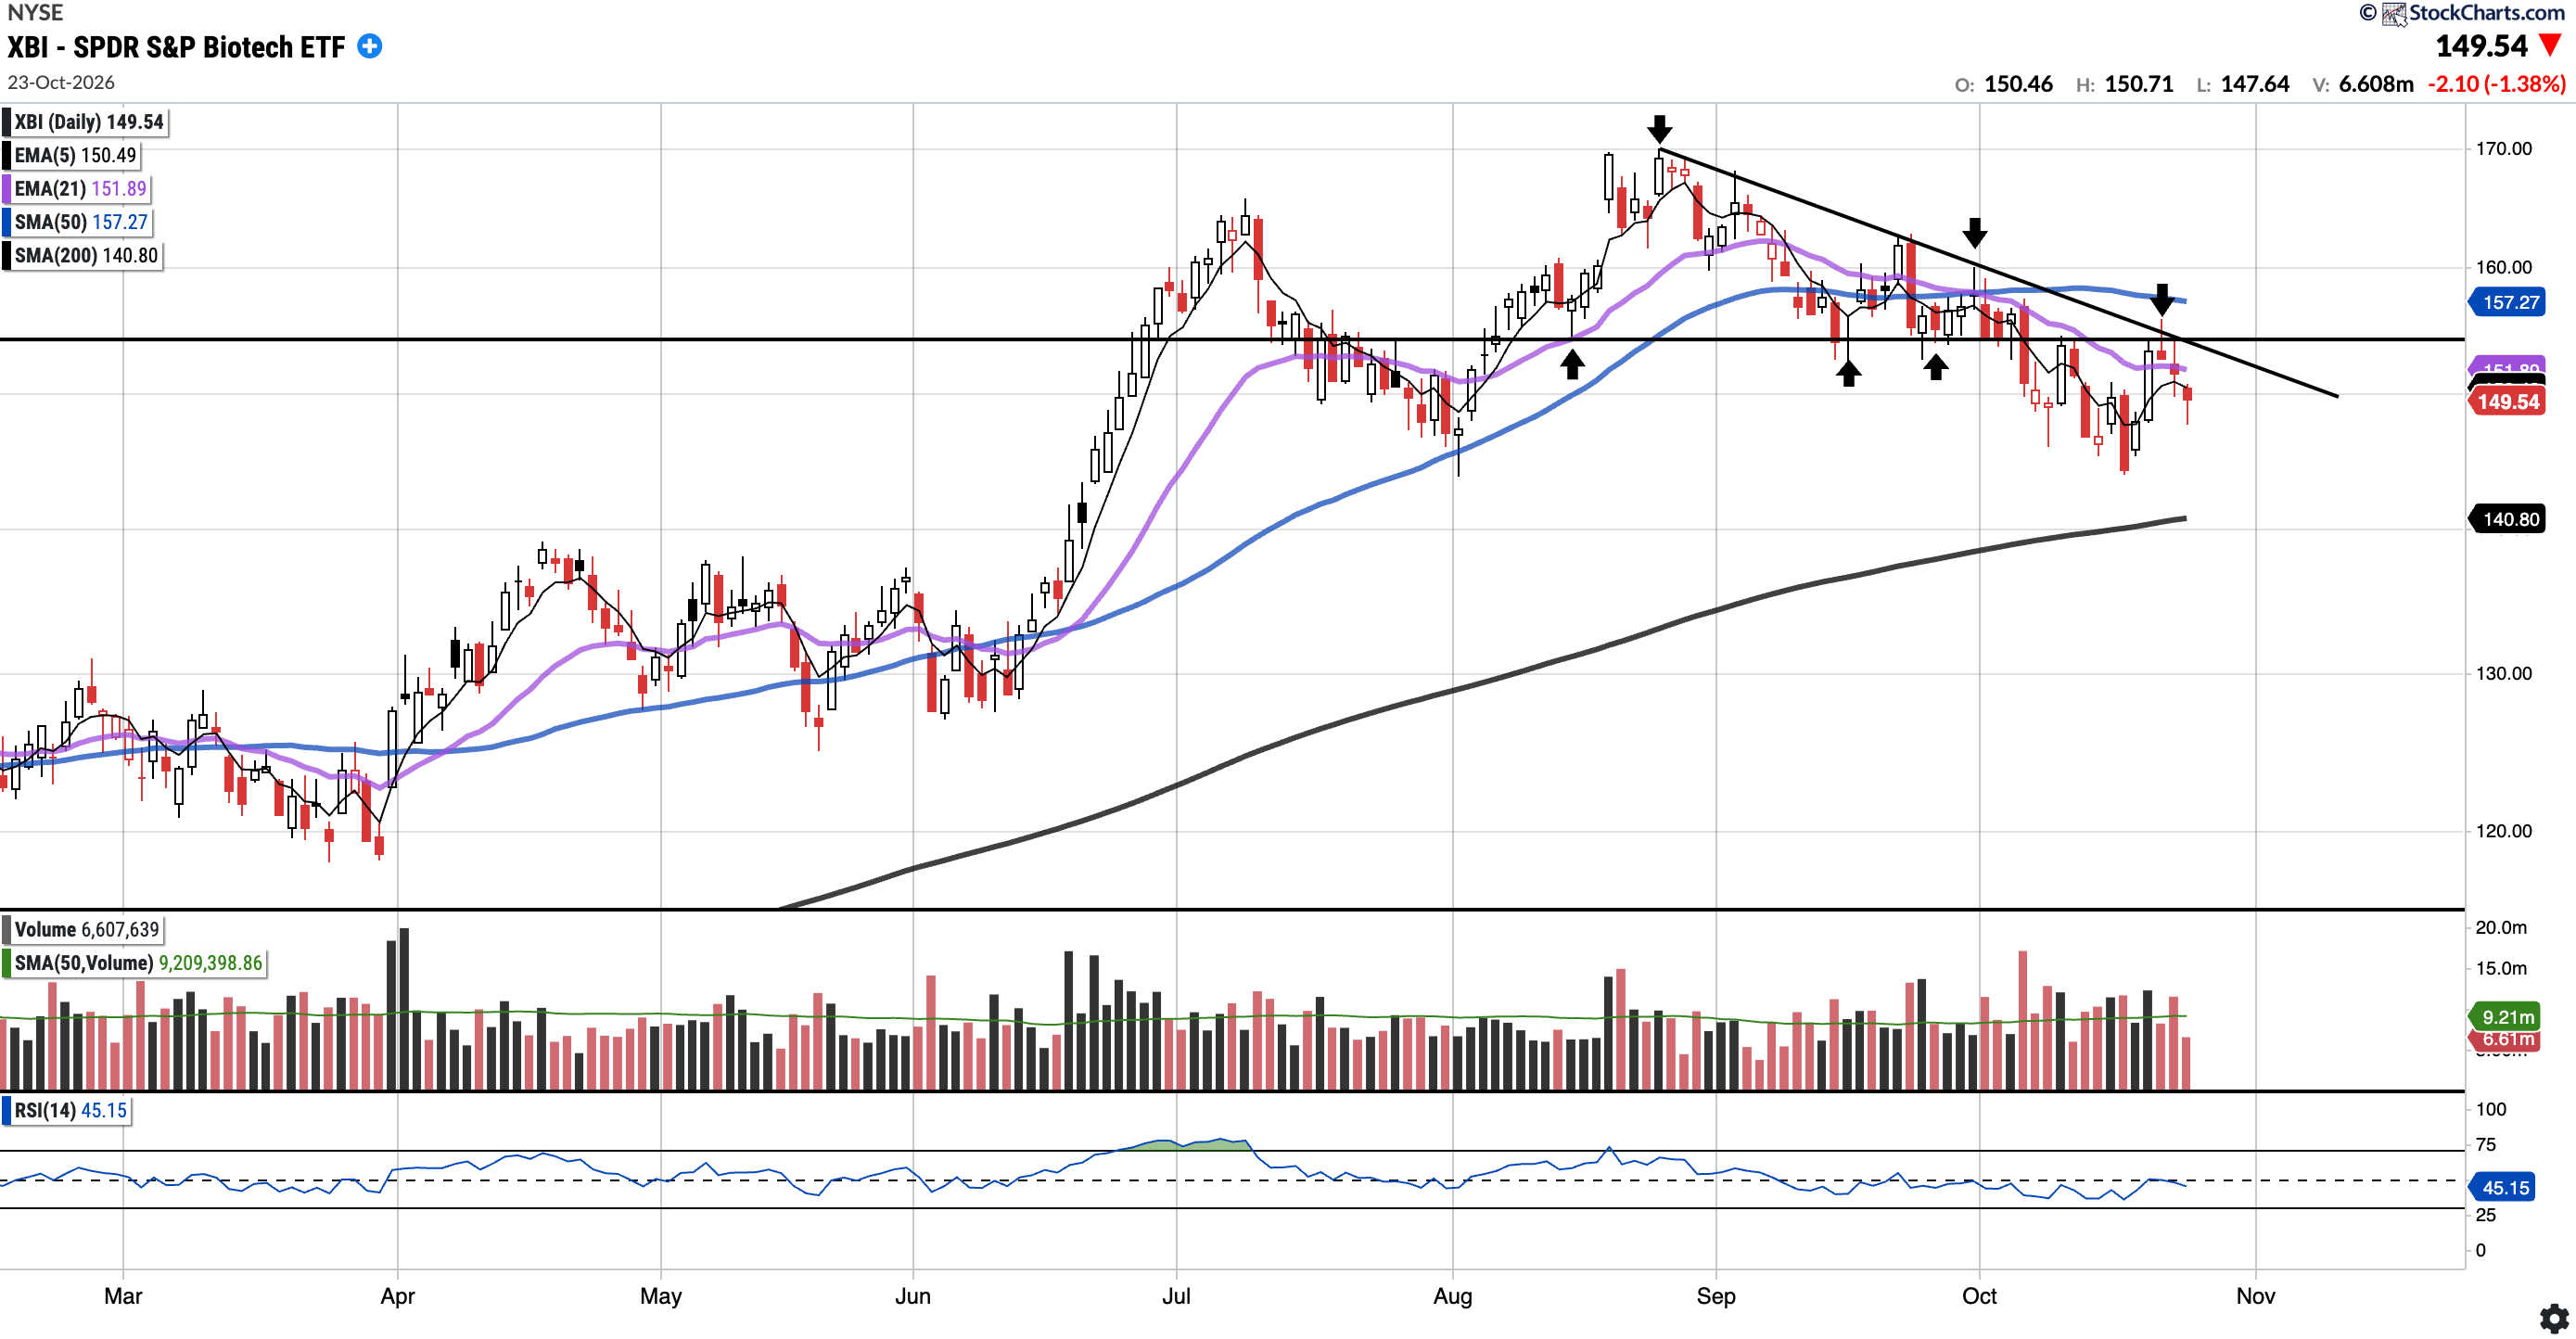
XBI
Currently trades at $149.54, 4.91% below the 50SMA and 6.21% above the 200SMA.
RSI 45.15
23.18% YTD
XBI attempted to breakout (see trendline) early this week but was rejected again (see arrow). The $154 resistance level converges with that trendline. Price closed the week below its 21EMA ($151.89) and 50SMA, with the 200SMA ($140.80) the next major moving average support below. Bulls need to reclaim the 21EMA and $154 and break the trendline to restore the uptrend.
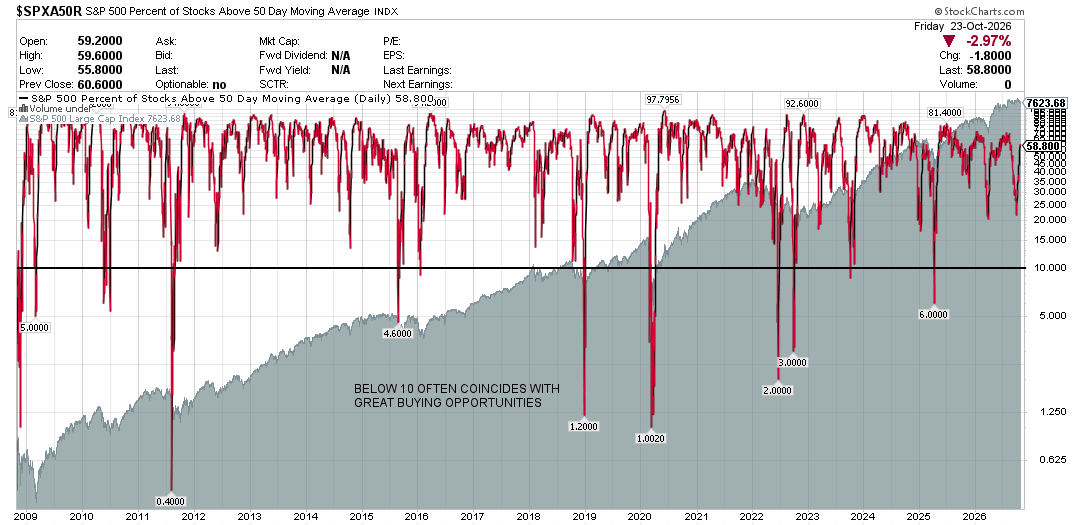
S&P 500 Percentage of Stocks Above the 50 Day Moving Average: Currently 58.80%
Breadth increased decently again this week, with the percentage of stocks above the 50-day moving average now at 58.80% compared to 45.40% last week.
Notable portfolio changes in previous week (all updated live in subscriber channels):