

Hope you all are having a good weekend. Below, we will be previewing the upcoming week’s events and providing a portfolio update as usual.
Format for what is covered in this weekly preview:
A Look at the Indices
Key Upcoming Economic Events
Upcoming Earnings
Charts
Current Portfolio Holdings
Sizing | Cost Basis | Timeframe | Planned Moves
Closing Thoughts (Scroll to here for my Market Commentary)
I recommend checking out the most recent in-depth Monthly Portfolio and Performance Update below (the new post will also be published within the next day).

For all readers a reminder that a premium subscription includes:
Live Portfolio updates (All Buys and Sells) in Subscriber only Channels
Favourite set-up Ideas, Market Memos plus Full archive
Monthly in depth portfolio & performance updates
Annual Tier: Discord access for live trading account updates and AMAs.
Indices
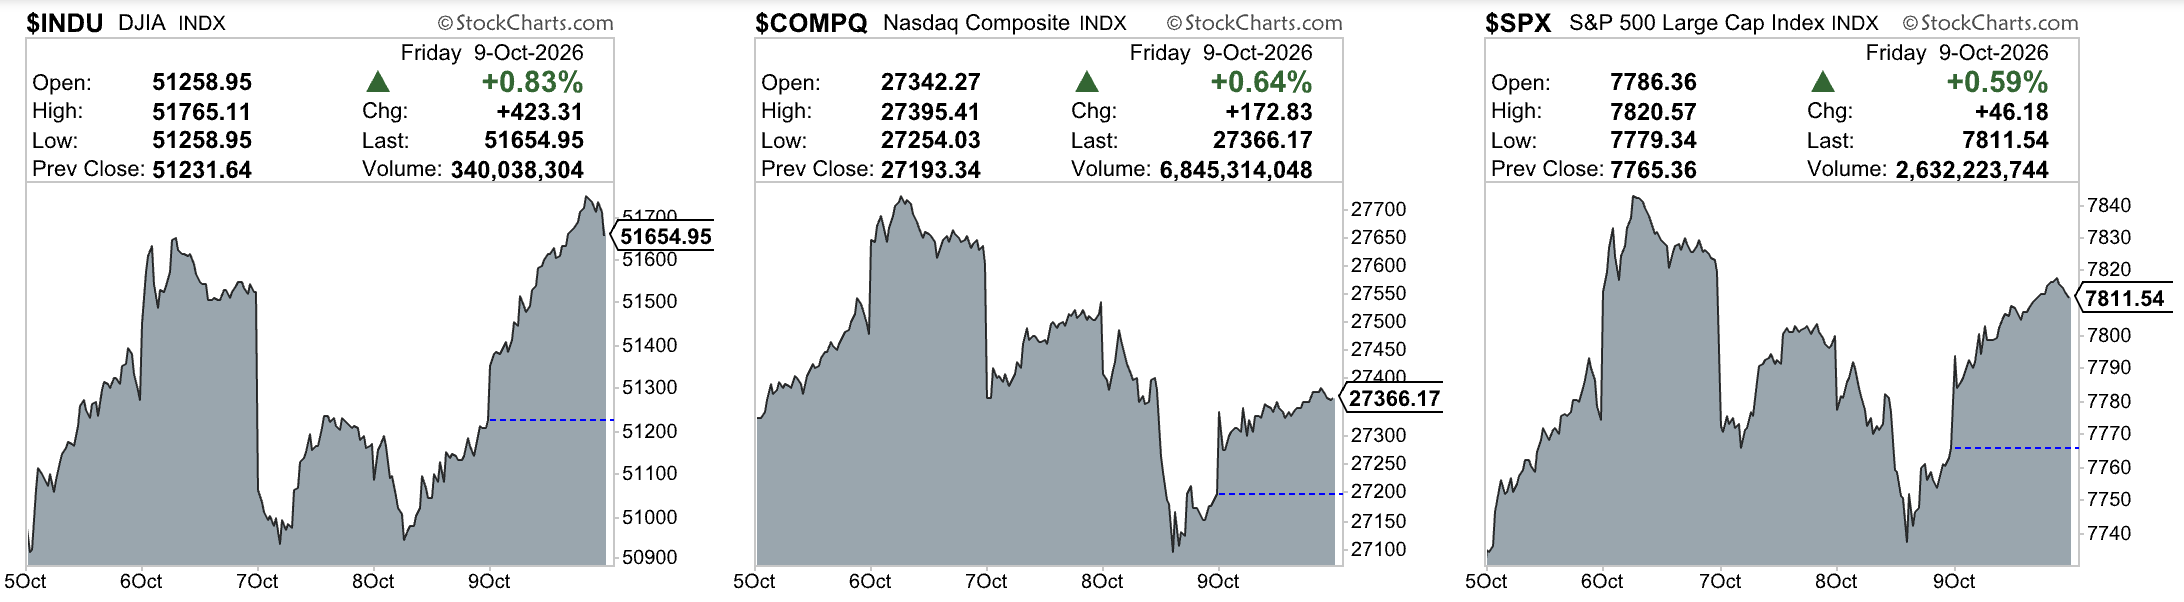
Dow Jones Industrial Average advanced +0.93% in the last week
S&P 500 advanced +1.15% in the last week
Nasdaq Composite advanced +0.64% in the last week
IWM declined -0.92% in the last week
Key upcoming economic events
Monday, October 12
Columbus Day: U.S. bond market closed, stock market open
Cleveland Fed President Beth Hammack speaks at the NABE Annual Meeting
Tuesday, October 13
Fed Governor Christopher Waller speaks on AI at the Bloomberg New Economy Forum
NFIB Small Business Optimism Index (September)
Wednesday, October 14
Fed Vice Chair Michelle Bowman speaks on regulation and supervision
Consumer Price Index (September)
Fed Beige Book
Thursday, October 15
Producer Price Index (September)
Initial Weekly Jobless Claims
Retail Sales (September)
Empire State Manufacturing Survey (October)
Philadelphia Fed Manufacturing Index (October)
Manufacturing and Trade: Inventories and Sales (August)
Friday, October 16
Industrial Production and Capacity Utilization (September)
Import and Export Price Indexes (September)
Upcoming Earnings
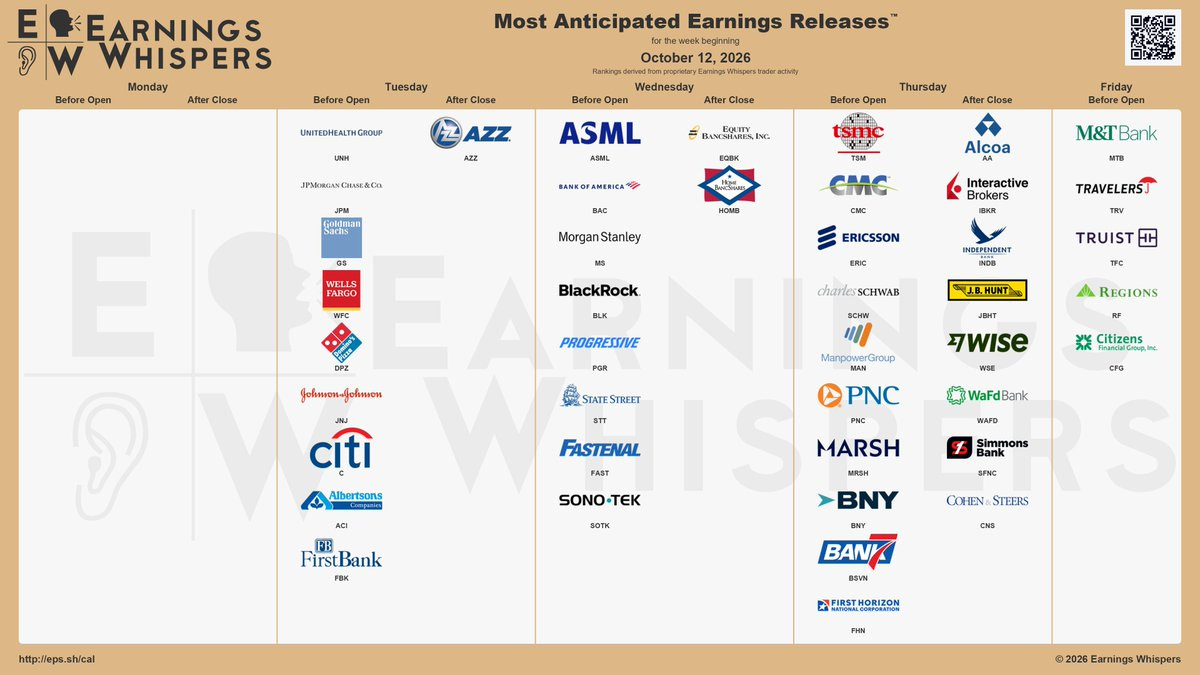
Below is the infographic by Earnings Whispers highlighting the schedule for this week:
Charts
SPX
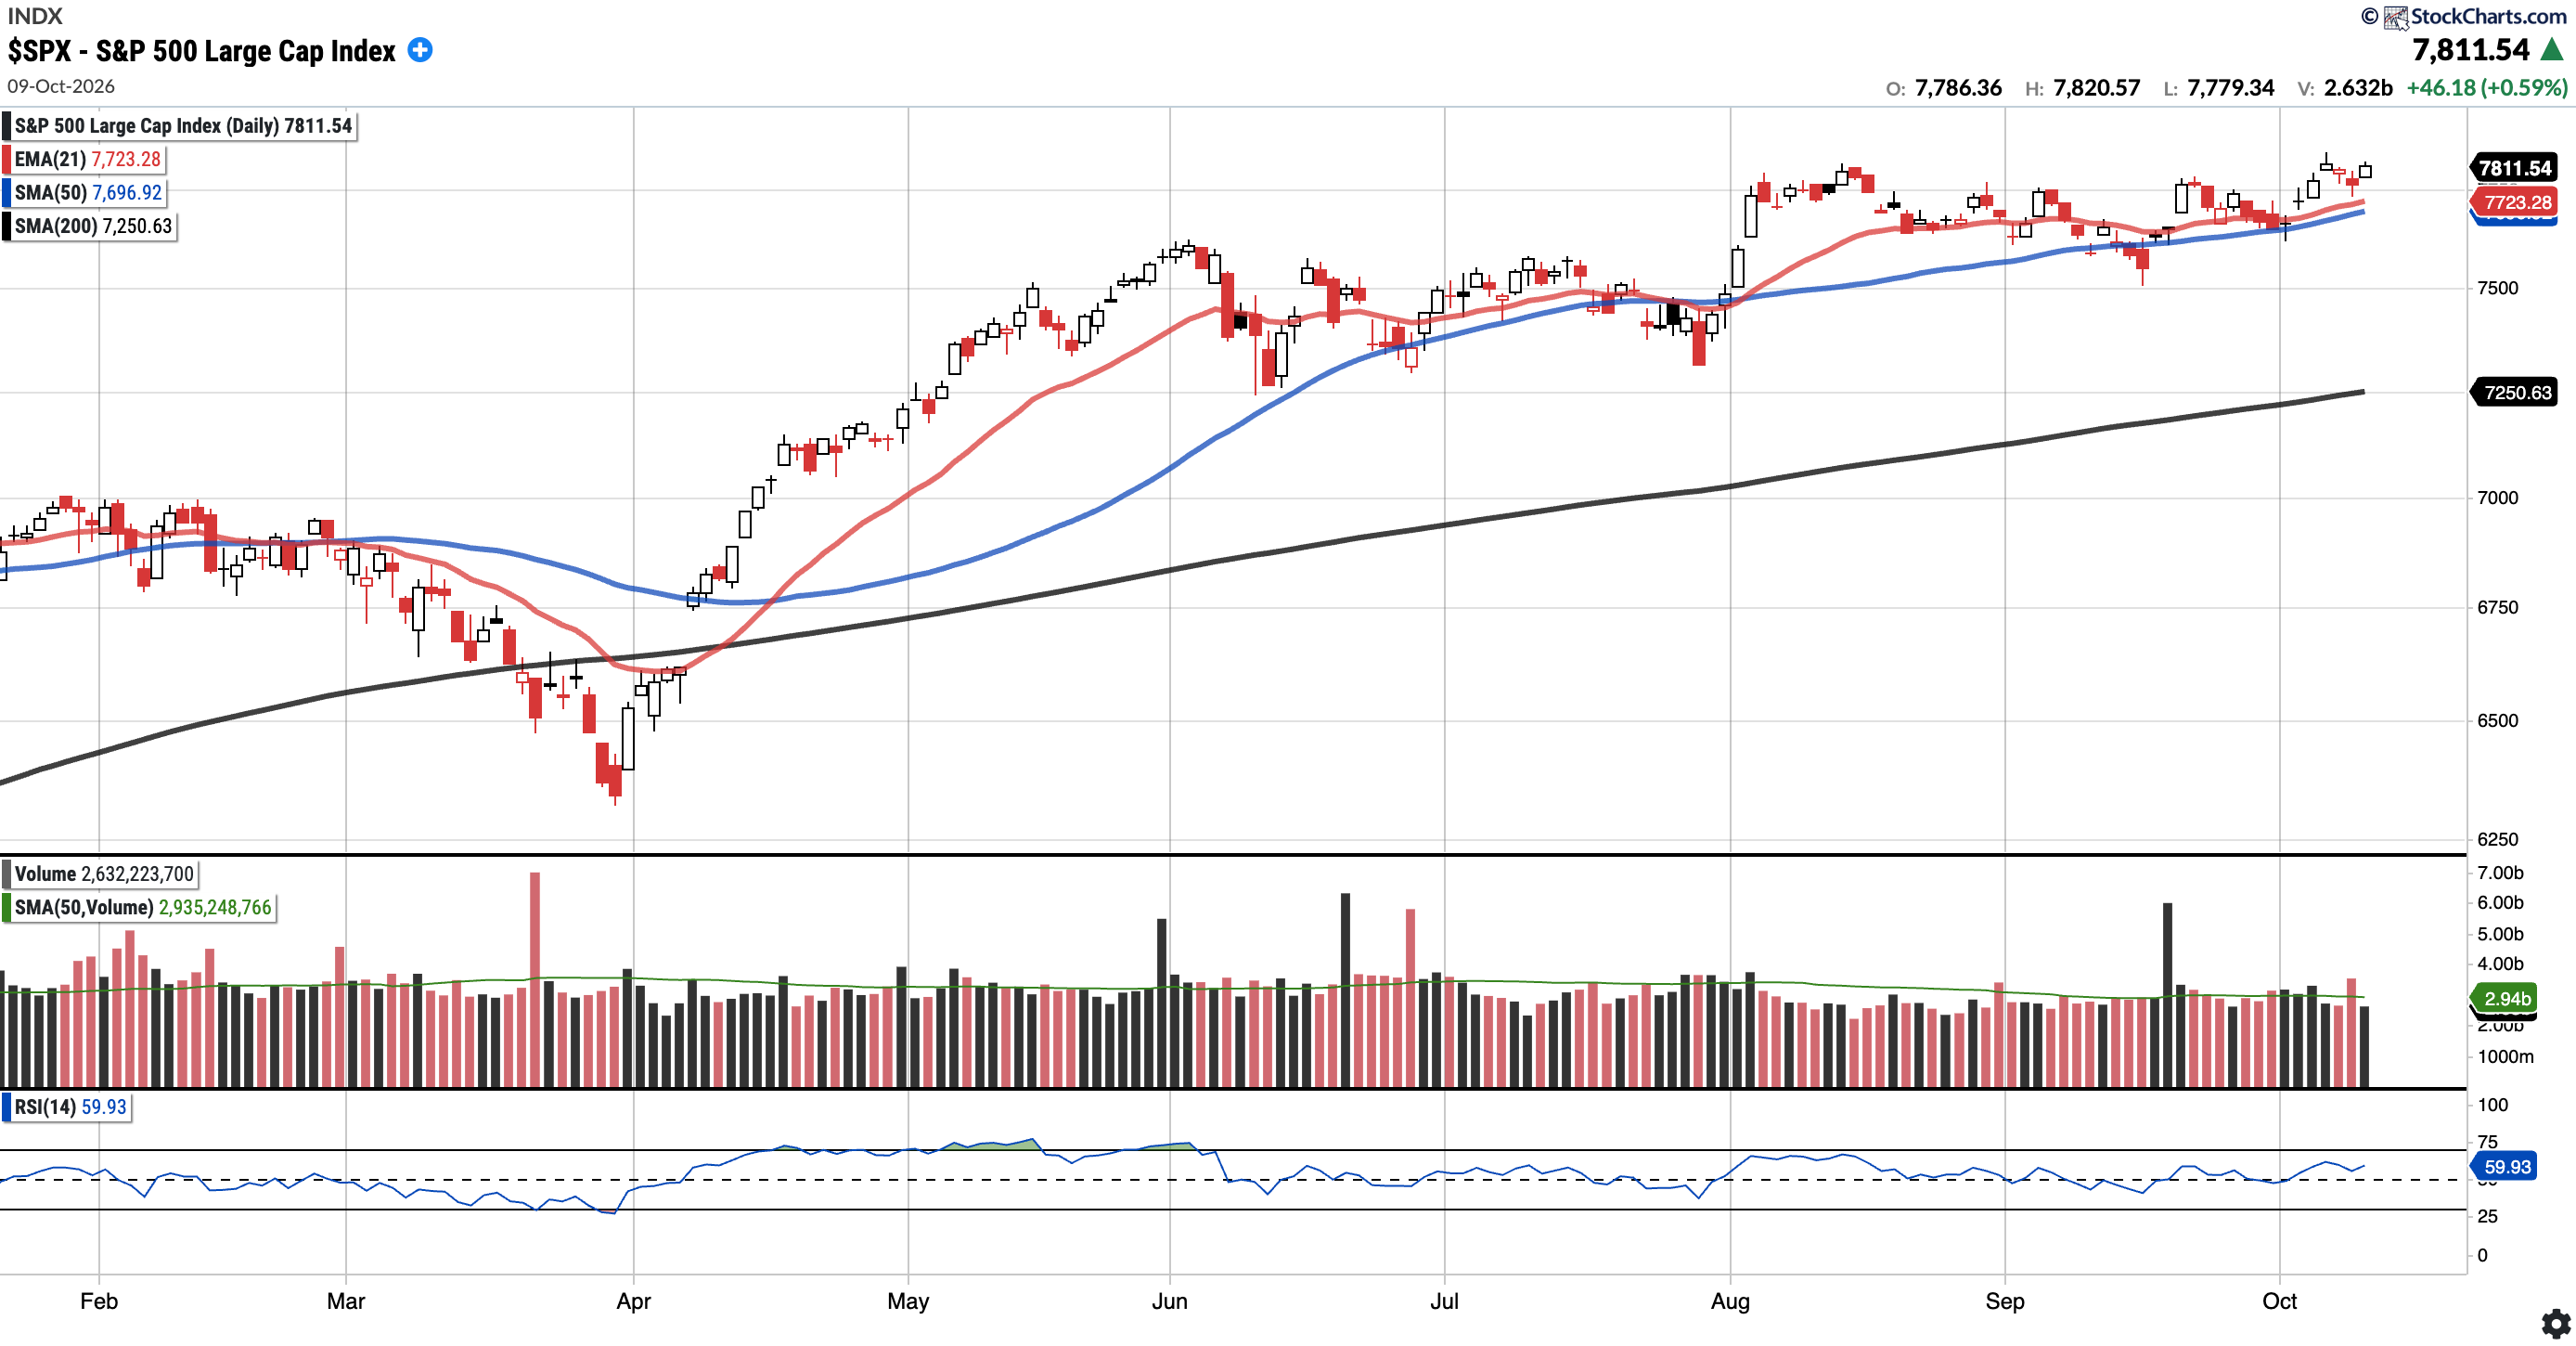
Currently trades at $7,811.54, 1.49% above the 50SMA and 7.74% above the 200SMA.
RSI 59.93
13.90% YTD
Distribution days in the last week: 1
The S&P 500 built on last week’s 50-day SMA test, pushing to new all-time highs early in the week. A shallow mid-week pullback held well above the 21EMA, and price closed the week above all of its key moving averages.
COMPQ
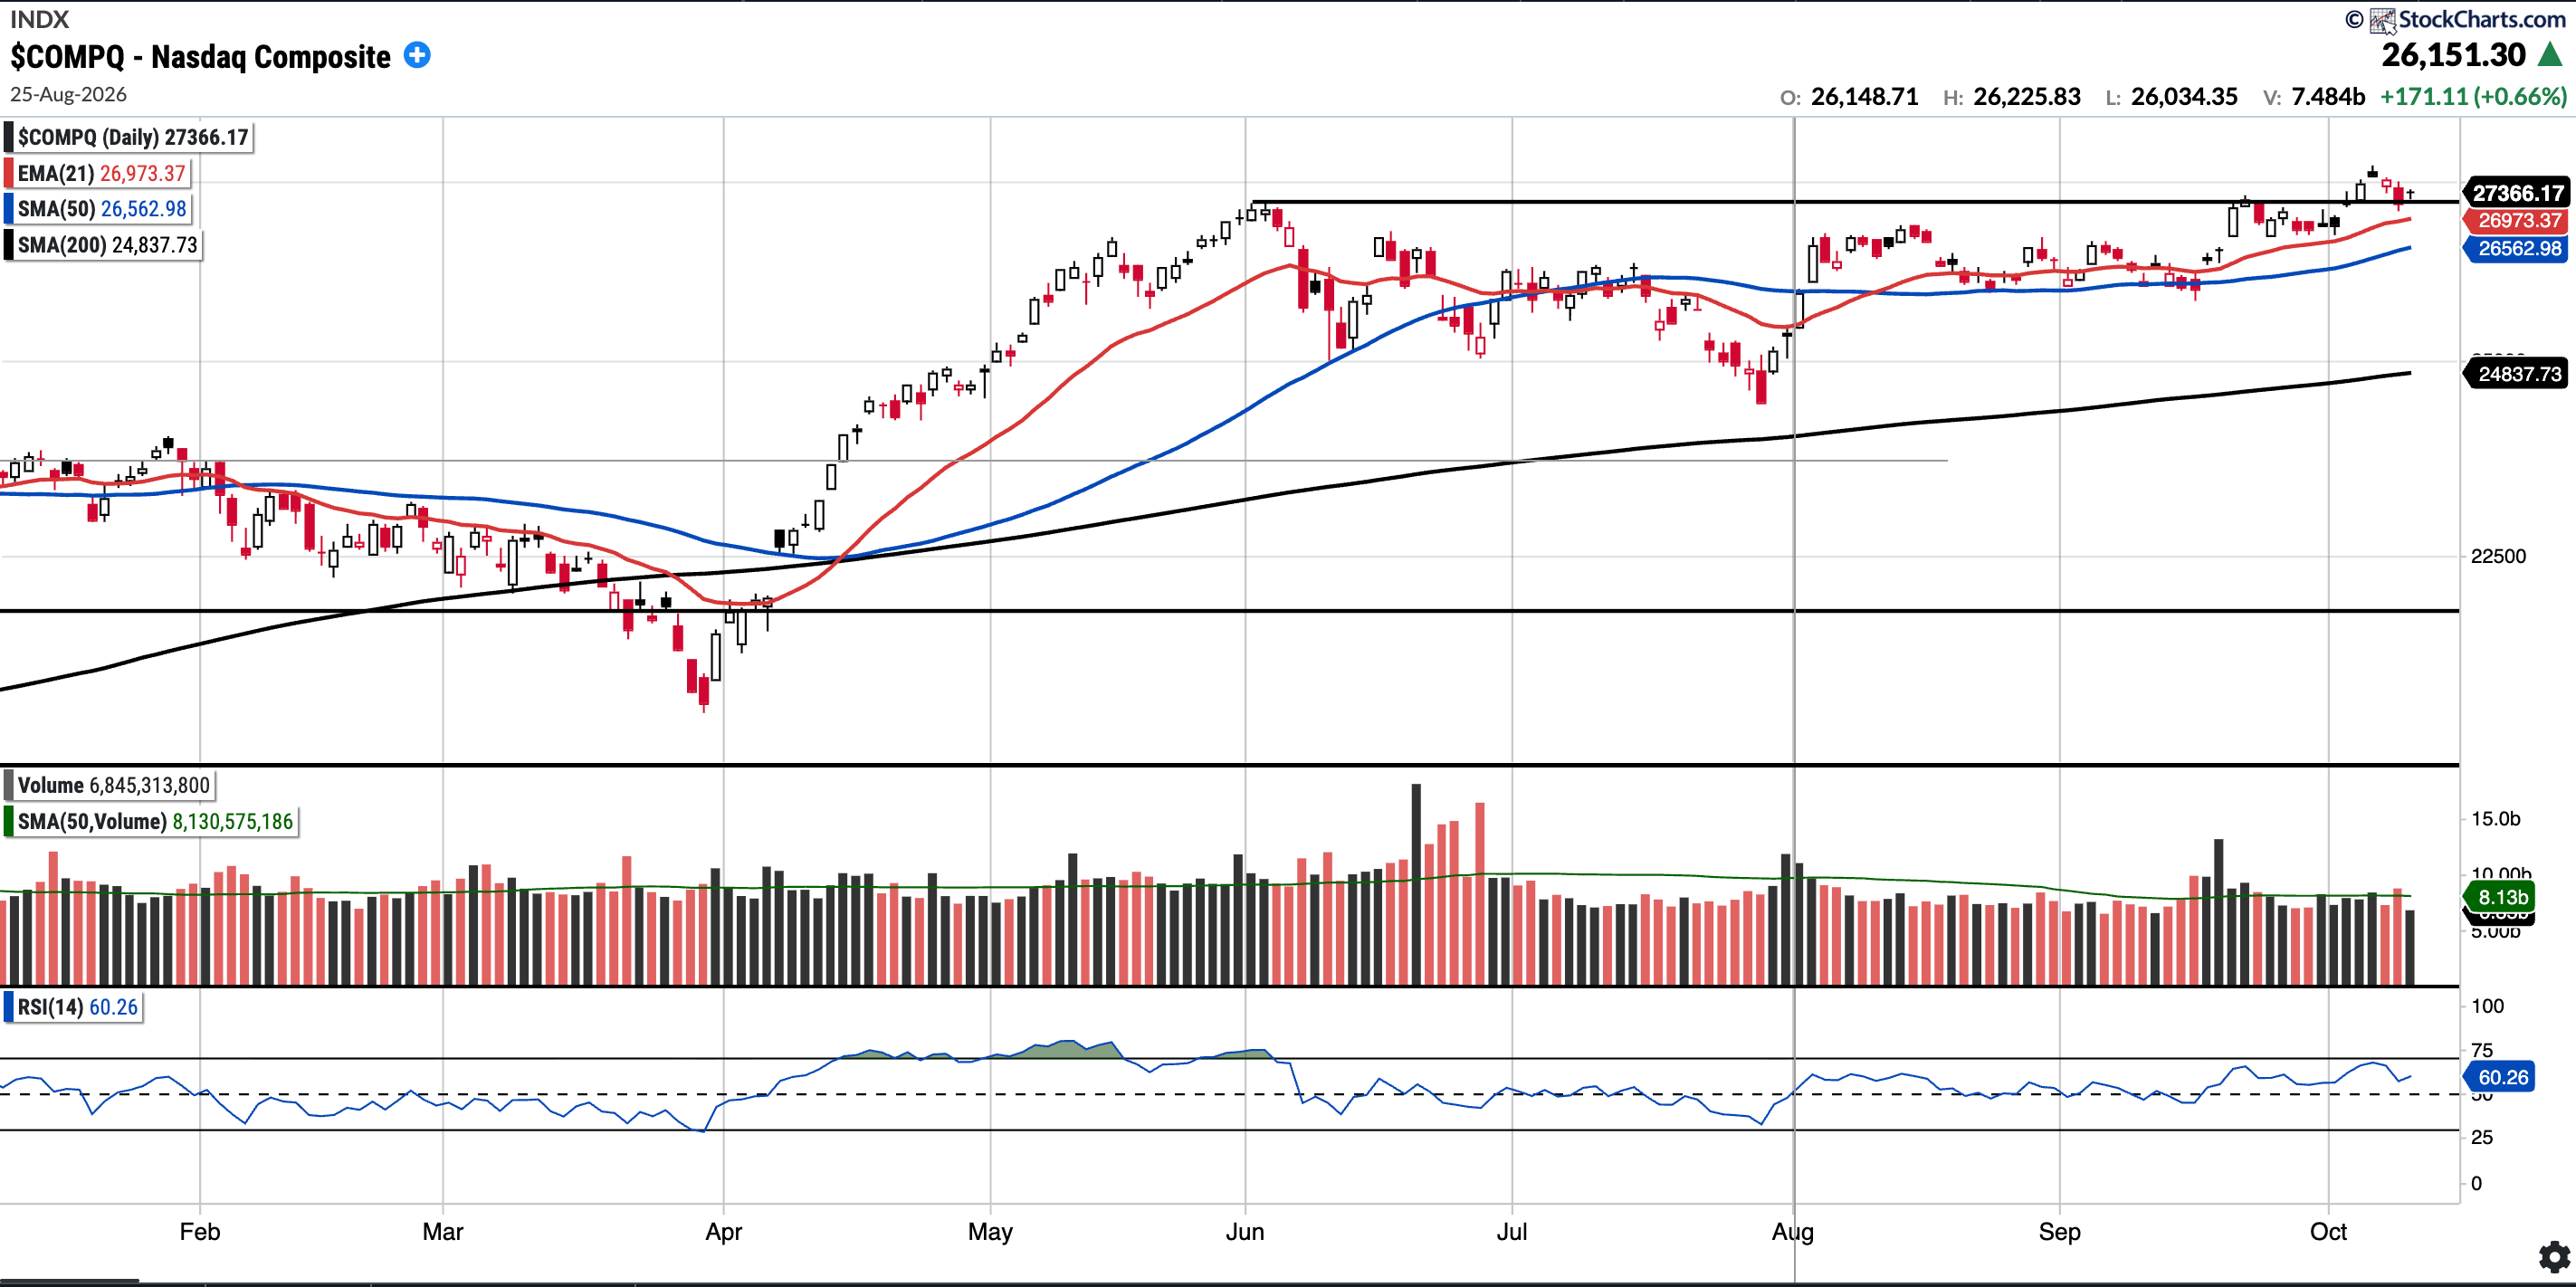
Currently trades at $27,366.17, 3.02% above the 50SMA and 10.18% above the 200SMA.
RSI 60.26
17.78% YTD
Distribution days in the last week: 1
The Nasdaq Composite pulled back from a fresh all-time high early in the week to retest its prior highs from June (see horizontal line). It dipped just below that level on Thursday before reclaiming it on Friday, closing the week above all of its key moving averages.
BTC (currently Long)
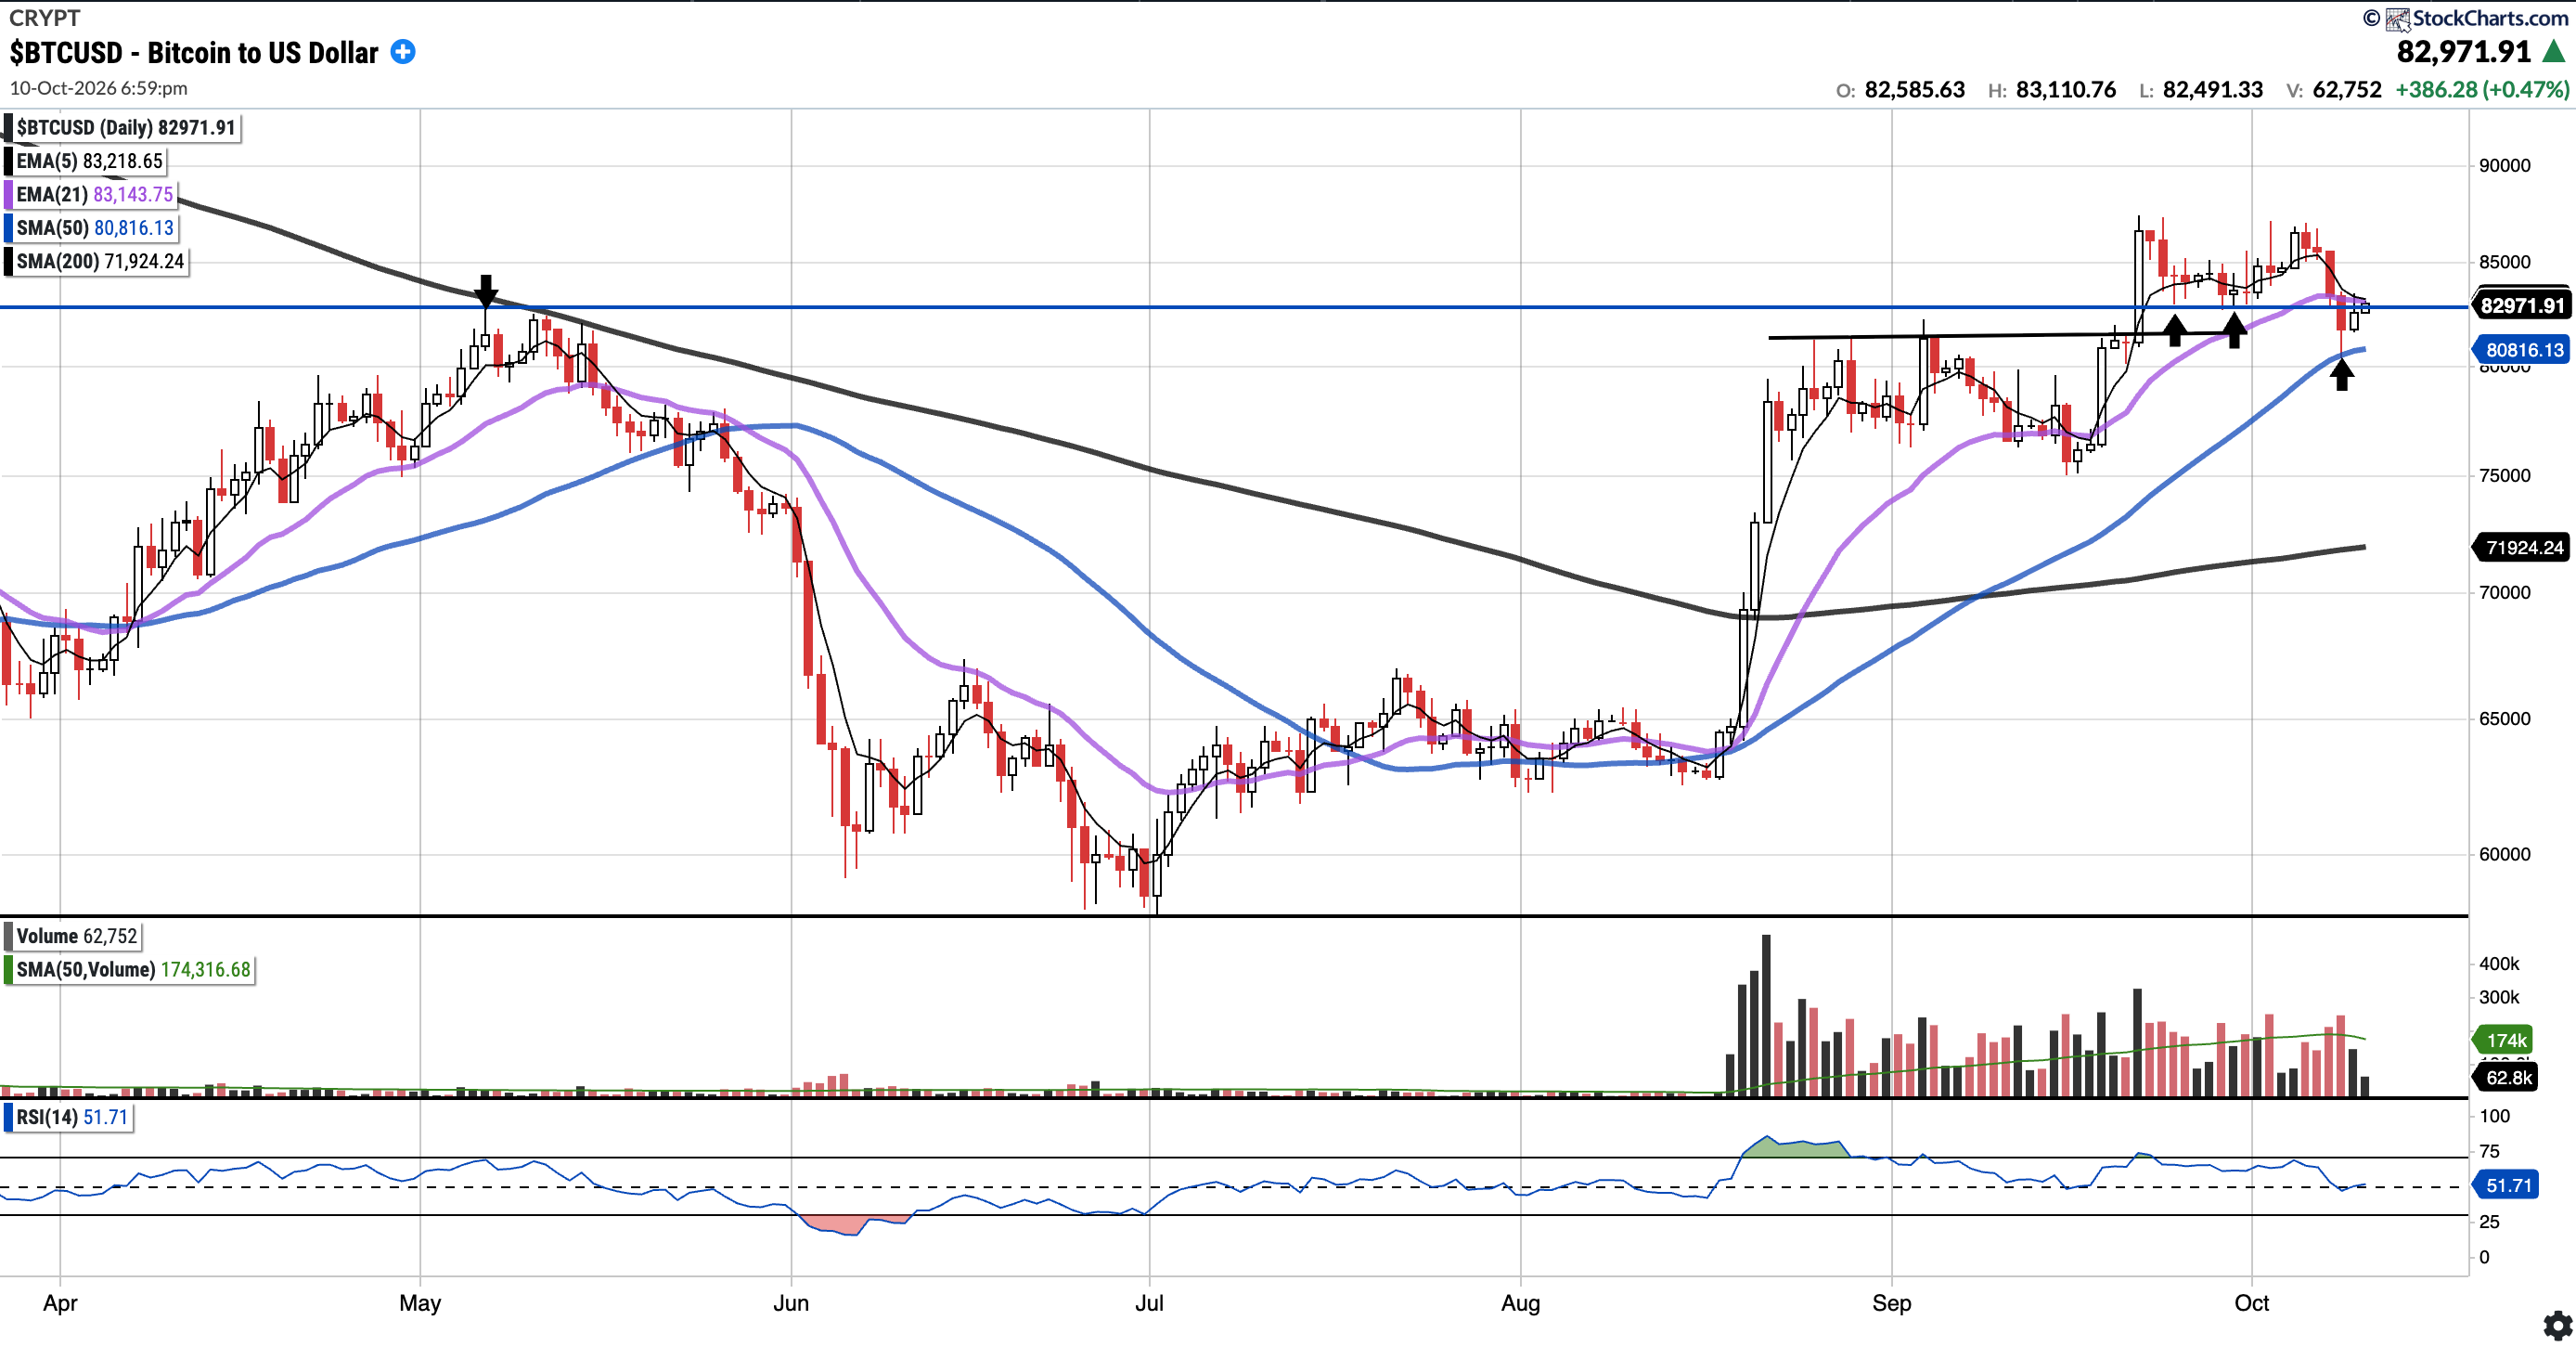
Currently trades at $83,086.80, 2.81% above the 50SMA and 15.52% above the 200SMA.
RSI 52.12
-5.20% YTD
BTC was rejected once again near the $87K–$88K level early in the week and sold off through the $81K–$83K zone, before finding support at the 50-day SMA (see bottom arrow). Price has since recovered to the $83K level (horizontal blue line), which marked the May high, but sits just below its 5 and 21 EMAs. Bulls want to see $83K reclaimed and held, with the 50-day SMA (~$80.8K) the level that needs to hold below.
EEM
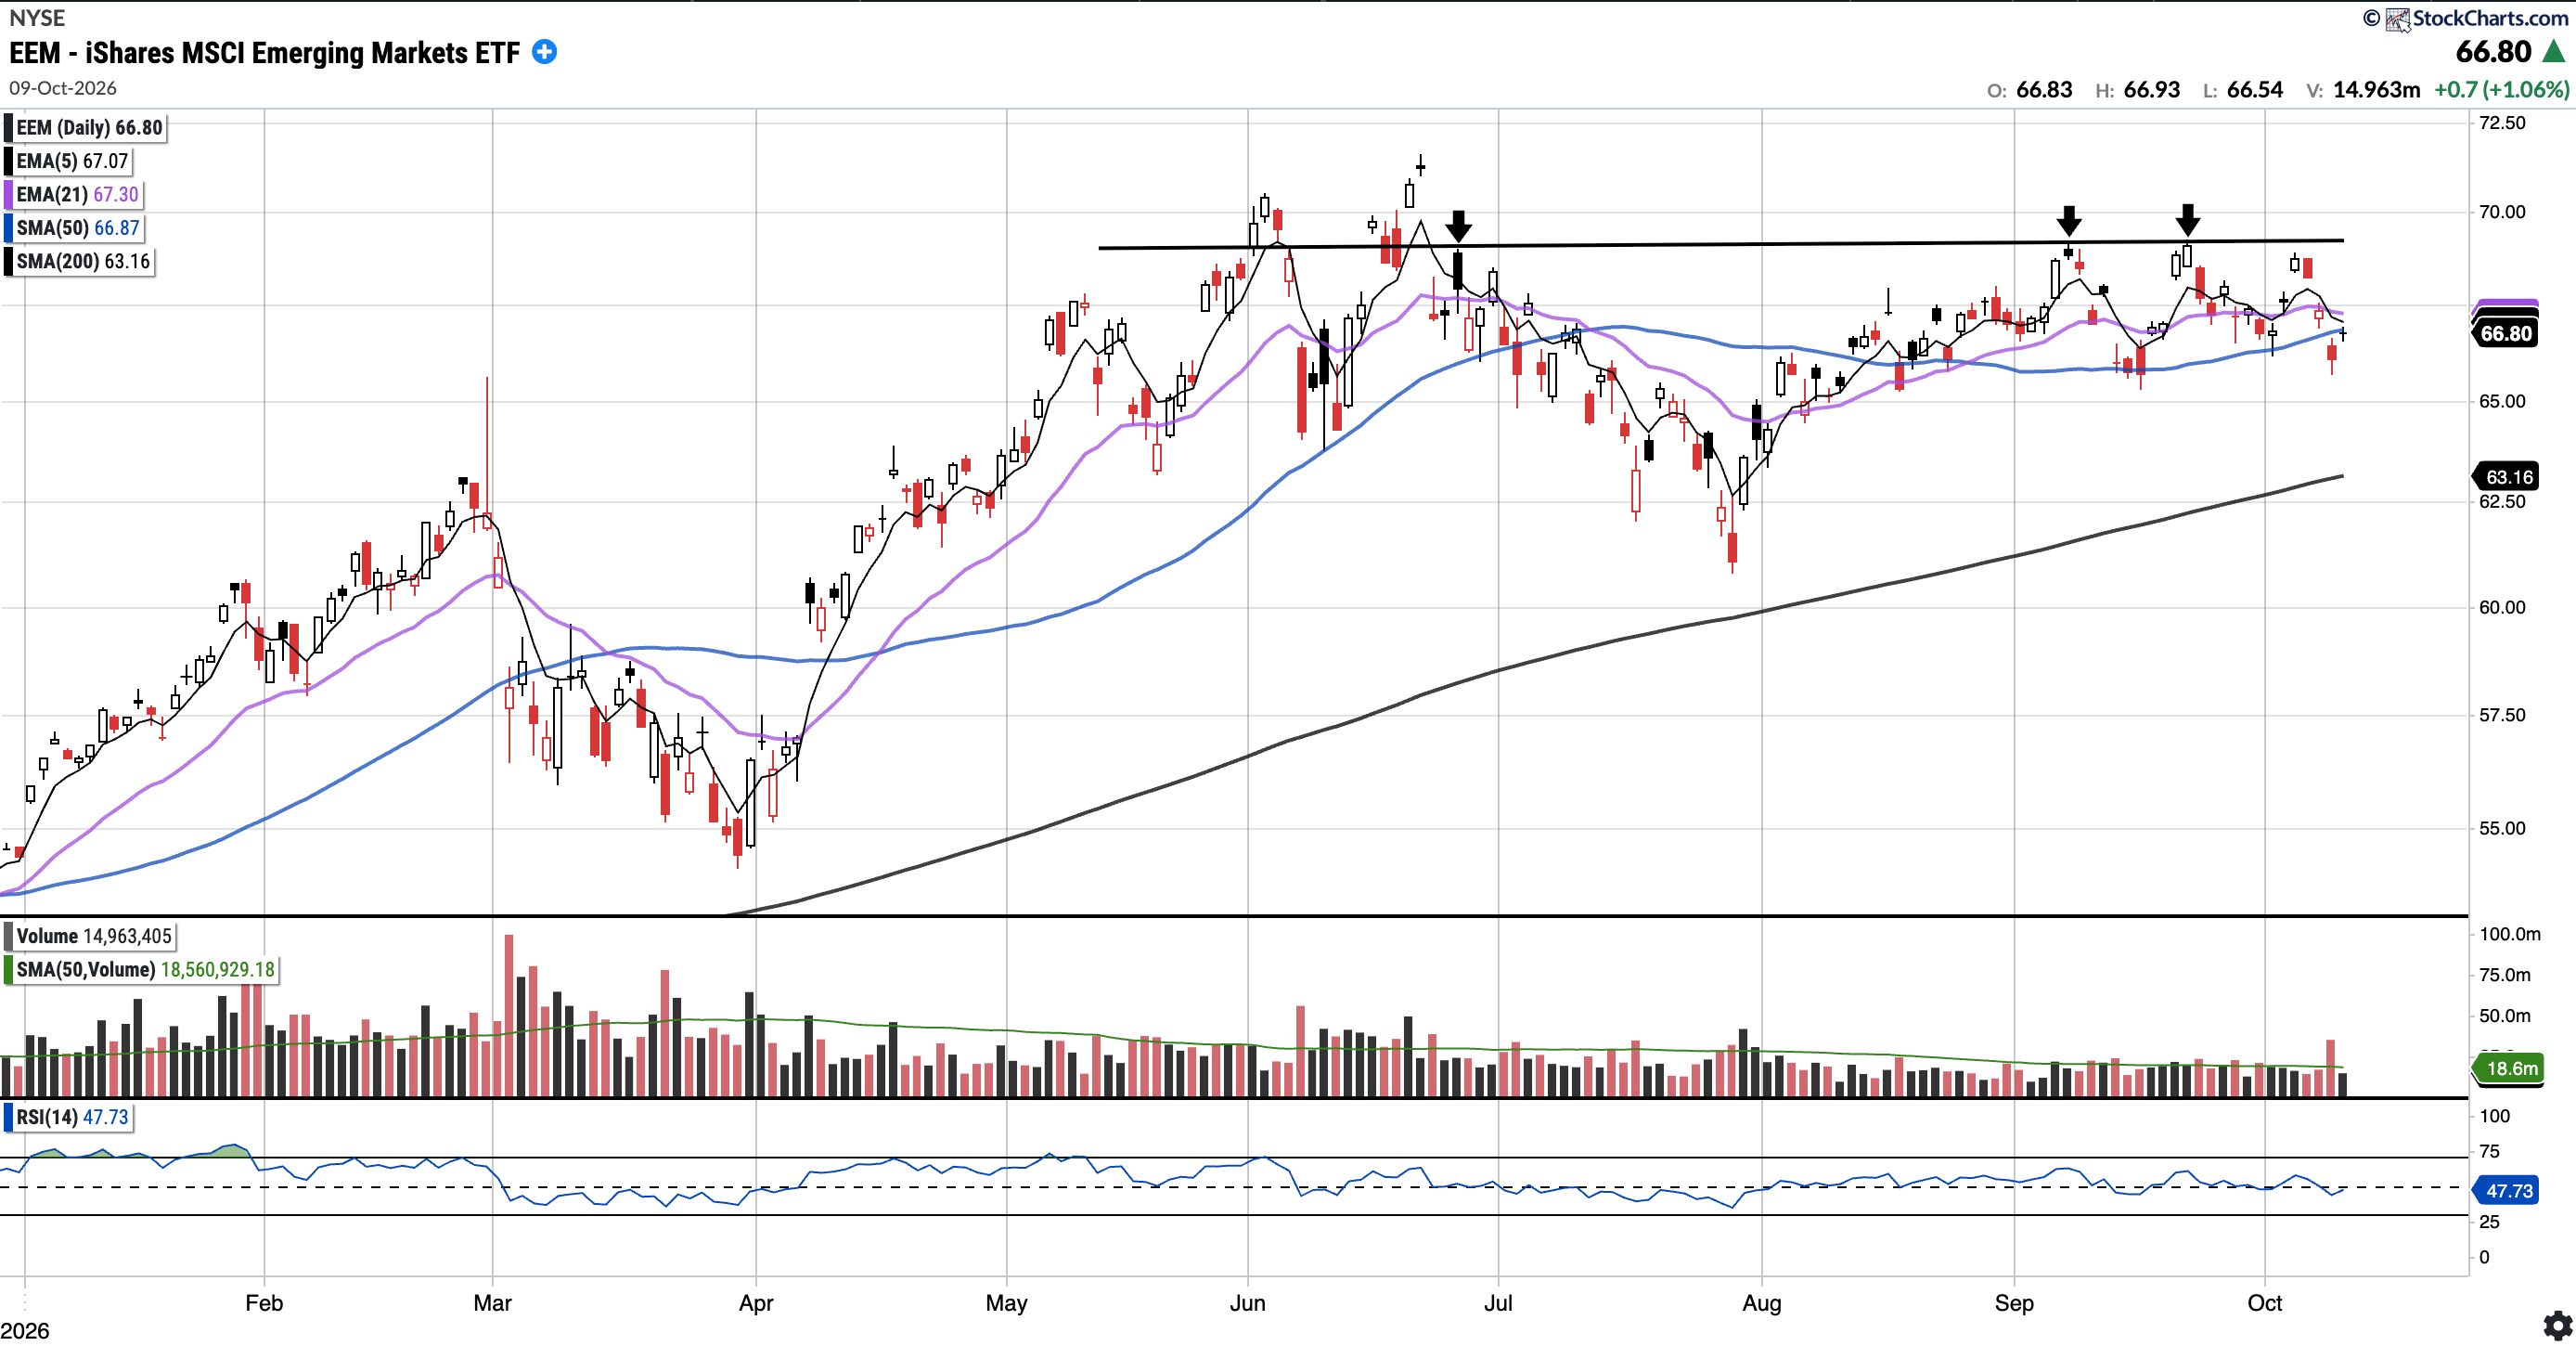
Currently trades at $66.80, 0.11% below the 50SMA and 5.76% above the 200SMA.
RSI 47.73
19.39% YTD
EEM rejected the $69 level again early in the week and fell beneath its 50 SMA on Thursday. Friday’s bounce brought price back to $66.80, just under the 50 SMA and the 21EMA. Bulls will want to see the 50 SMA reclaimed, while a decisive break above $69–70 remains the trigger for the next leg higher.
EWZ (Currently Long via IBZL)
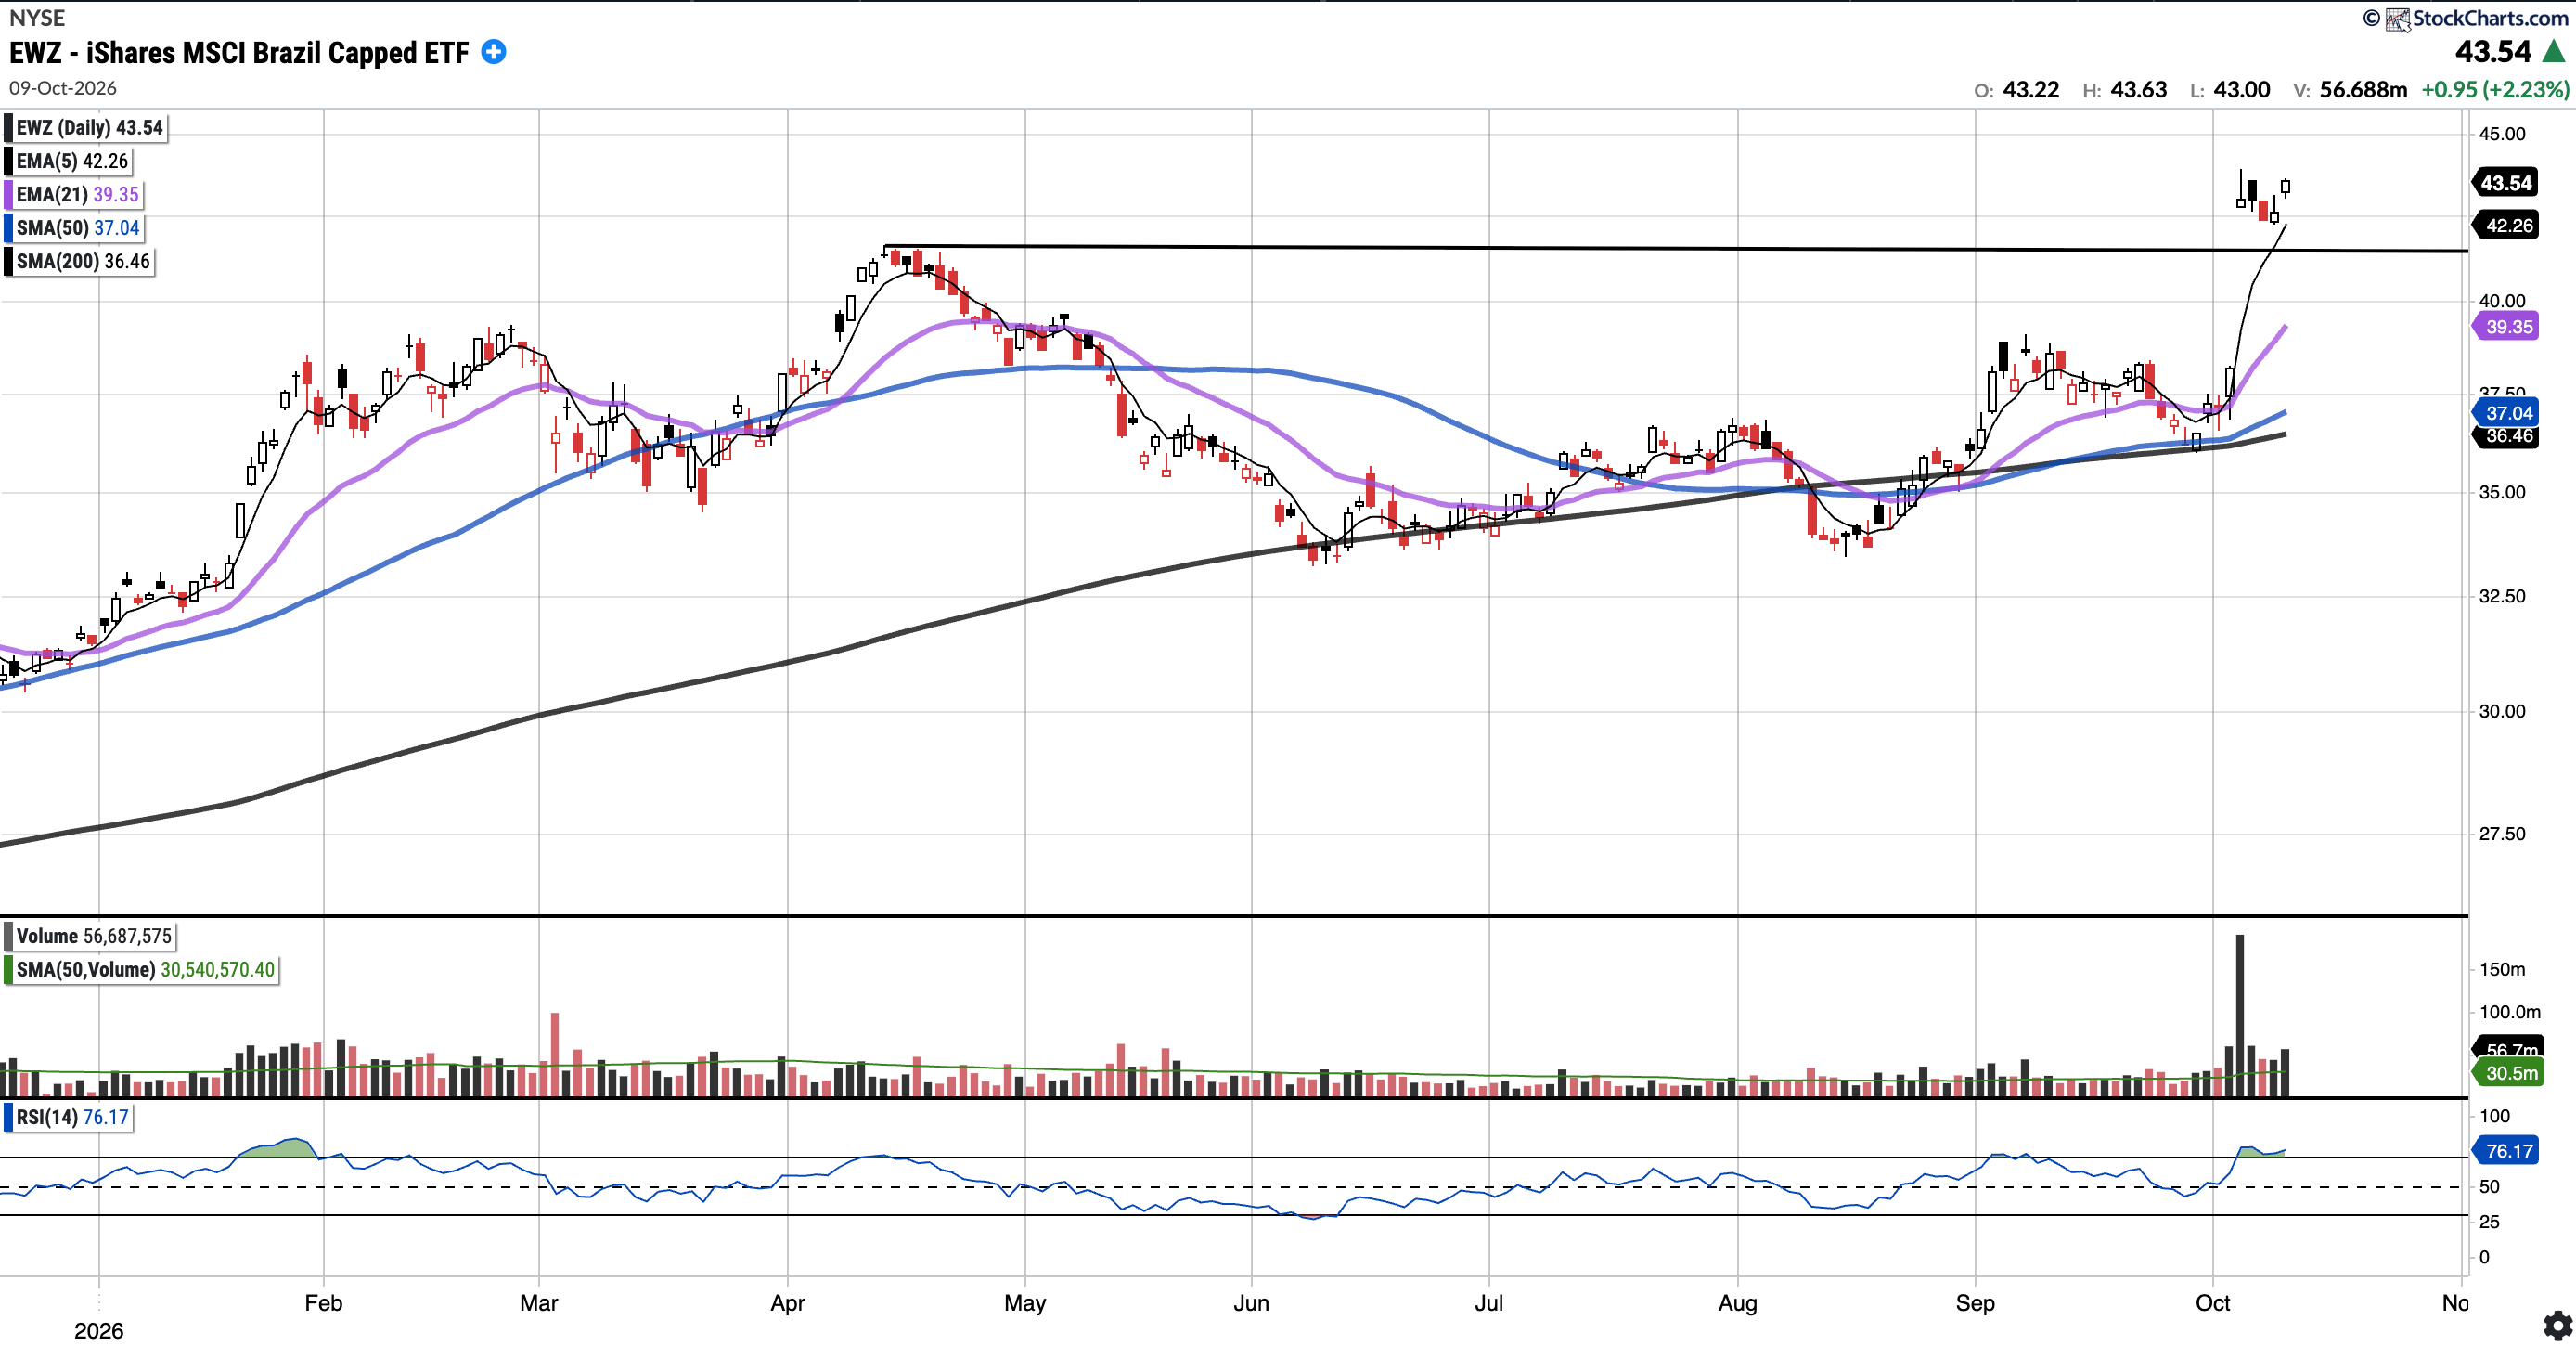
Currently trades at $43.54, 17.56% above the 50SMA and 19.41% above the 200SMA.
RSI 76.17
36.50% YTD
EWZ gapped up >15% on Monday 5th in response to the results of the first round of the Brazilian presidential election. This fuelled optimism about a potential shift in economic policy, and hence, Brazilian equities are rallying. The gap took price well clear of the April highs (see horizontal line) and all of its key moving averages.
We are already positioned from much lower, but a potential entry/add level could be on a retest to the 21-EMA or 50-SMA.
GOLD (Long Physical)
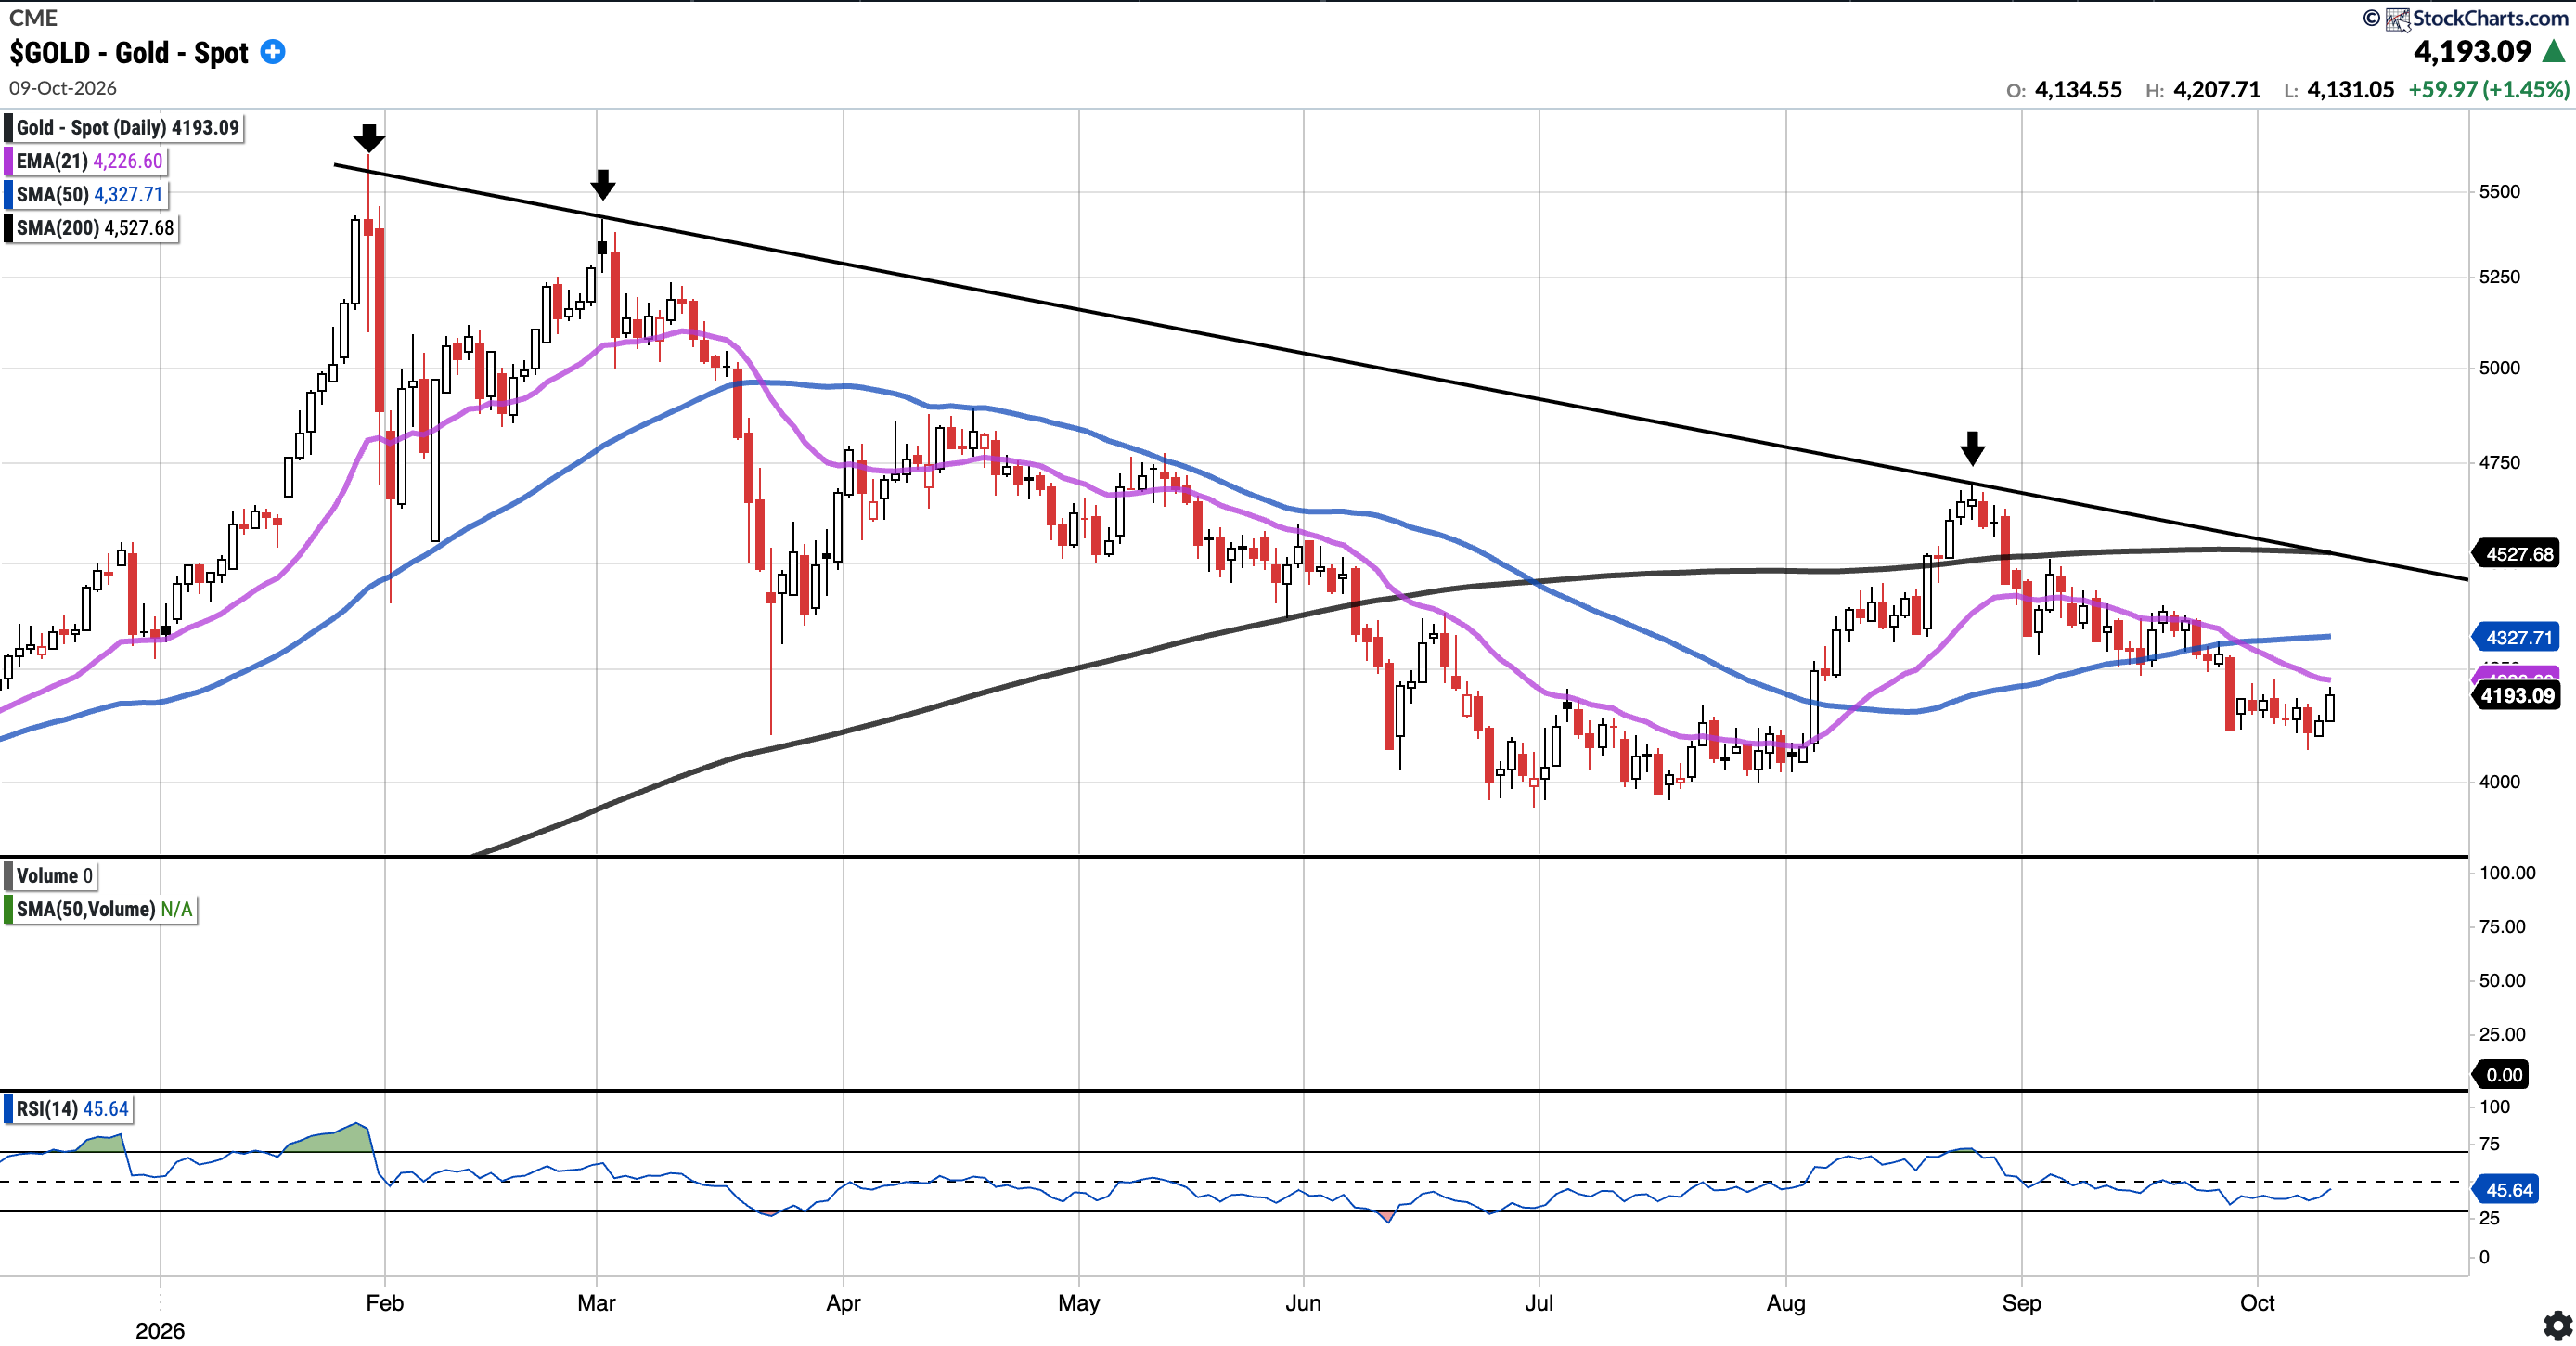
Currently trades at $4,193.09, 3.11% below the 50SMA and 7.39% below the 200SMA.
RSI 45.64
-3.00% YTD
Gold slipped back into the $4,100–$4,150 support zone this week, where buyers stepped in again, with Friday’s 1.45% bounce taking price back to $4,193. Price remains below both its 21-day EMA ($4,227) and 50-day SMA ($4,328), with the 200-day SMA overhead at $4,528.
Bulls need to reclaim the 21-day EMA and 50-day SMA first, followed by the 200-day SMA and the January descending trendline as major resistance.
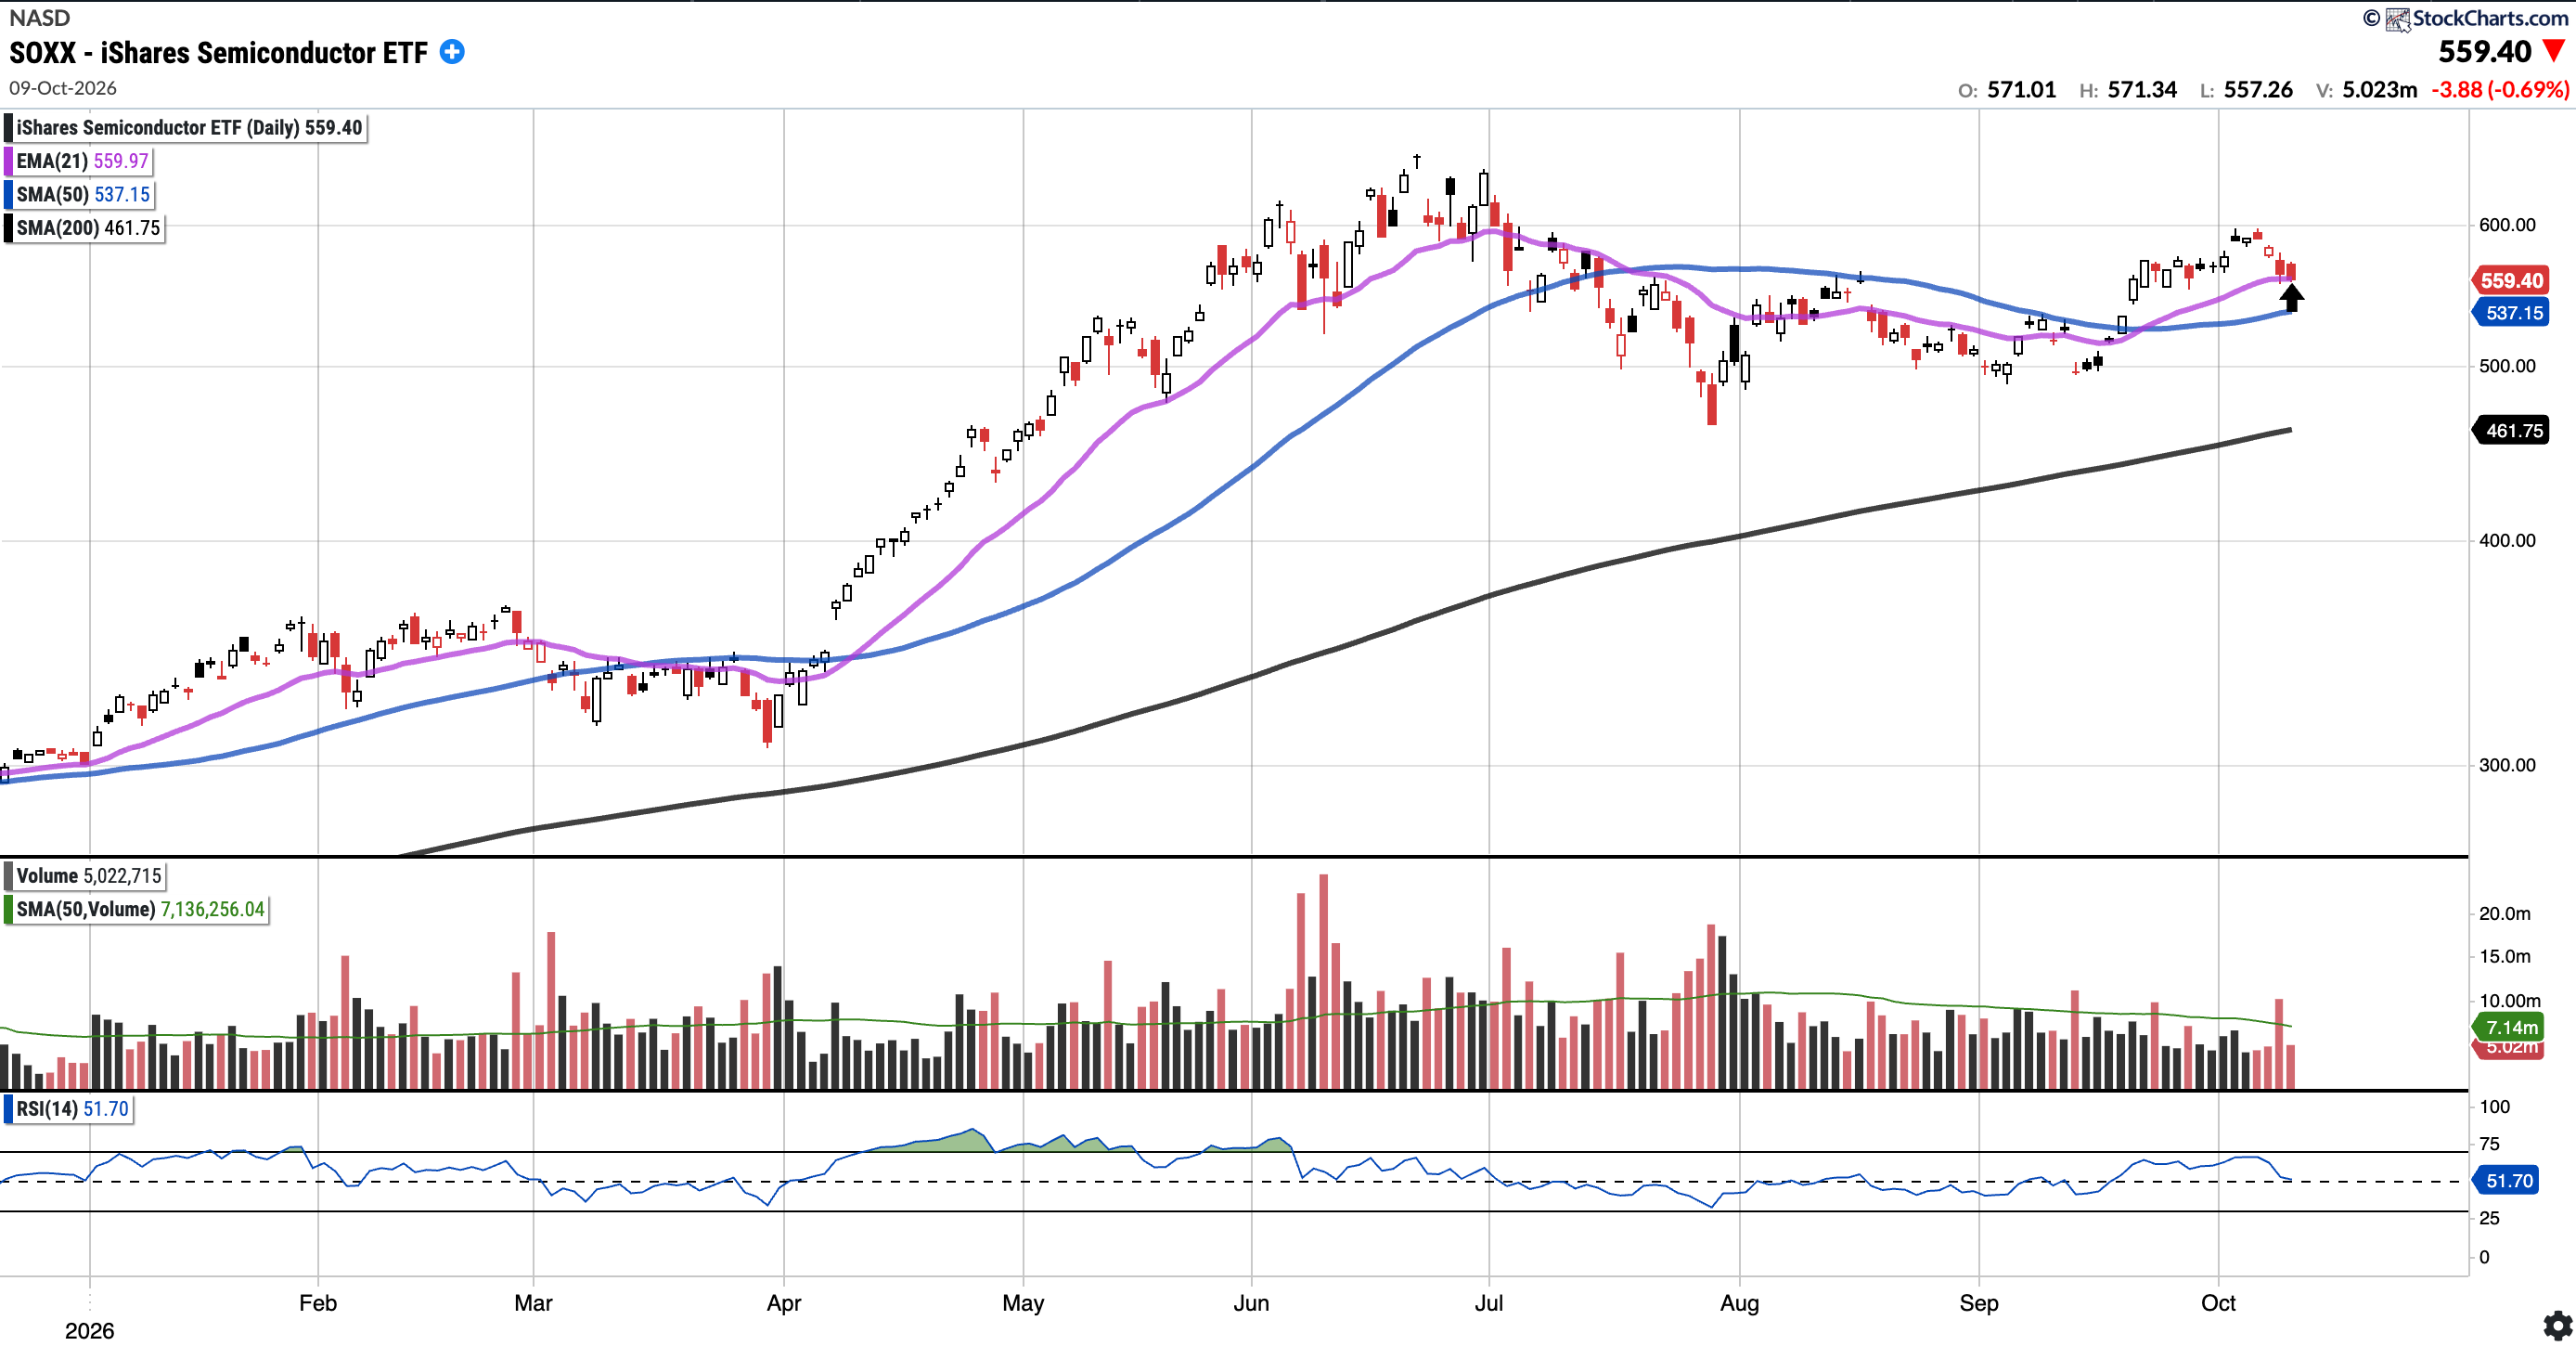
SOXX
Currently trades at $559.40, 4.14% above the 50SMA and 21.15% above the 200SMA.
RSI 51.70
78.64% YTD
SOXX was unable to breakout of the $600 mark and gave back around 5% this week, pulling back to test its 21EMA ($559.97) (see arrow). Price remains comfortably above the 50-day SMA ($537.15) and 200-day SMA. Bulls want to see the 21EMA hold as support for another attempt at $600 toward the highs of ~$650.
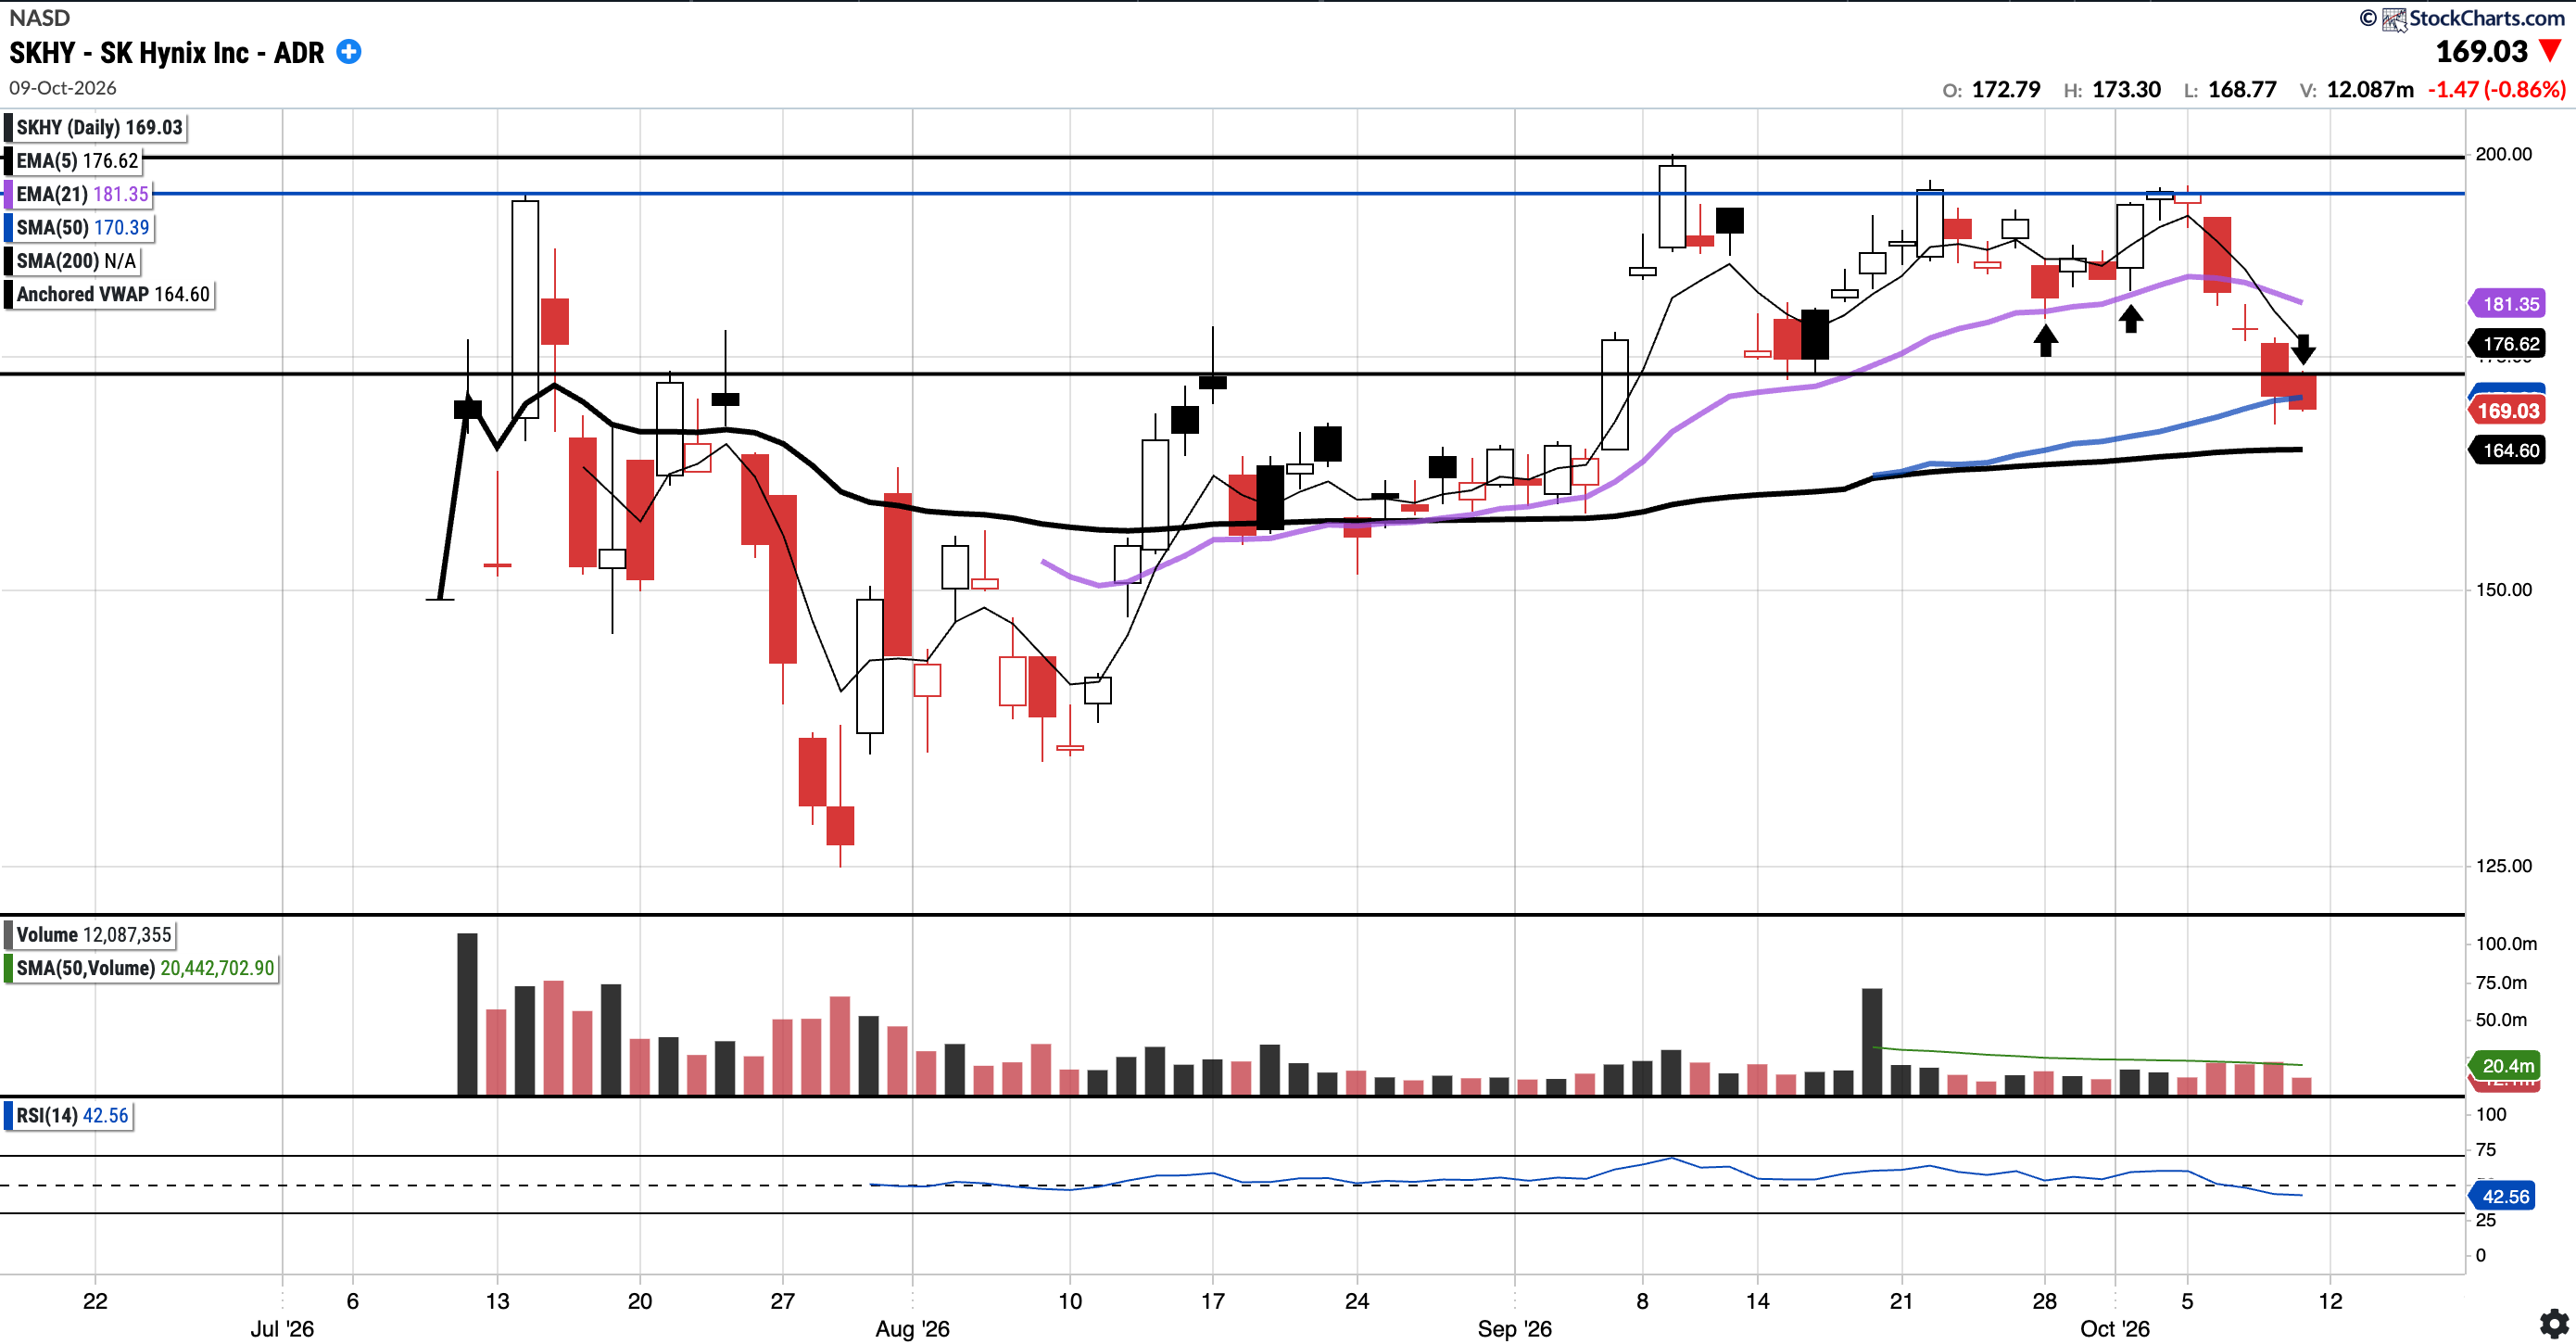
SKHY (Currently Long)
Currently trades at $169.03, 0.80% below the 50SMA.
RSI 42.56
0.61% YTD
SKHY fell below all of its key moving averages this week losing the EMA 21 and SMA 50. The IPO AVWAP now becomes the next level of interest below (black line). Bulls would want to see that hold, and the 50-day SMA flipped back to support.
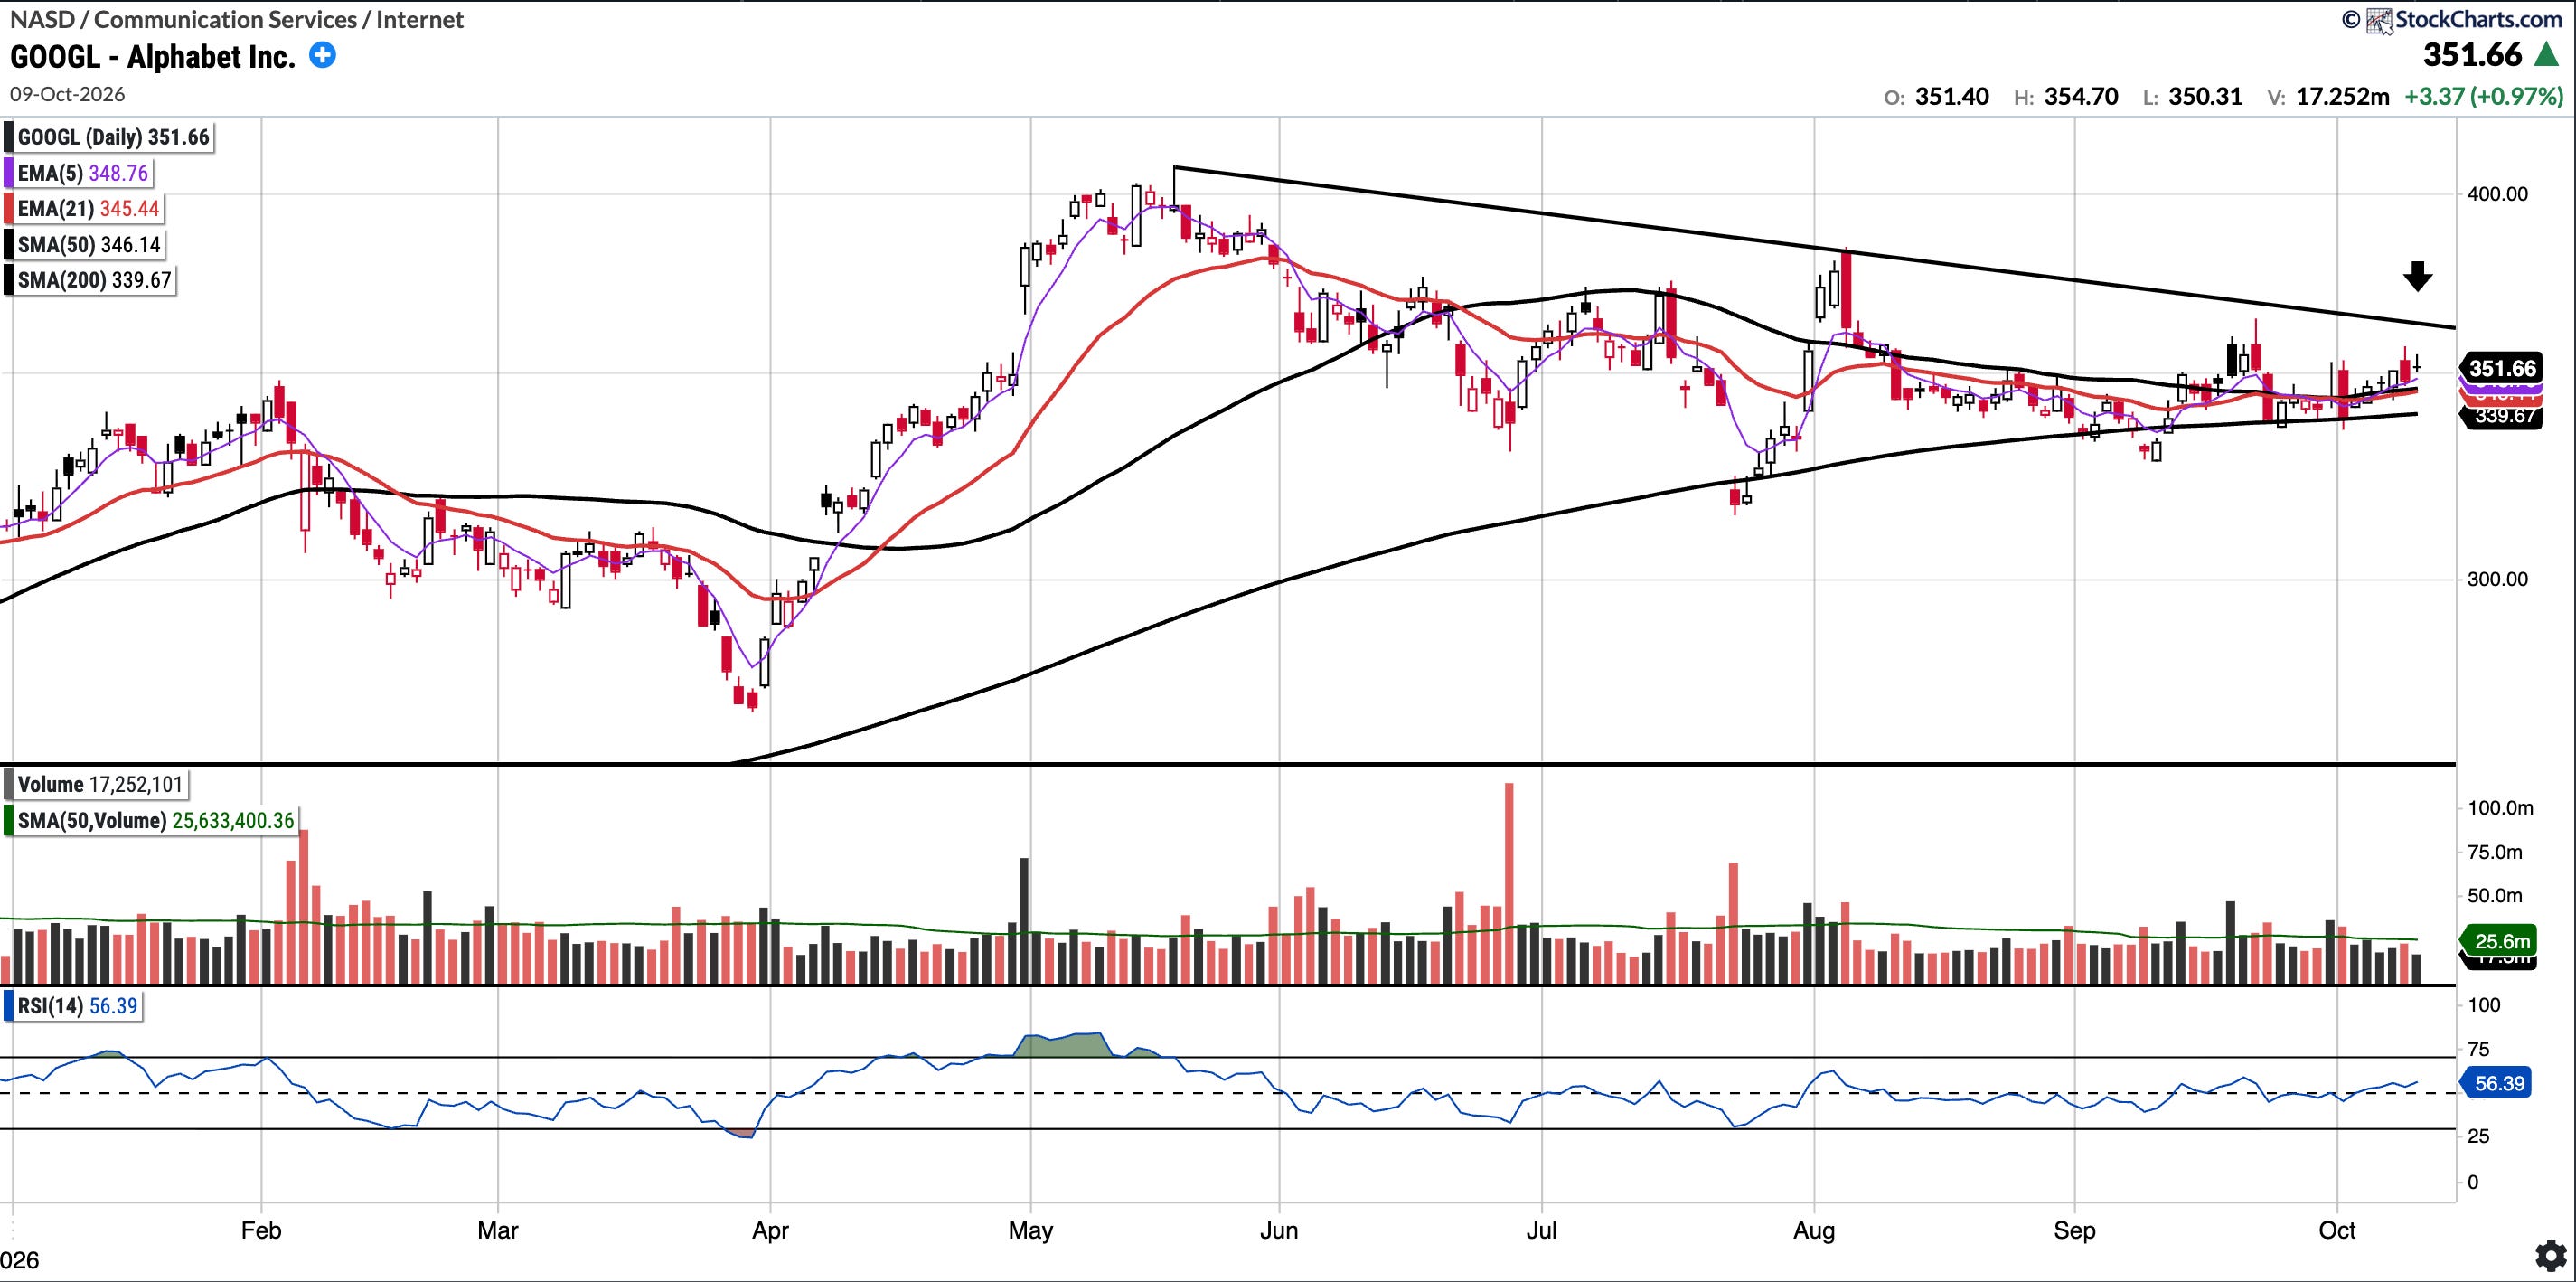
GOOGL (Currently Long)
Currently trades at $351.66, 1.60% above the 50SMA and 3.53% above the 200SMA.
RSI 56.39
11.80% YTD
GOOGL reclaimed the 50-day SMA this week, as flagged last week, and is now trading above all of its key moving averages. The 5EMA has also crossed above the 21EMA, which is generally bullish. Above, bulls would like to see a breakout above the descending trendline from the May high (see arrow), which could open the door to a rally into all time highs past $400–$410.
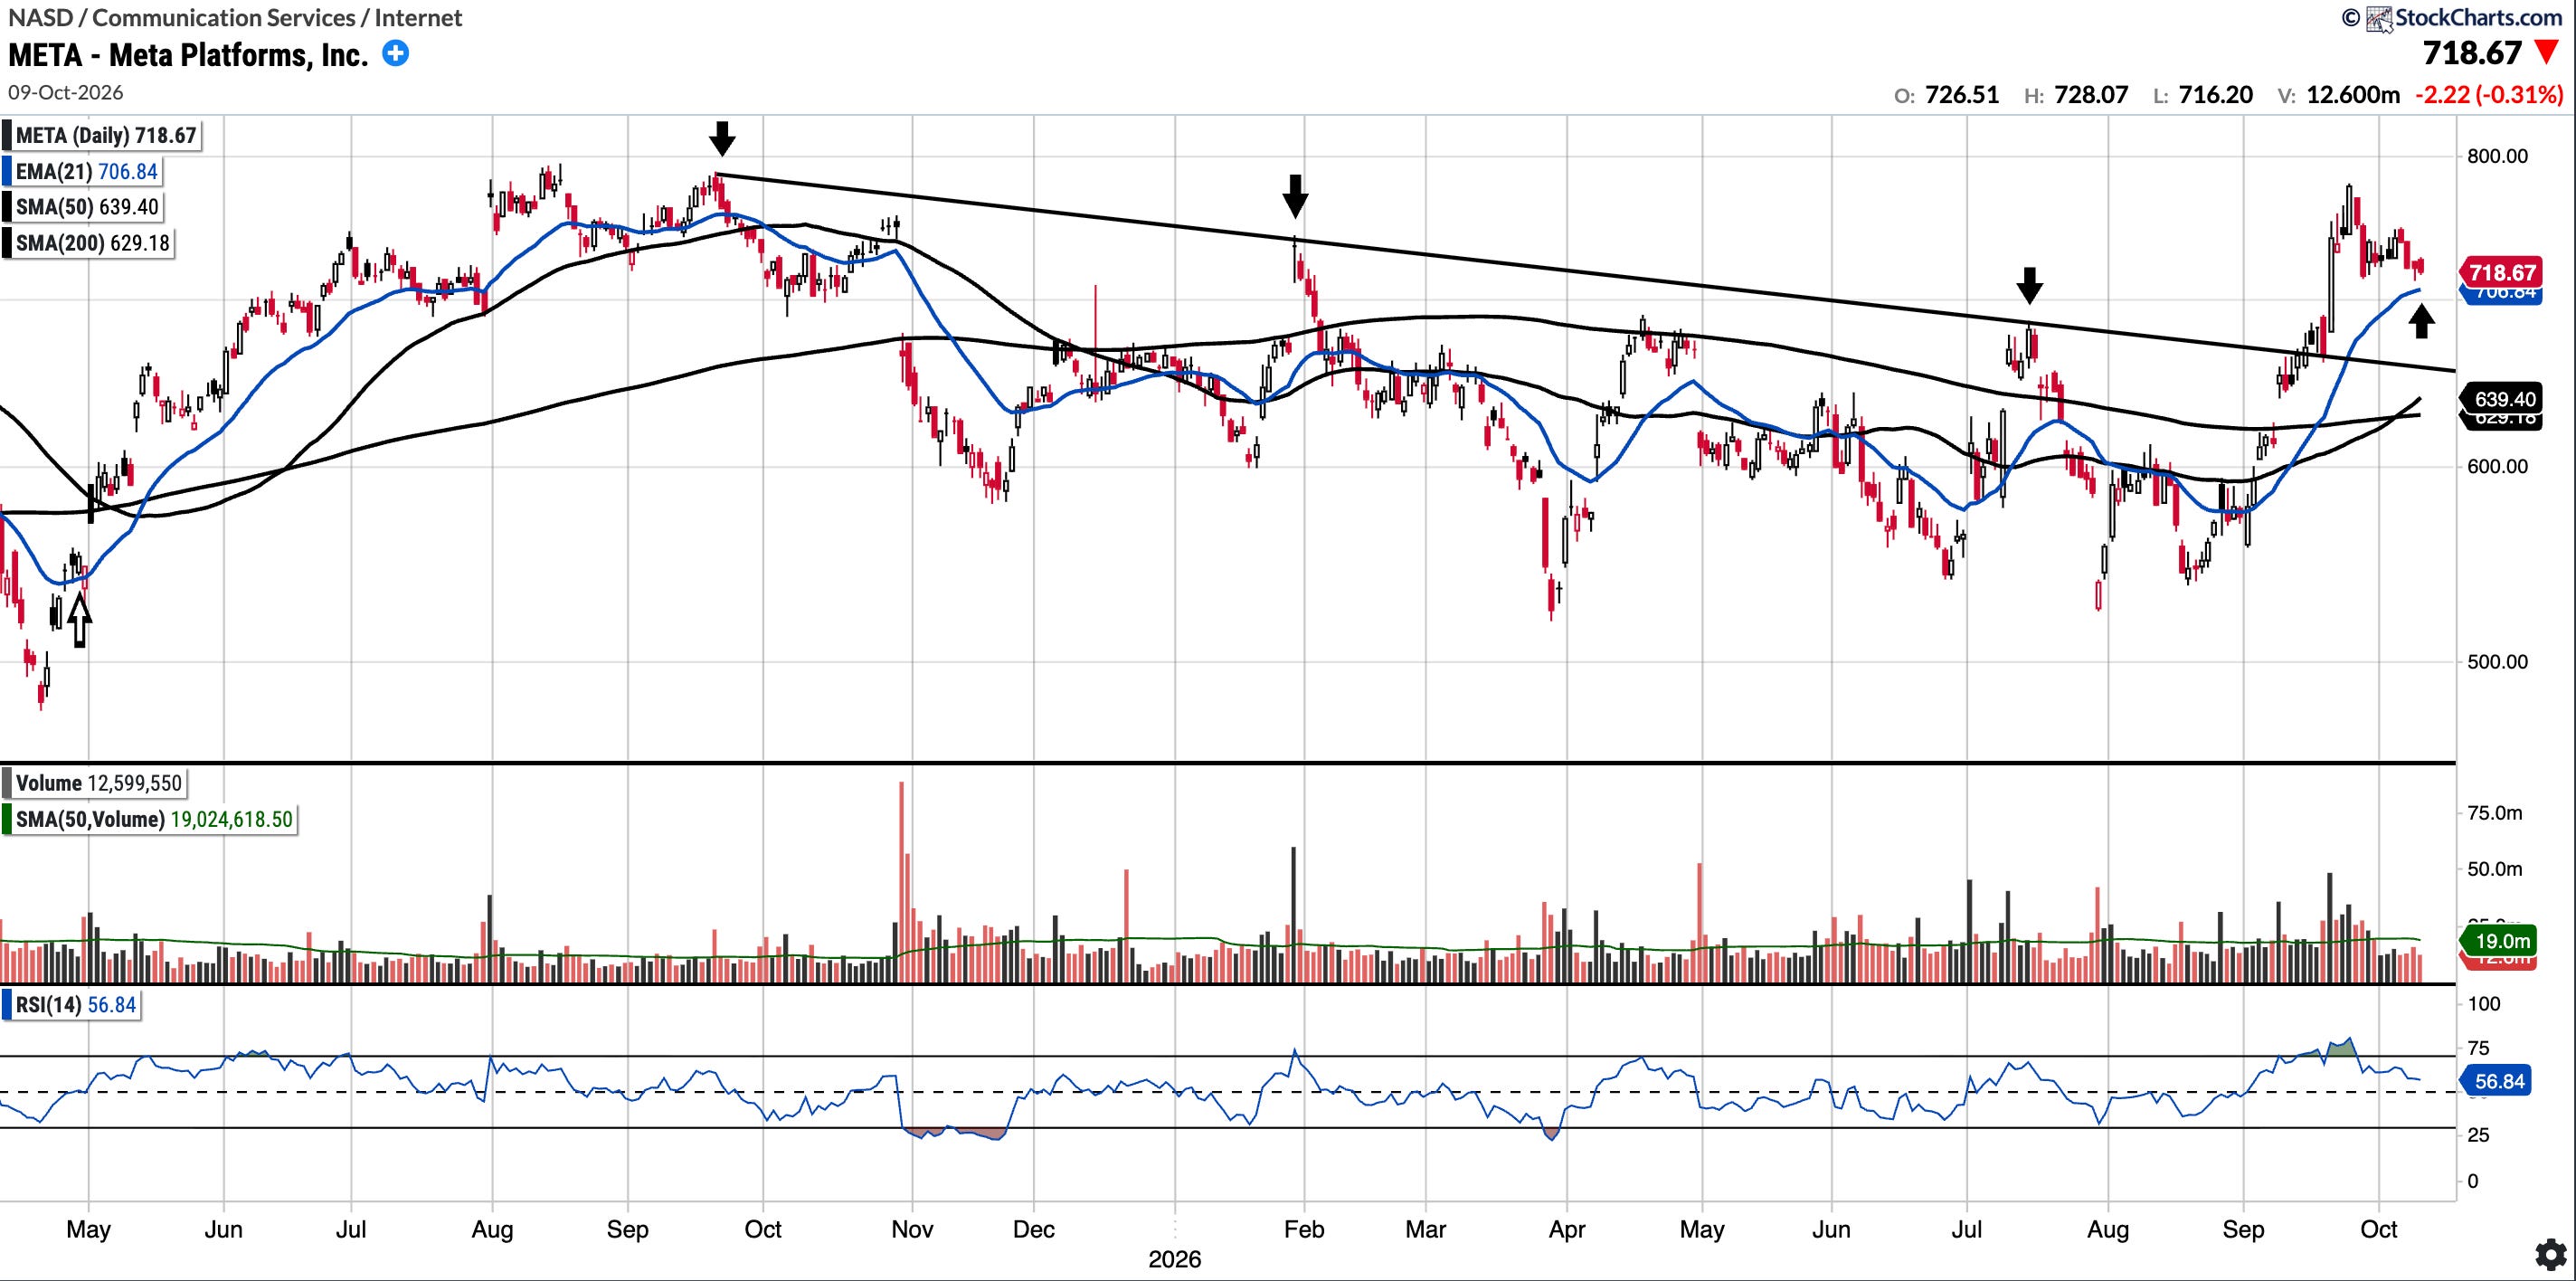
META (Currently Long)
Currently trades at $718.67, 12.40% above the 50SMA and 14.22% above the 200SMA.
RSI 56.84
10.78% YTD
META continued to pull back this week, and is now approaching its 21EMA ($706.84) (see arrow), while holding just above the $710–$715 level flagged last week. Below that, we are watching the descending trendline it broke above in September, for a re-test. That level is now around $660.
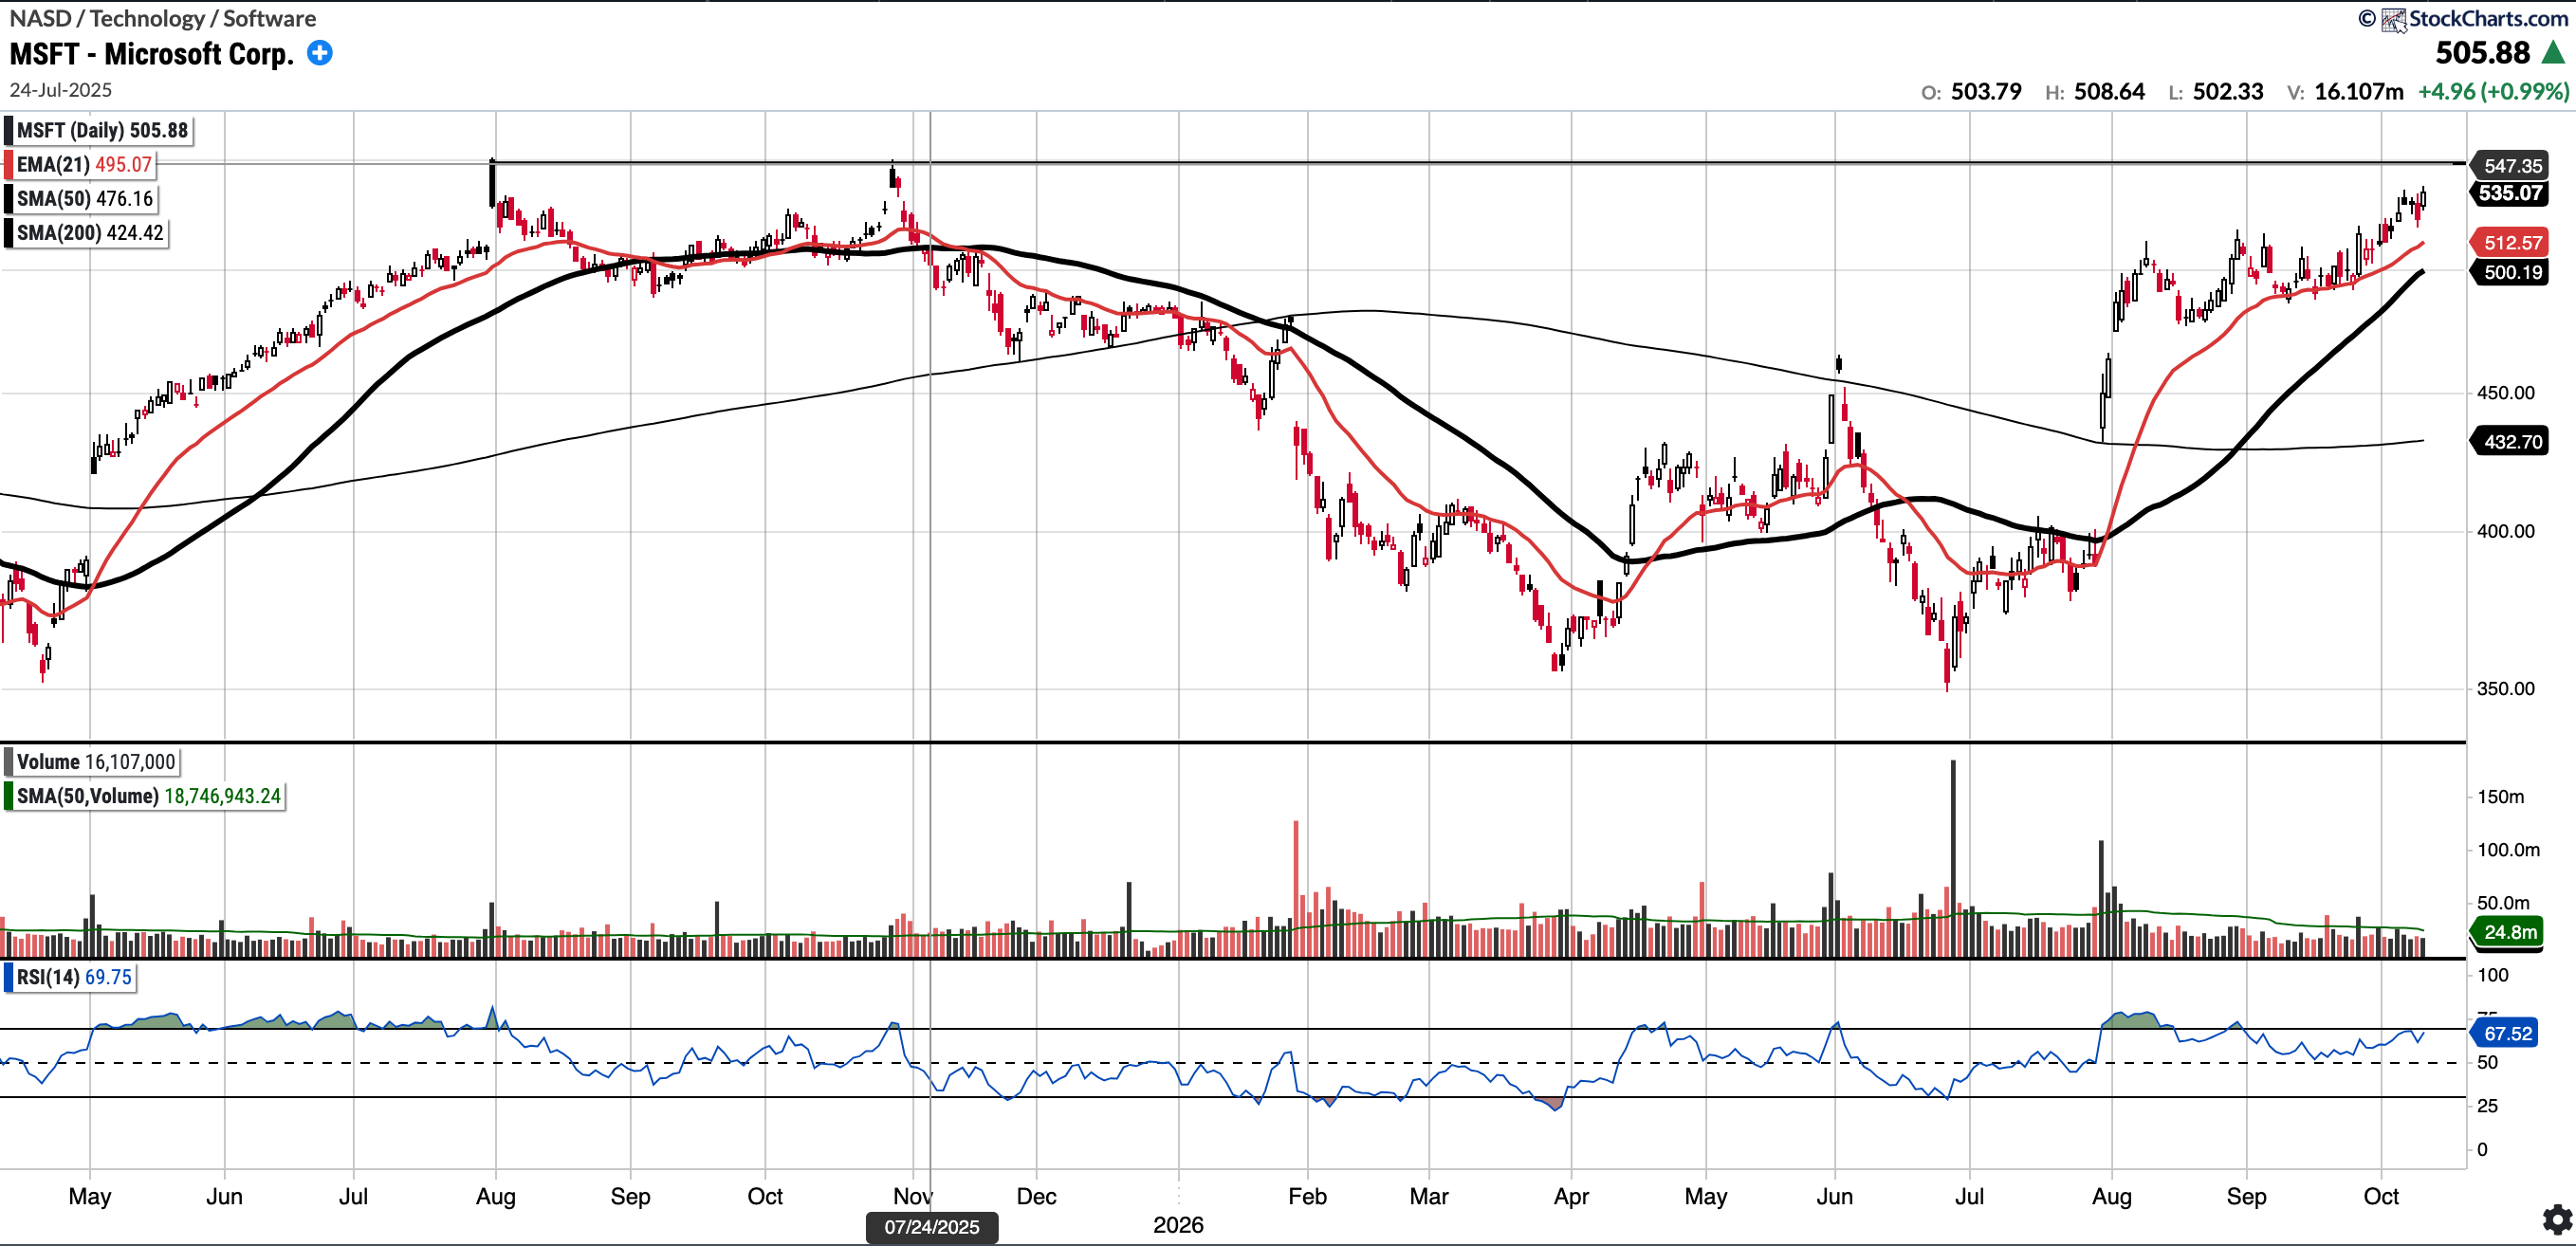
MSFT (Currently Long)
Currently trades at $535.07, 6.97% above the 50SMA and 23.66% above the 200SMA.
RSI 67.52
13.85% YTD
MSFT continues to trend higher above all of its moving averages, closing at new YTD highs on Friday. It is now approaching the 540s, which served as resistance back in 2025 (see horizontal line). Bulls would like to see a decisive break above that level, while the 21EMA continues to act as support on pullbacks.
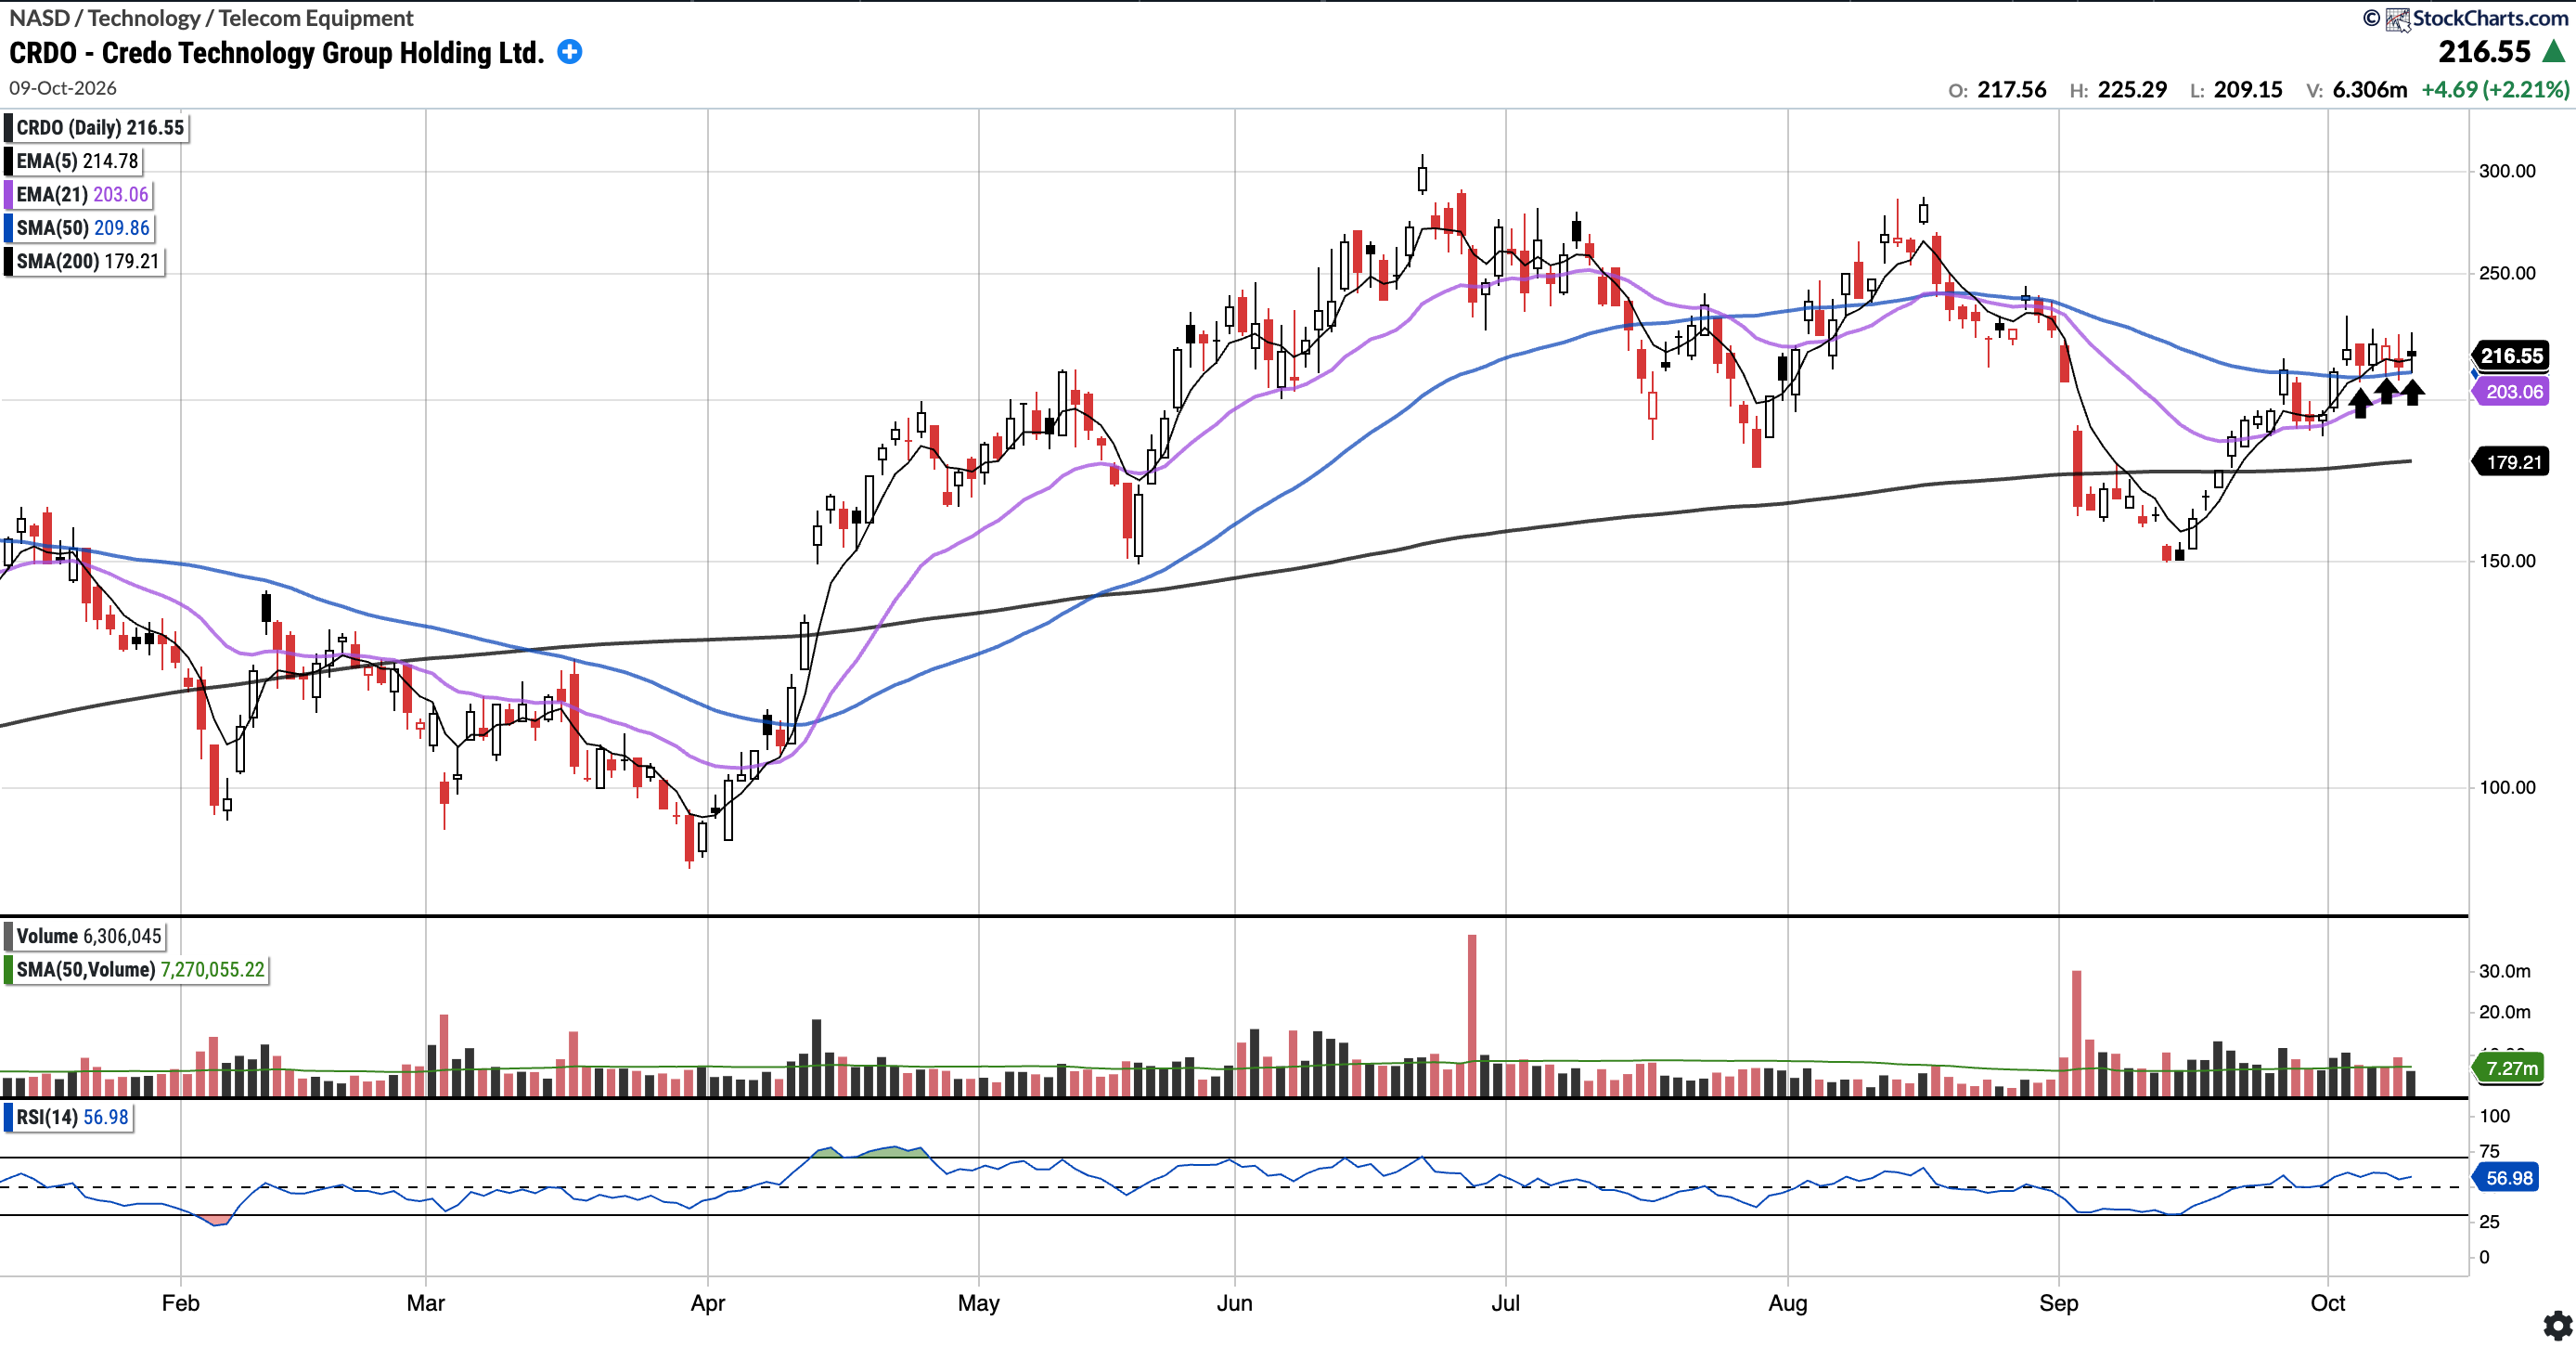
CRDO
Currently trades at $216.55, 3.19% above the 50SMA and 20.84% above the 200SMA.
RSI 56.98
51.20% YTD
CRDO spent the week consolidating just above its 50-SMA, with dips toward the level finding support (see arrows), a sign it is flipping from resistance to support as bulls wanted to see last week. Price remains above all of its key moving averages, with a rally to the 250 the next level to claim.
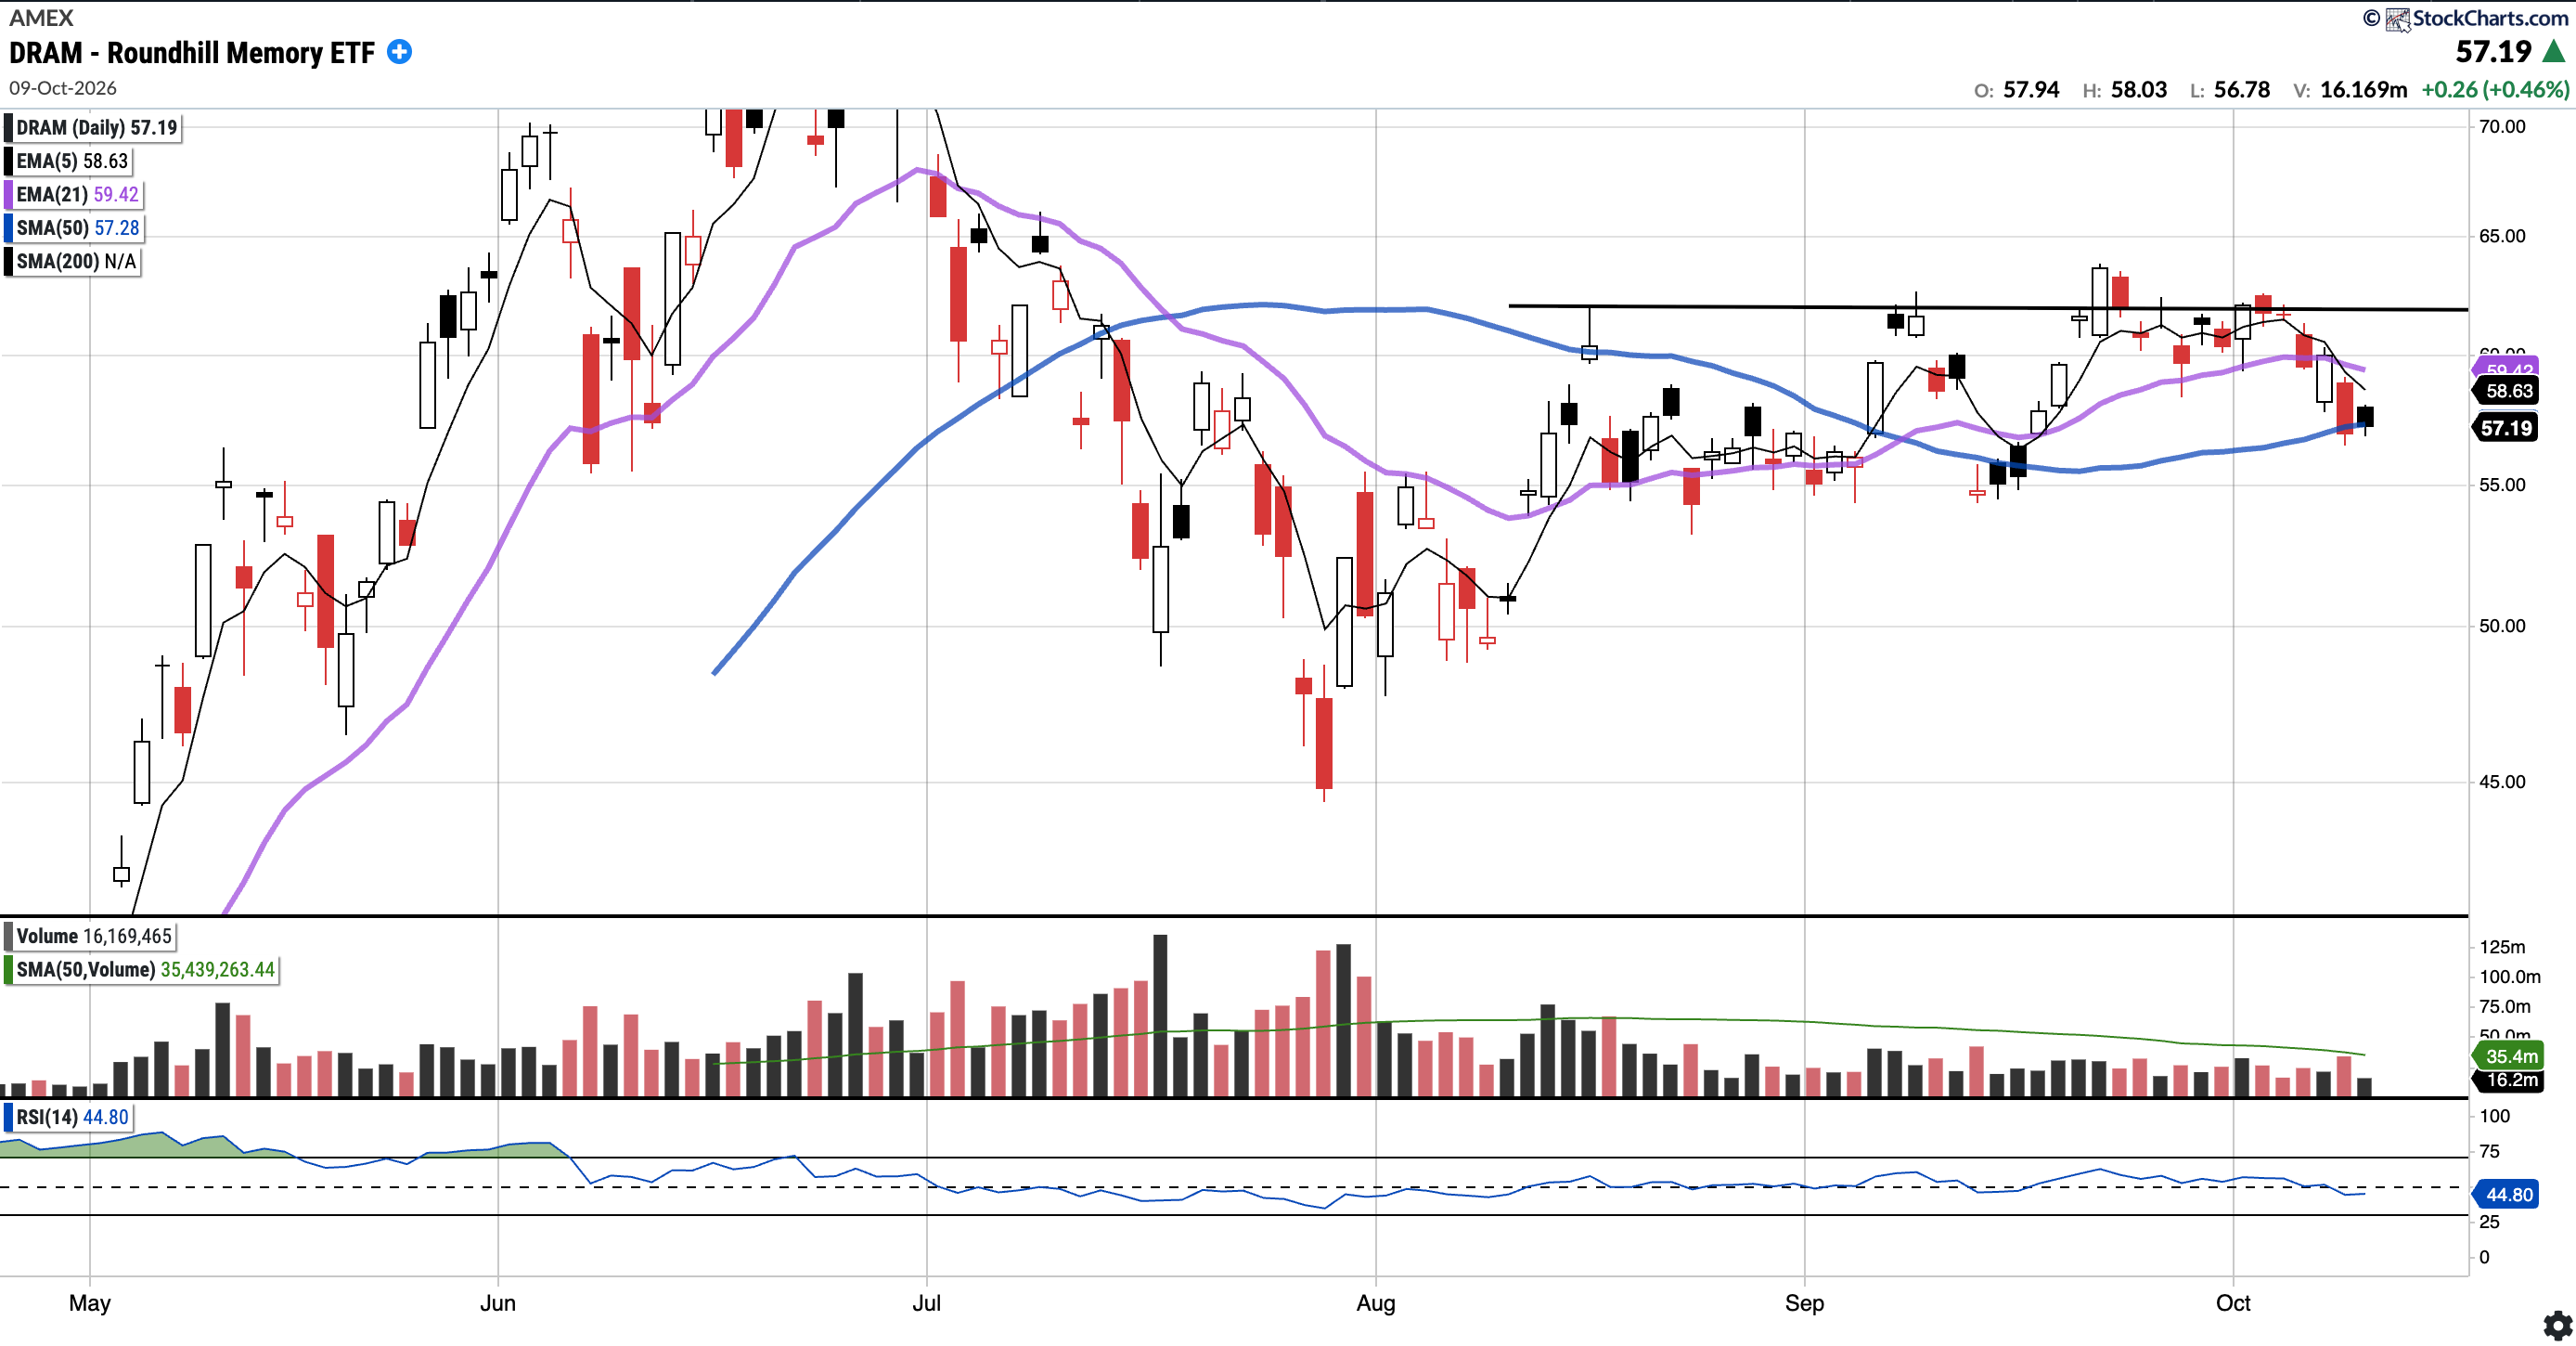
DRAM
Currently trades at $57.19, 0.16% below the 50SMA.
RSI 44.80
106.02% YTD
DRAM was rejected at the $62 level once again early in the week, a level it has struggled with since mid-July, and pulled back to close at $57.19, right on its 50-SMA ($57.28). It also lost the 21-EMA, which had been holding as support. We need the 50-SMA to hold here, with a decisive close above $62 still the trigger for a move toward the June highs.
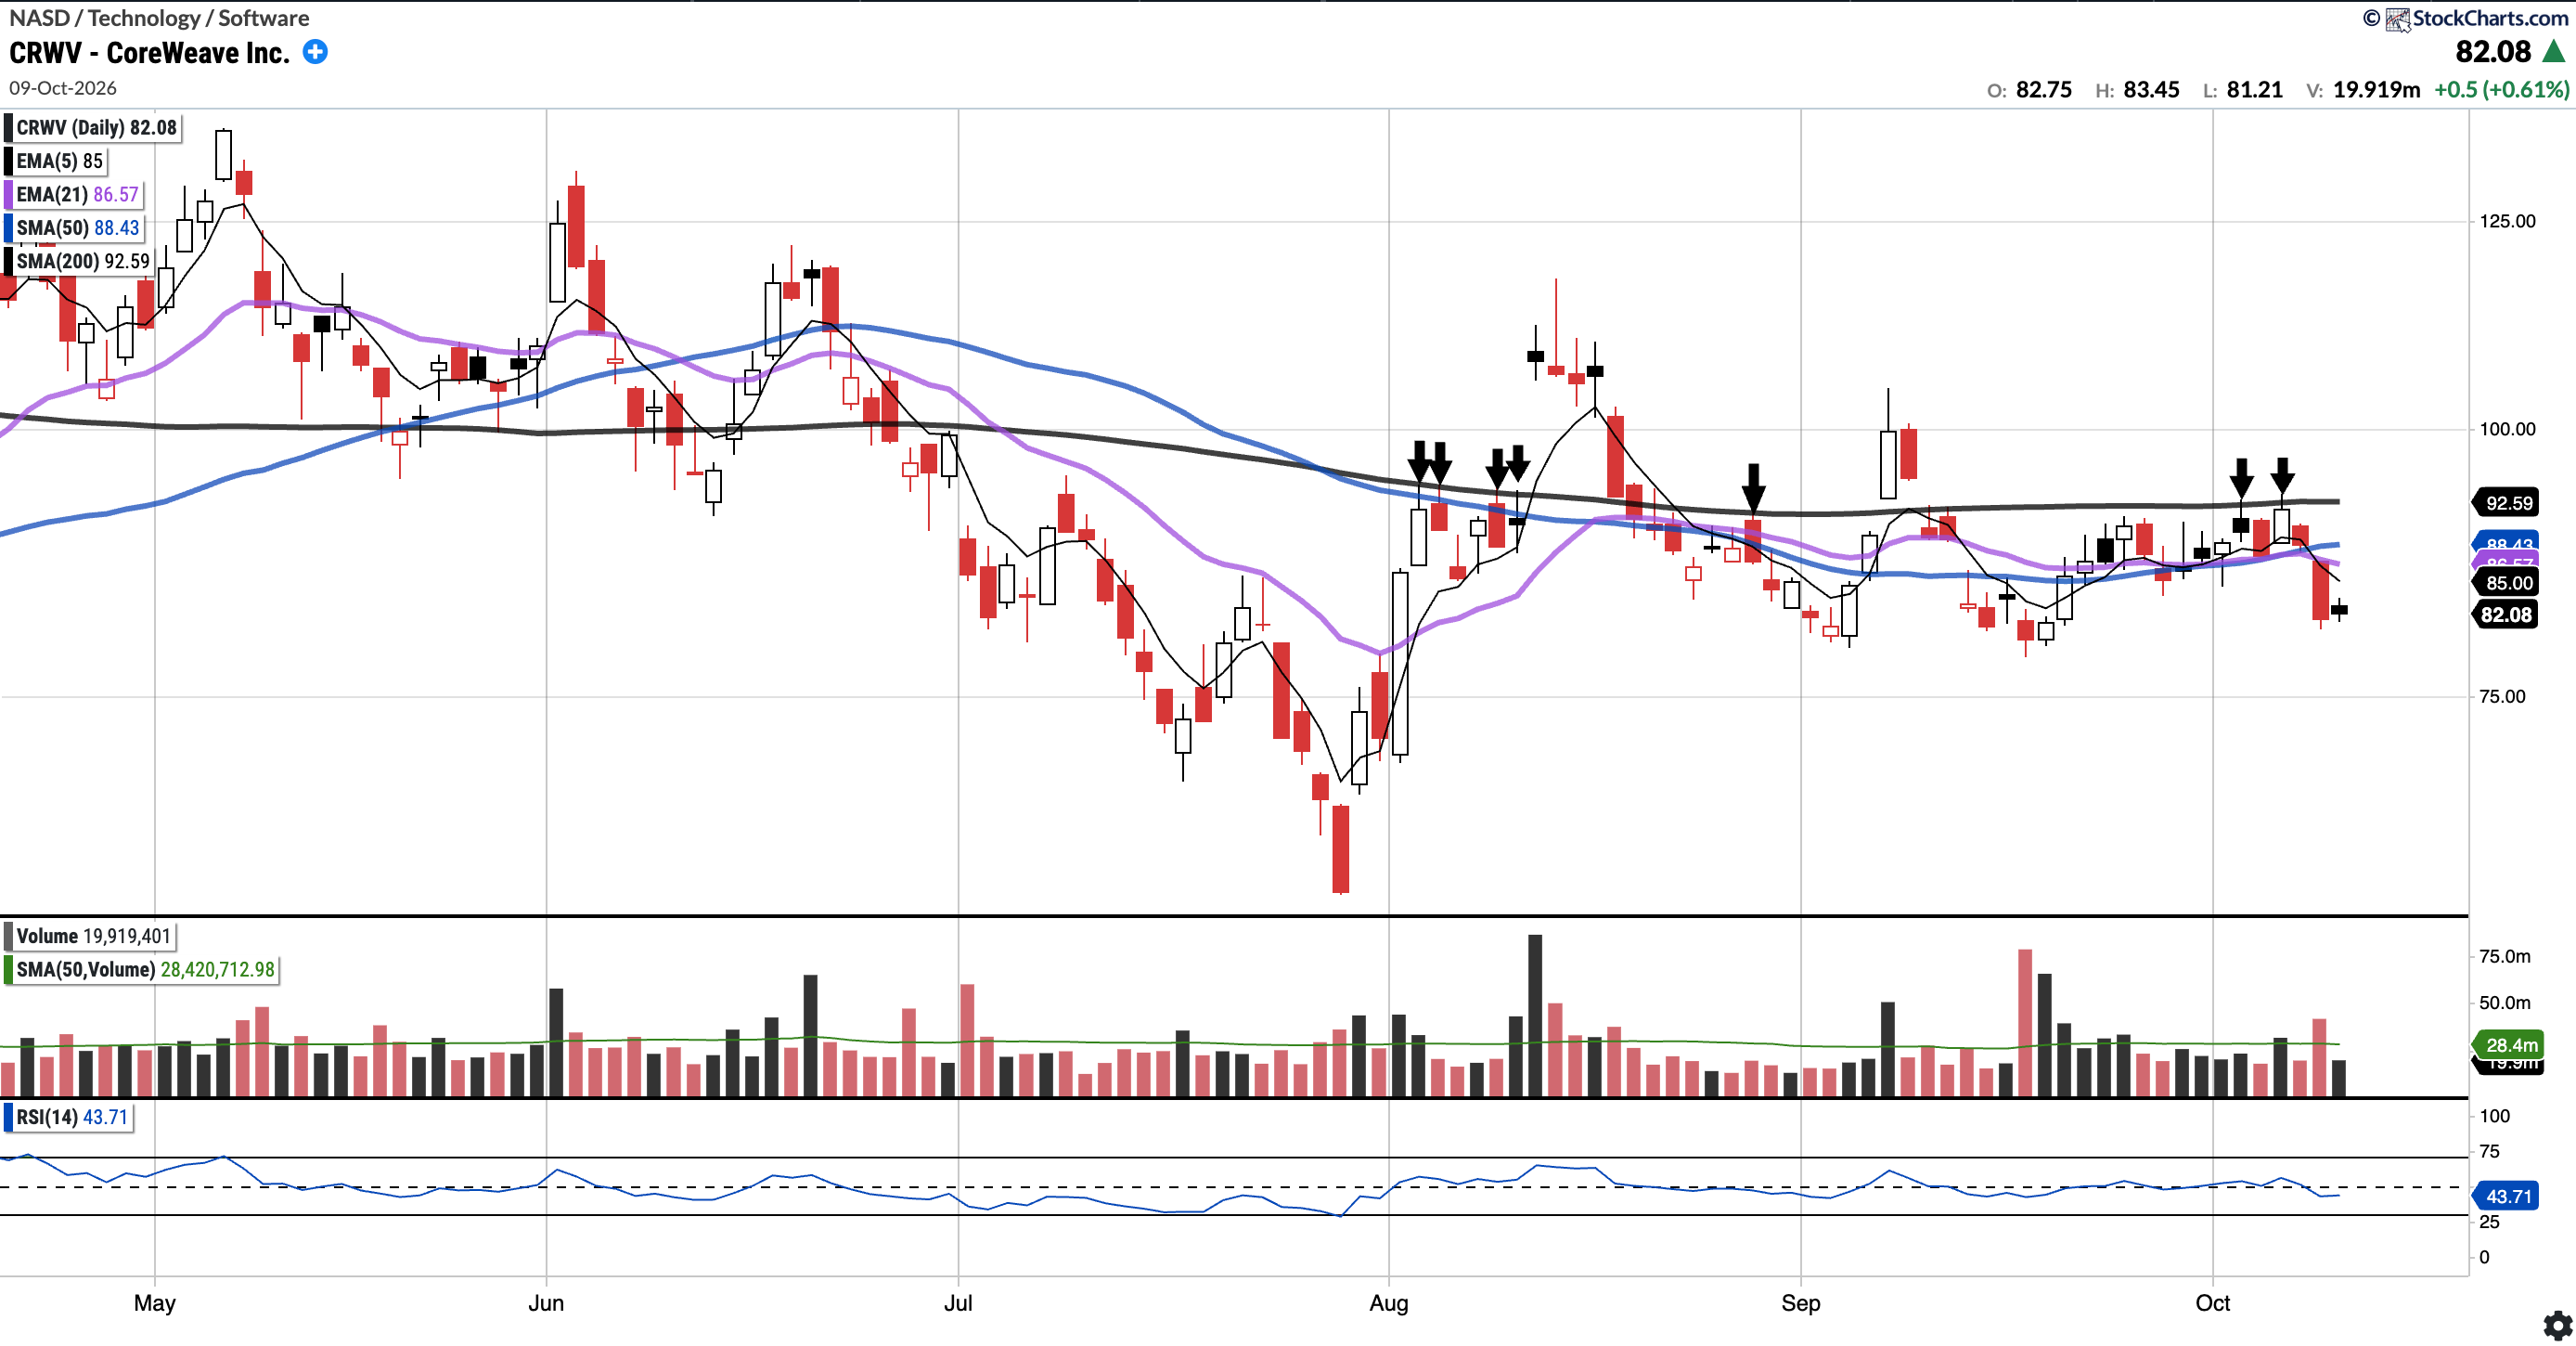
CRWV (Currently Long)
Currently trades at $82.08, 7.18% below the 50SMA and 11.35% below the 200SMA.
RSI 43.71
3.48% YTD
CRWV was rejected at the 200-day SMA ($92.59) again this week (see latest downward arrows). The selling took price back below both its 21EMA ($86.57) and 50-day SMA ($88.43), which had been supportive last week. Bulls need to reclaim the 21EMA and 50-day SMA first, with the mid-September lows near $80, the next support below. A decisive close above the 200-day SMA remains what would potentially open the door to the $110–$115 level.
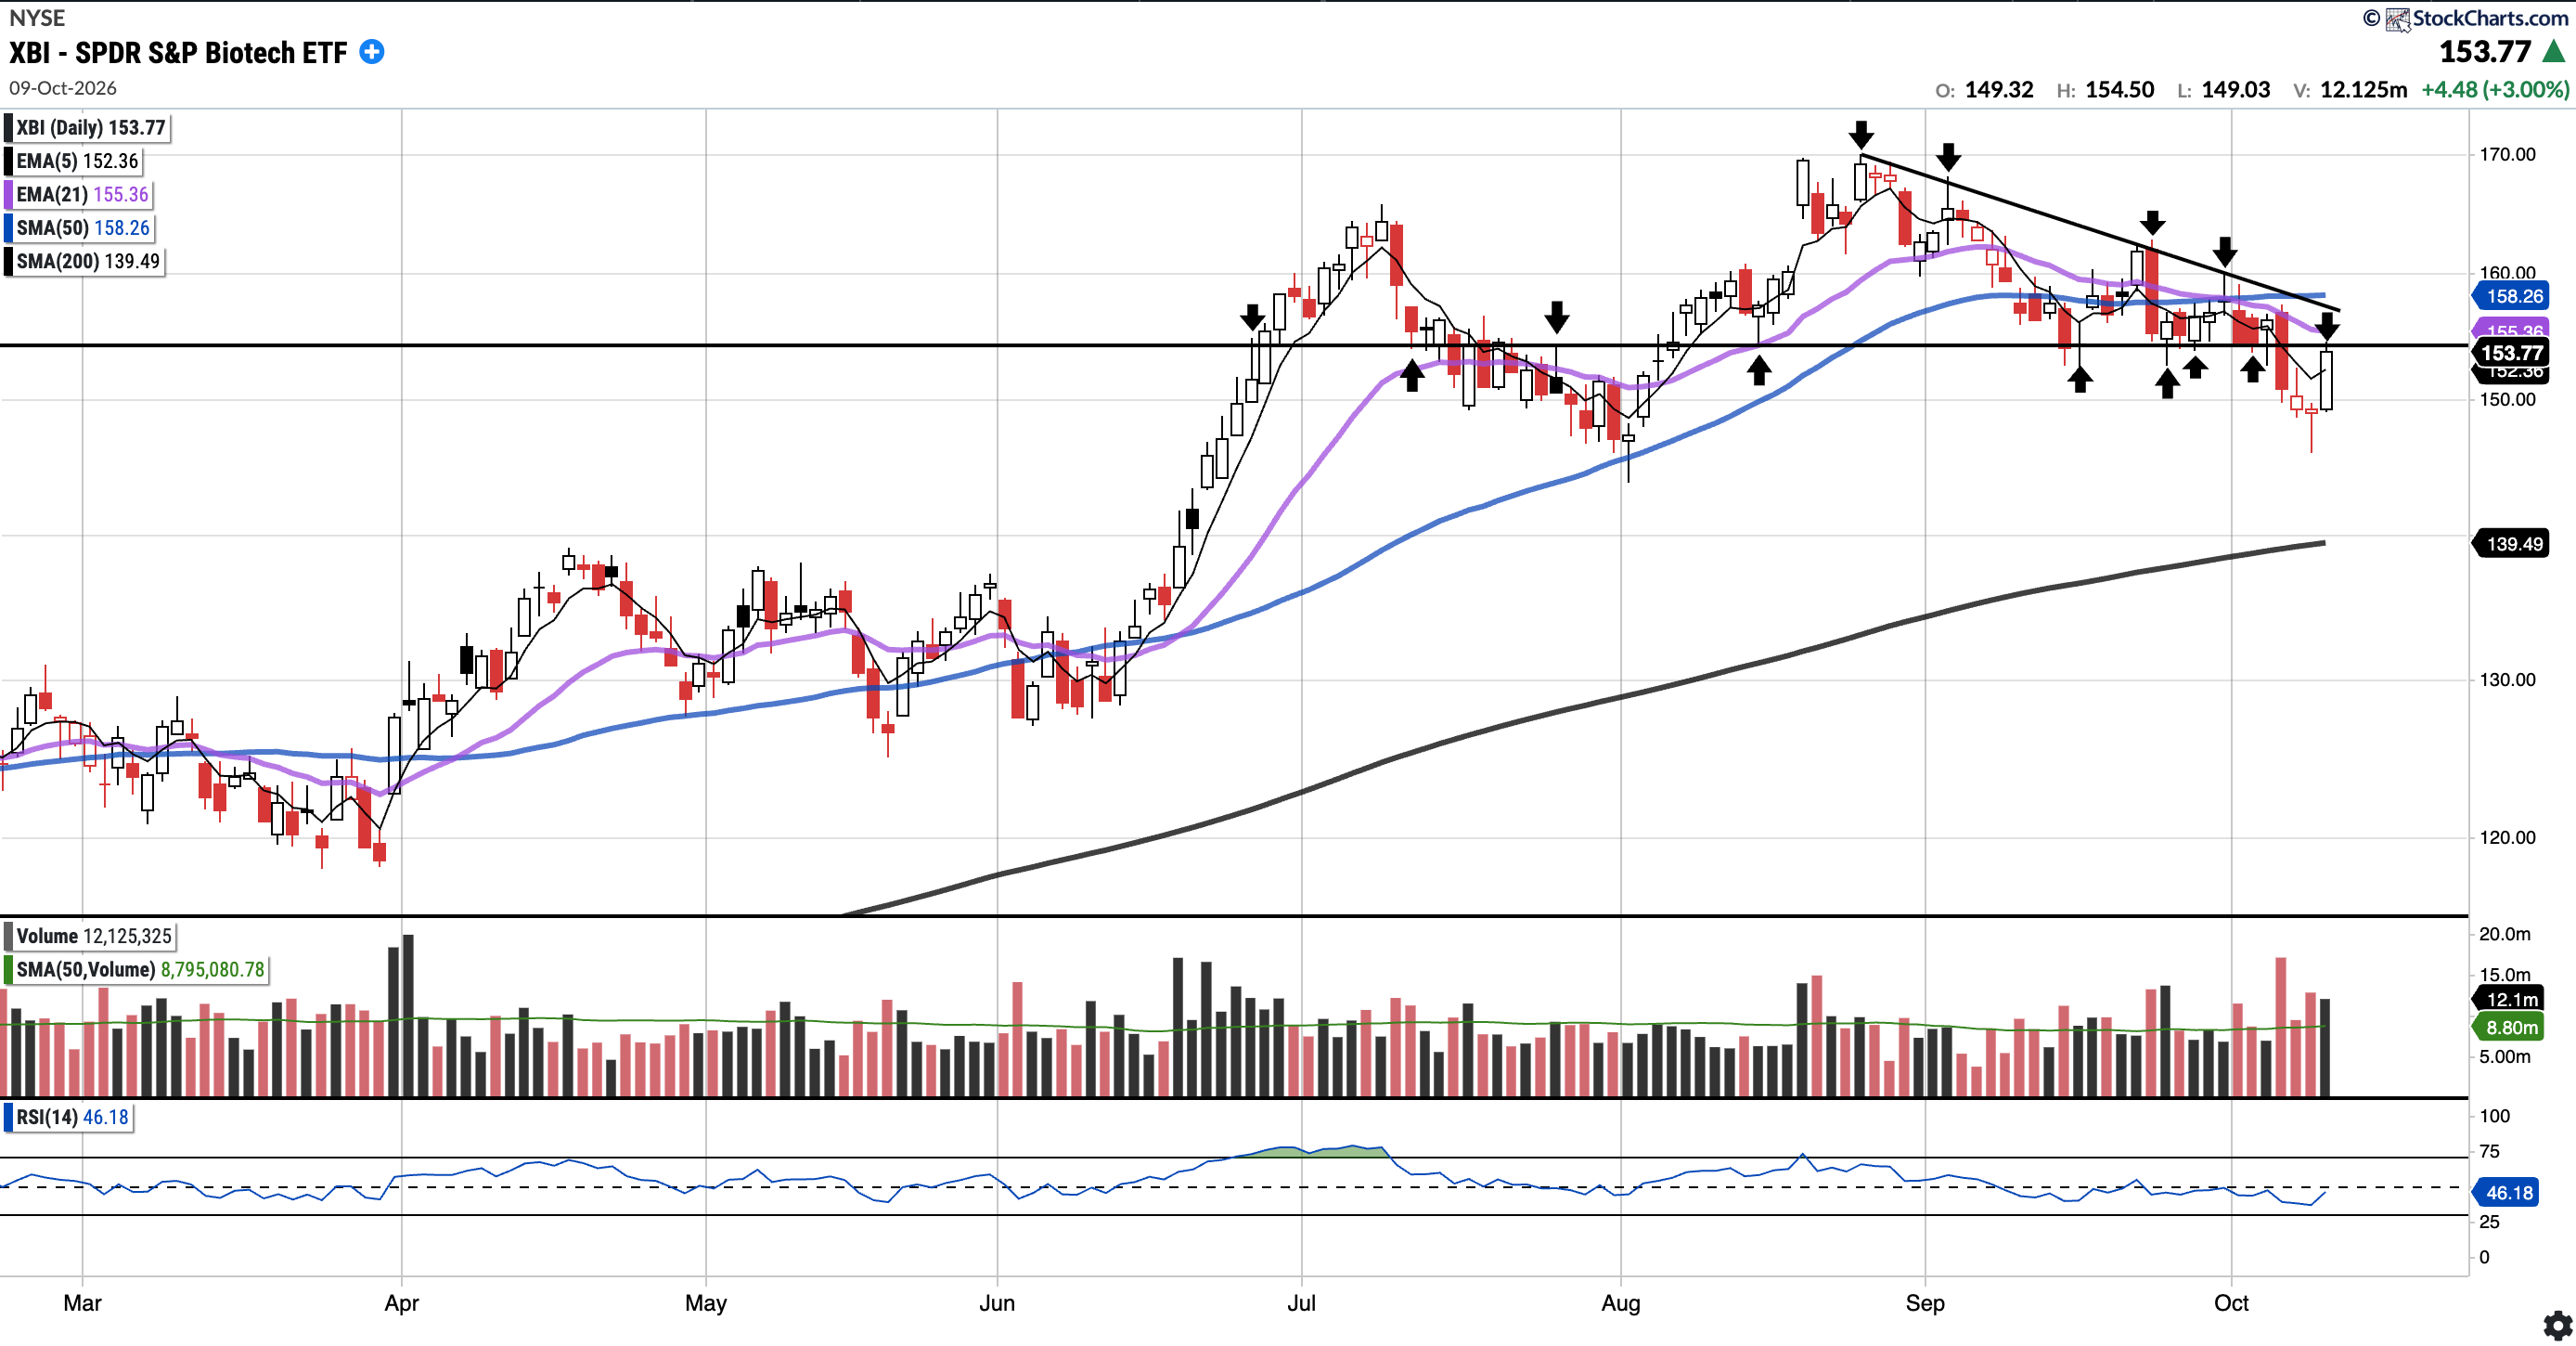
XBI
Currently trades at $153.77, 2.83% below the 50SMA and 10.24% above the 200SMA.
RSI 46.18
26.66% YTD
XBI lost the $154 support level flagged last week, dipping below $150 midweek, before a 3% rally on Friday on above-average volume took price right back up to that level. Friday’s push stalled just beneath the 21EMA (see arrow), and the descending trendline remains intact. Bulls need to reclaim $154 and the 21EMA, then the 50SMA and the trendline, to restore the uptrend. Failure here would turn $154 into resistance.
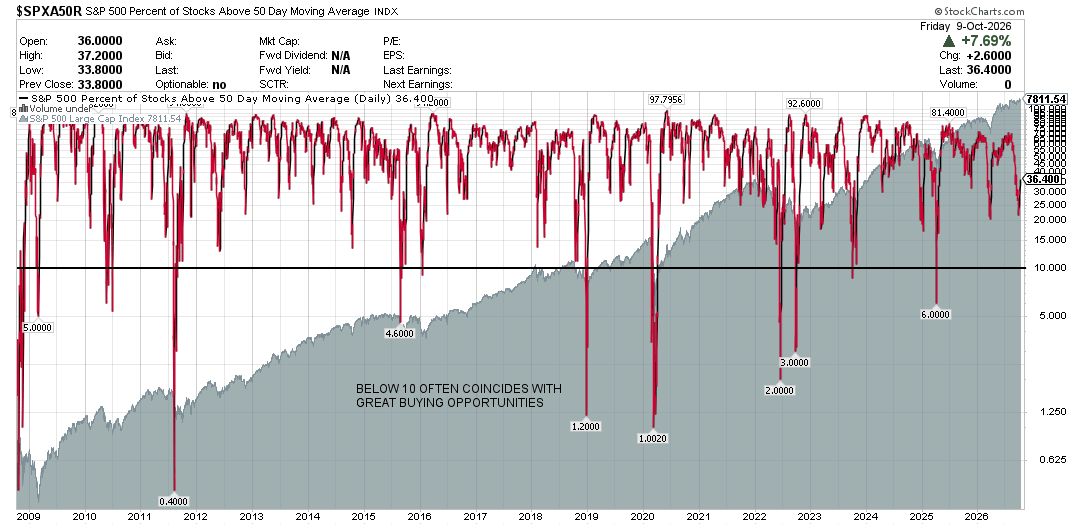
S&P 500 Percentage of Stocks Above the 50 Day Moving Average: Currently 36.40%
Breadth increased decently this week, with the percentage of stocks above the 50-day moving average now at 36.40% compared to 25.00% last week.
Notable portfolio changes in previous week (all updated live in subscriber channels):
TWST: Exited the last of my TWST position for a > 6x bagger since last October.