

Hope you all are having a good weekend. Below, we will be previewing the upcoming week’s events and providing a portfolio update as usual.
Format for what is covered in this weekly preview:
A Look at the Indices
Key Upcoming Economic Events
Upcoming Earnings
Charts
Current Portfolio Holdings:
Sizing | Cost Basis | Timeframe | Planned Moves
Closing Thoughts (Scroll to here for my Market Commentary)
I recommend checking out the most recent Monthly Portfolio and Performance Update below:

Indices
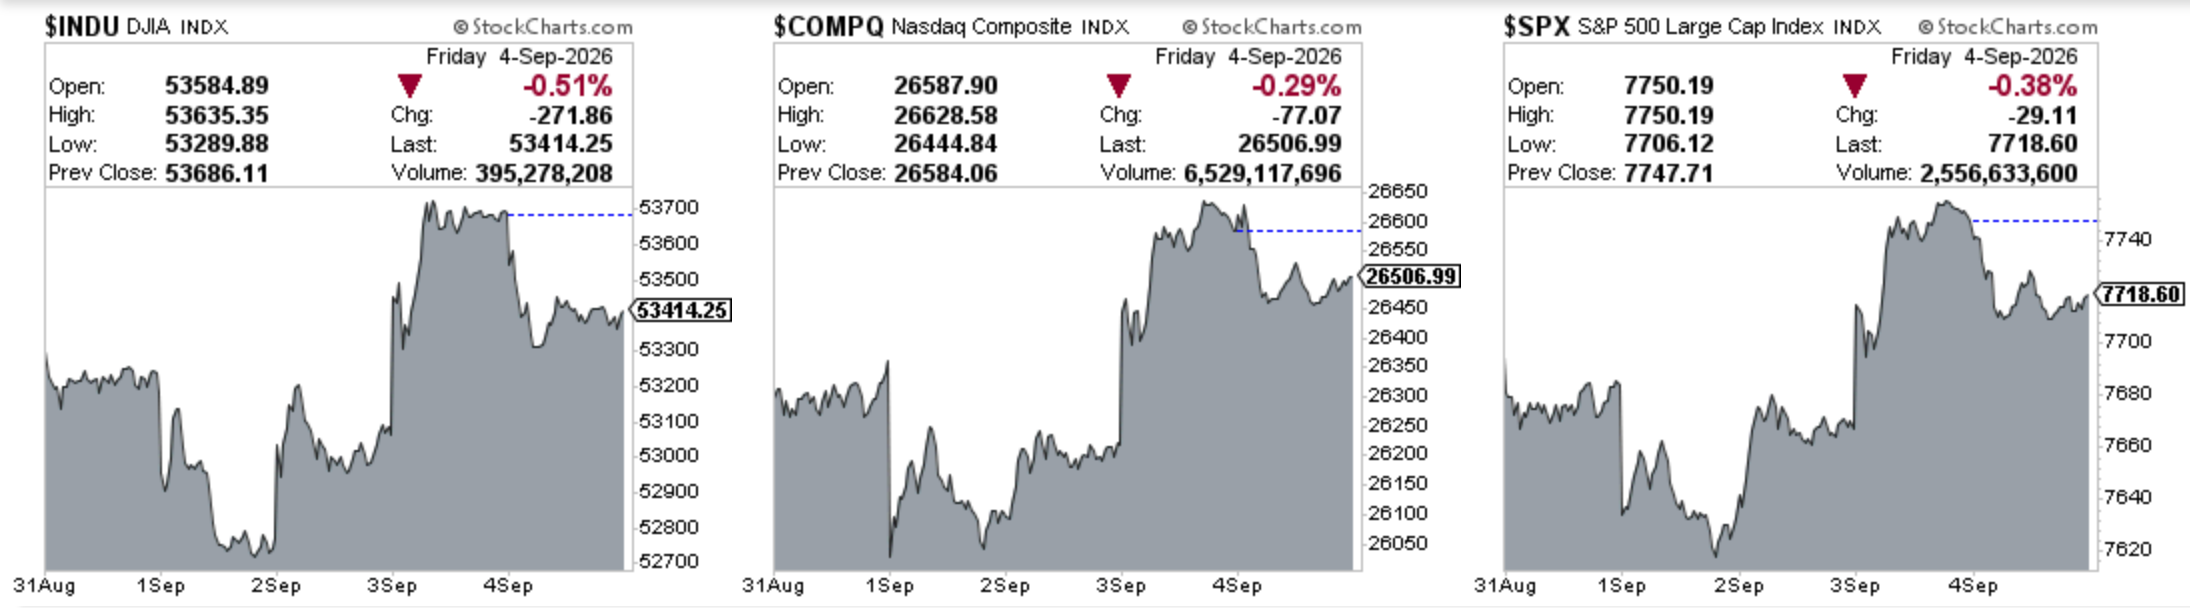
Dow Jones Industrial Average declined -0.27% in the last week
S&P 500 advanced +0.09% in the last week
Nasdaq Composite advanced +0.40% in the last week
IWM advanced +0.09% in the last week
Key upcoming economic events
Monday, September 7
Labor Day: U.S. markets and federal offices closed, no data releases scheduled
Tuesday, September 8
NFIB Small Business Optimism Index (August)
Consumer Credit (July)
Census Bureau Quarterly Financial Report (Q2 2026, Manufacturing/Mining/Wholesale/Retail Trade Corporations)
Wednesday, September 9
No major scheduled releases
Thursday, September 10
Producer Price Index (PPI, August)
Initial Weekly Jobless Claims
Friday, September 11
Consumer Price Index (CPI, August)
University of Michigan Consumer Sentiment, Preliminary (September)
Upcoming Earnings
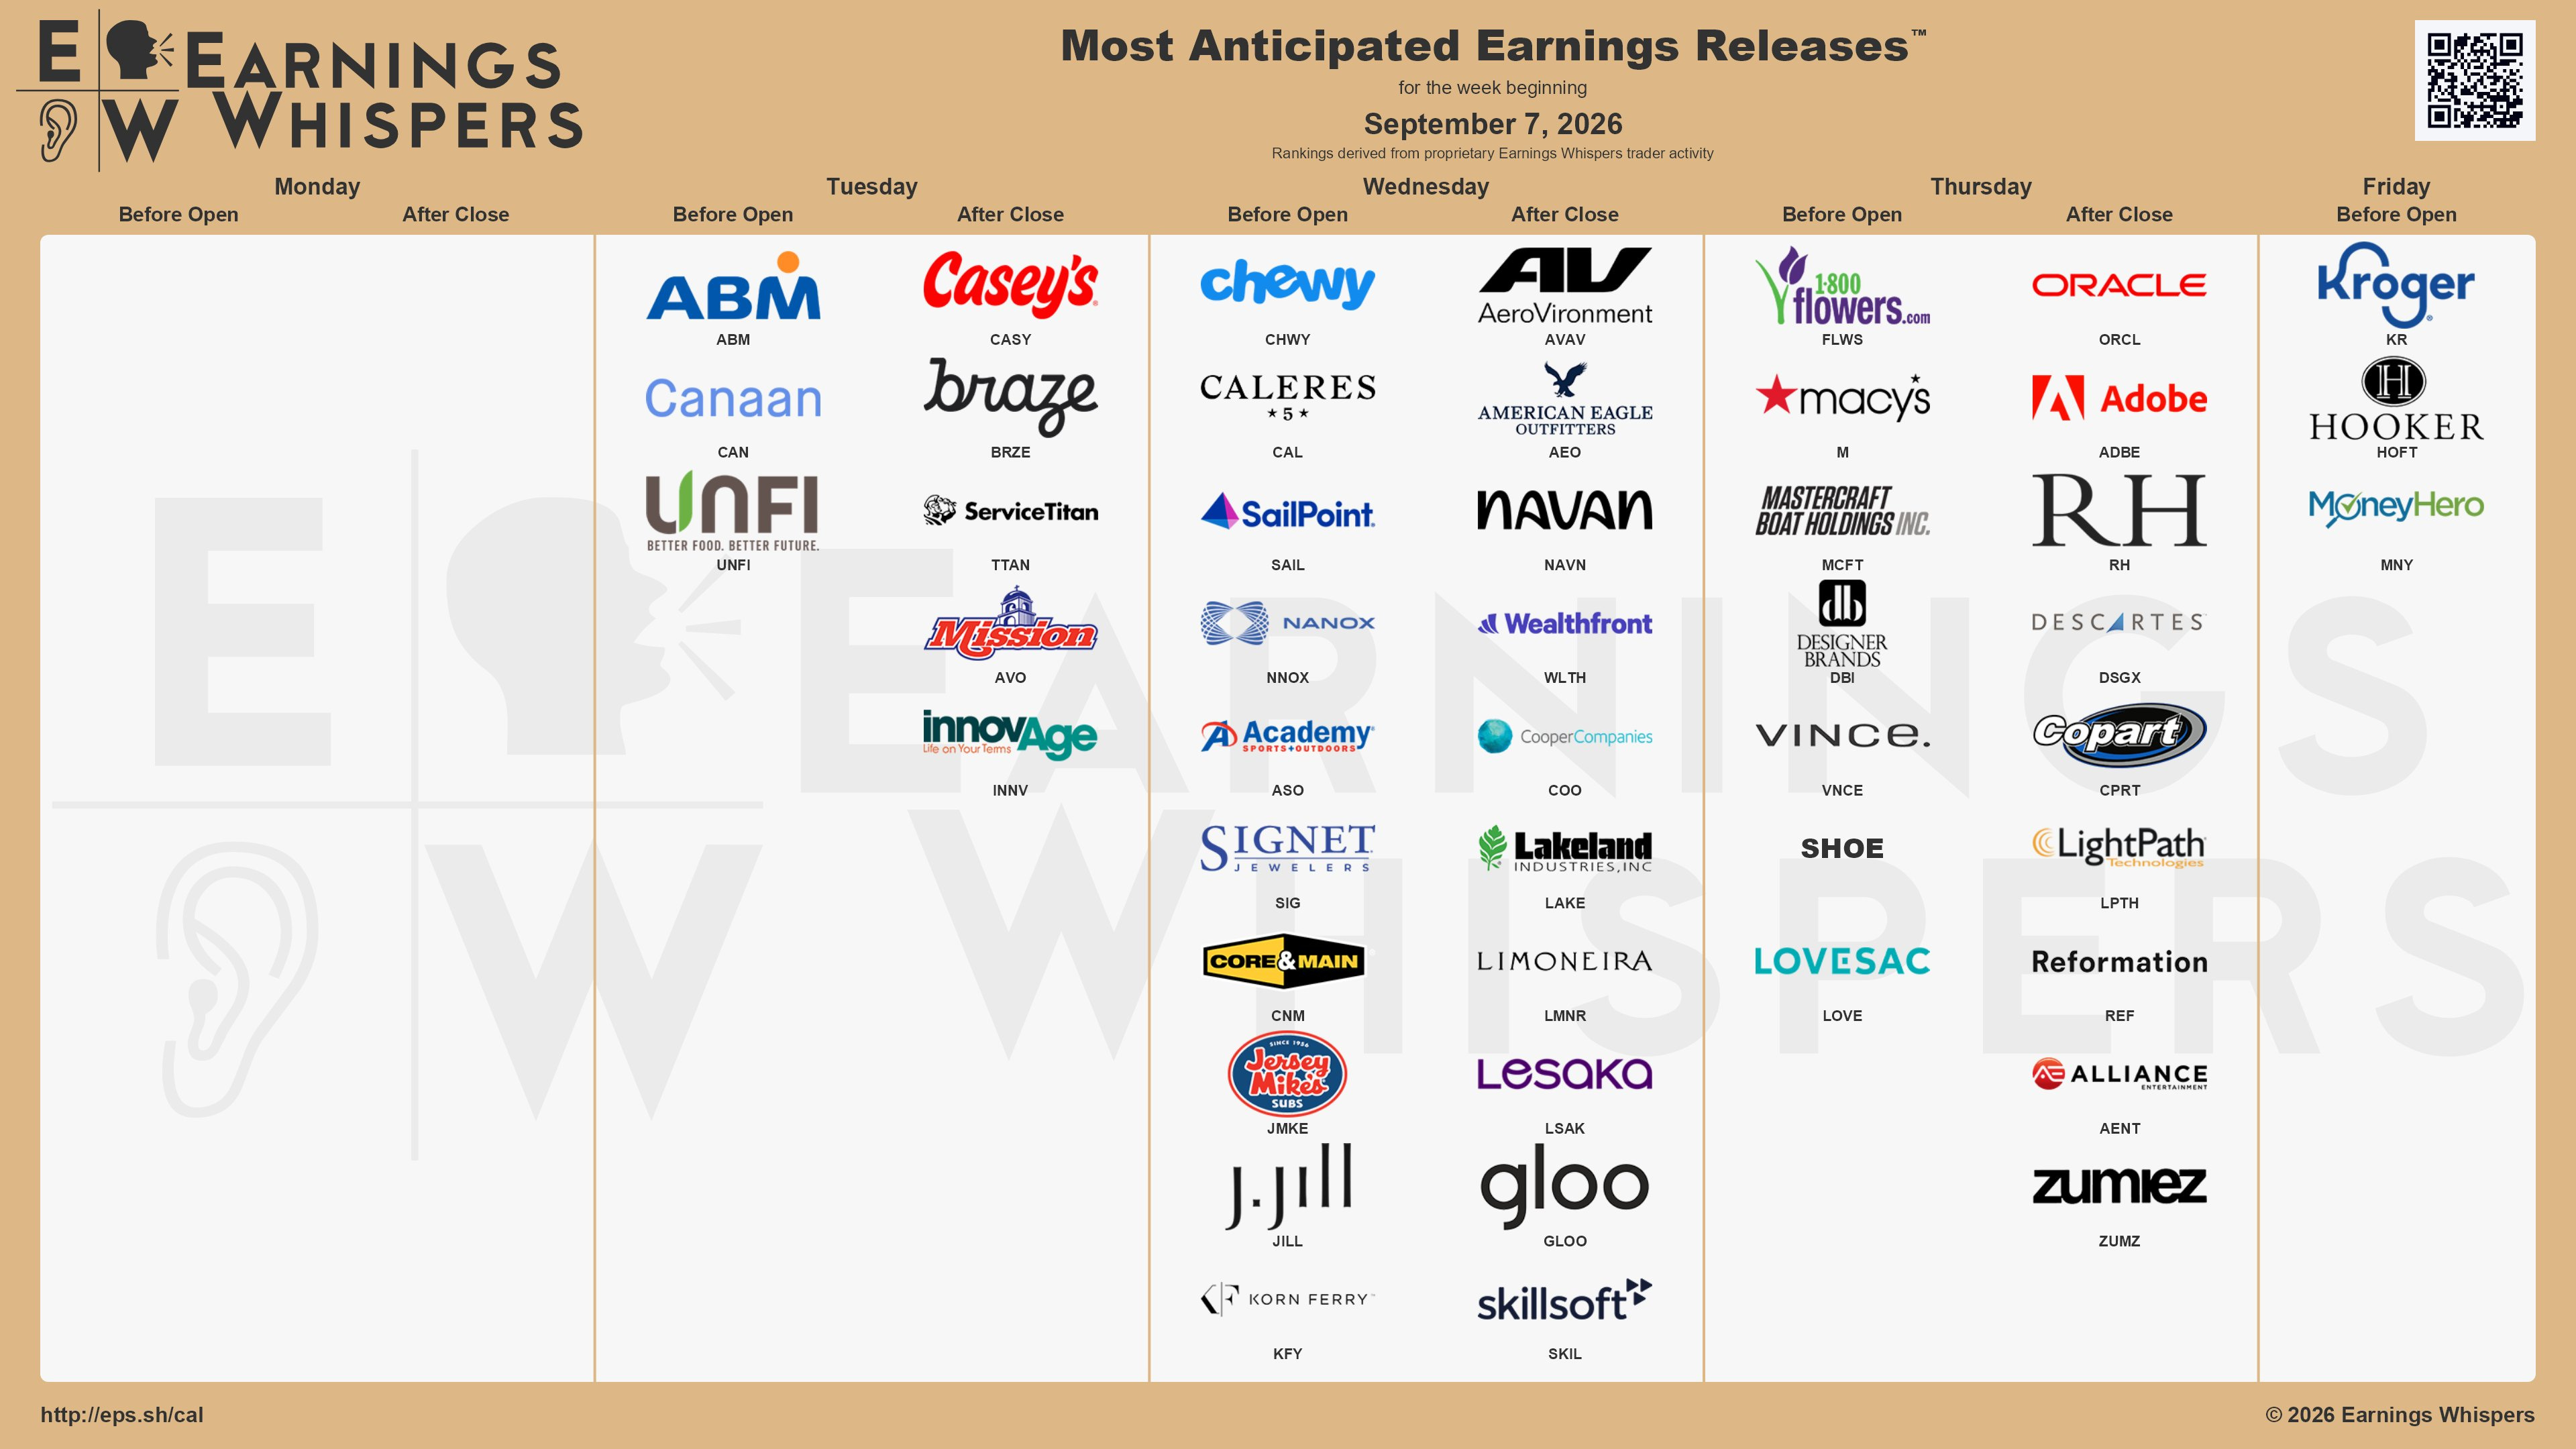
Below is the infographic by Earnings Whispers highlighting the schedule for this week:
Charts
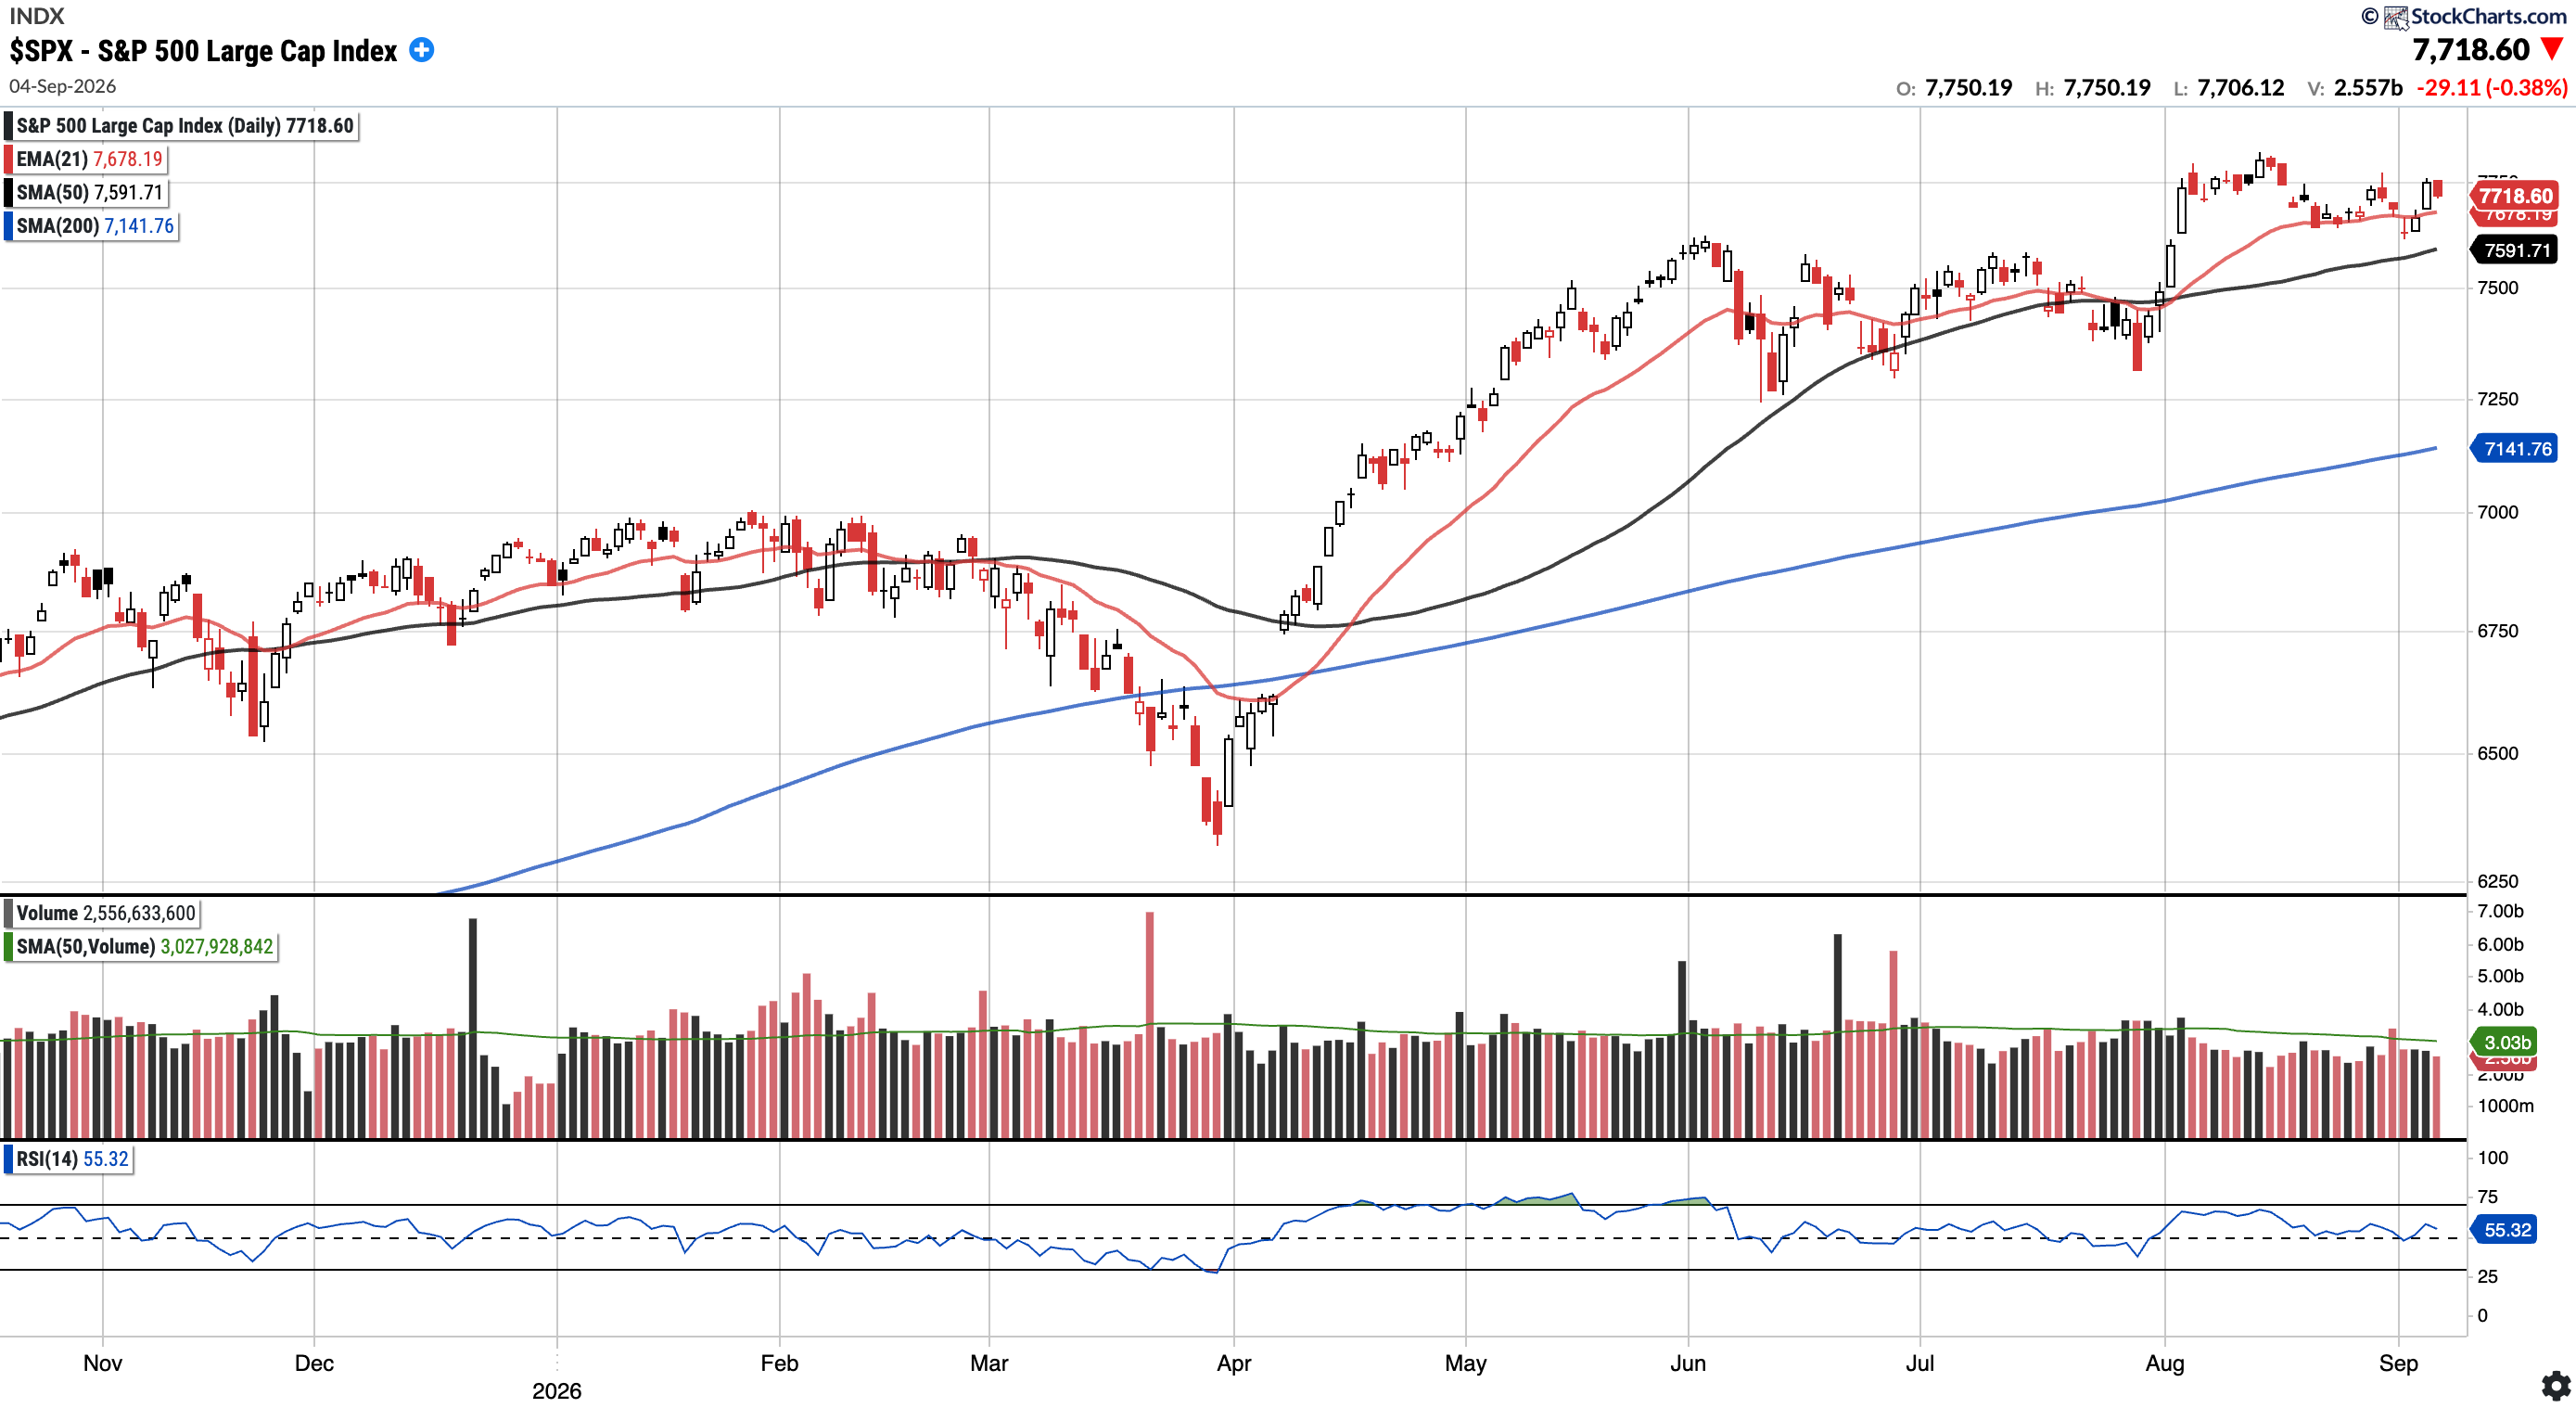
SPX
Currently trades at $7,718.60, 1.67% above the 50SMA and 8.08% above the 200SMA.
RSI 55.32
12.54% YTD
Distribution days in the last week: 1
While the S&P 500 undercut the 21 EMA mid-week, it closed out the week above all key moving averages. This is constructive; however, the upcoming CPI report is likely to be a market-moving event to watch out for this week.
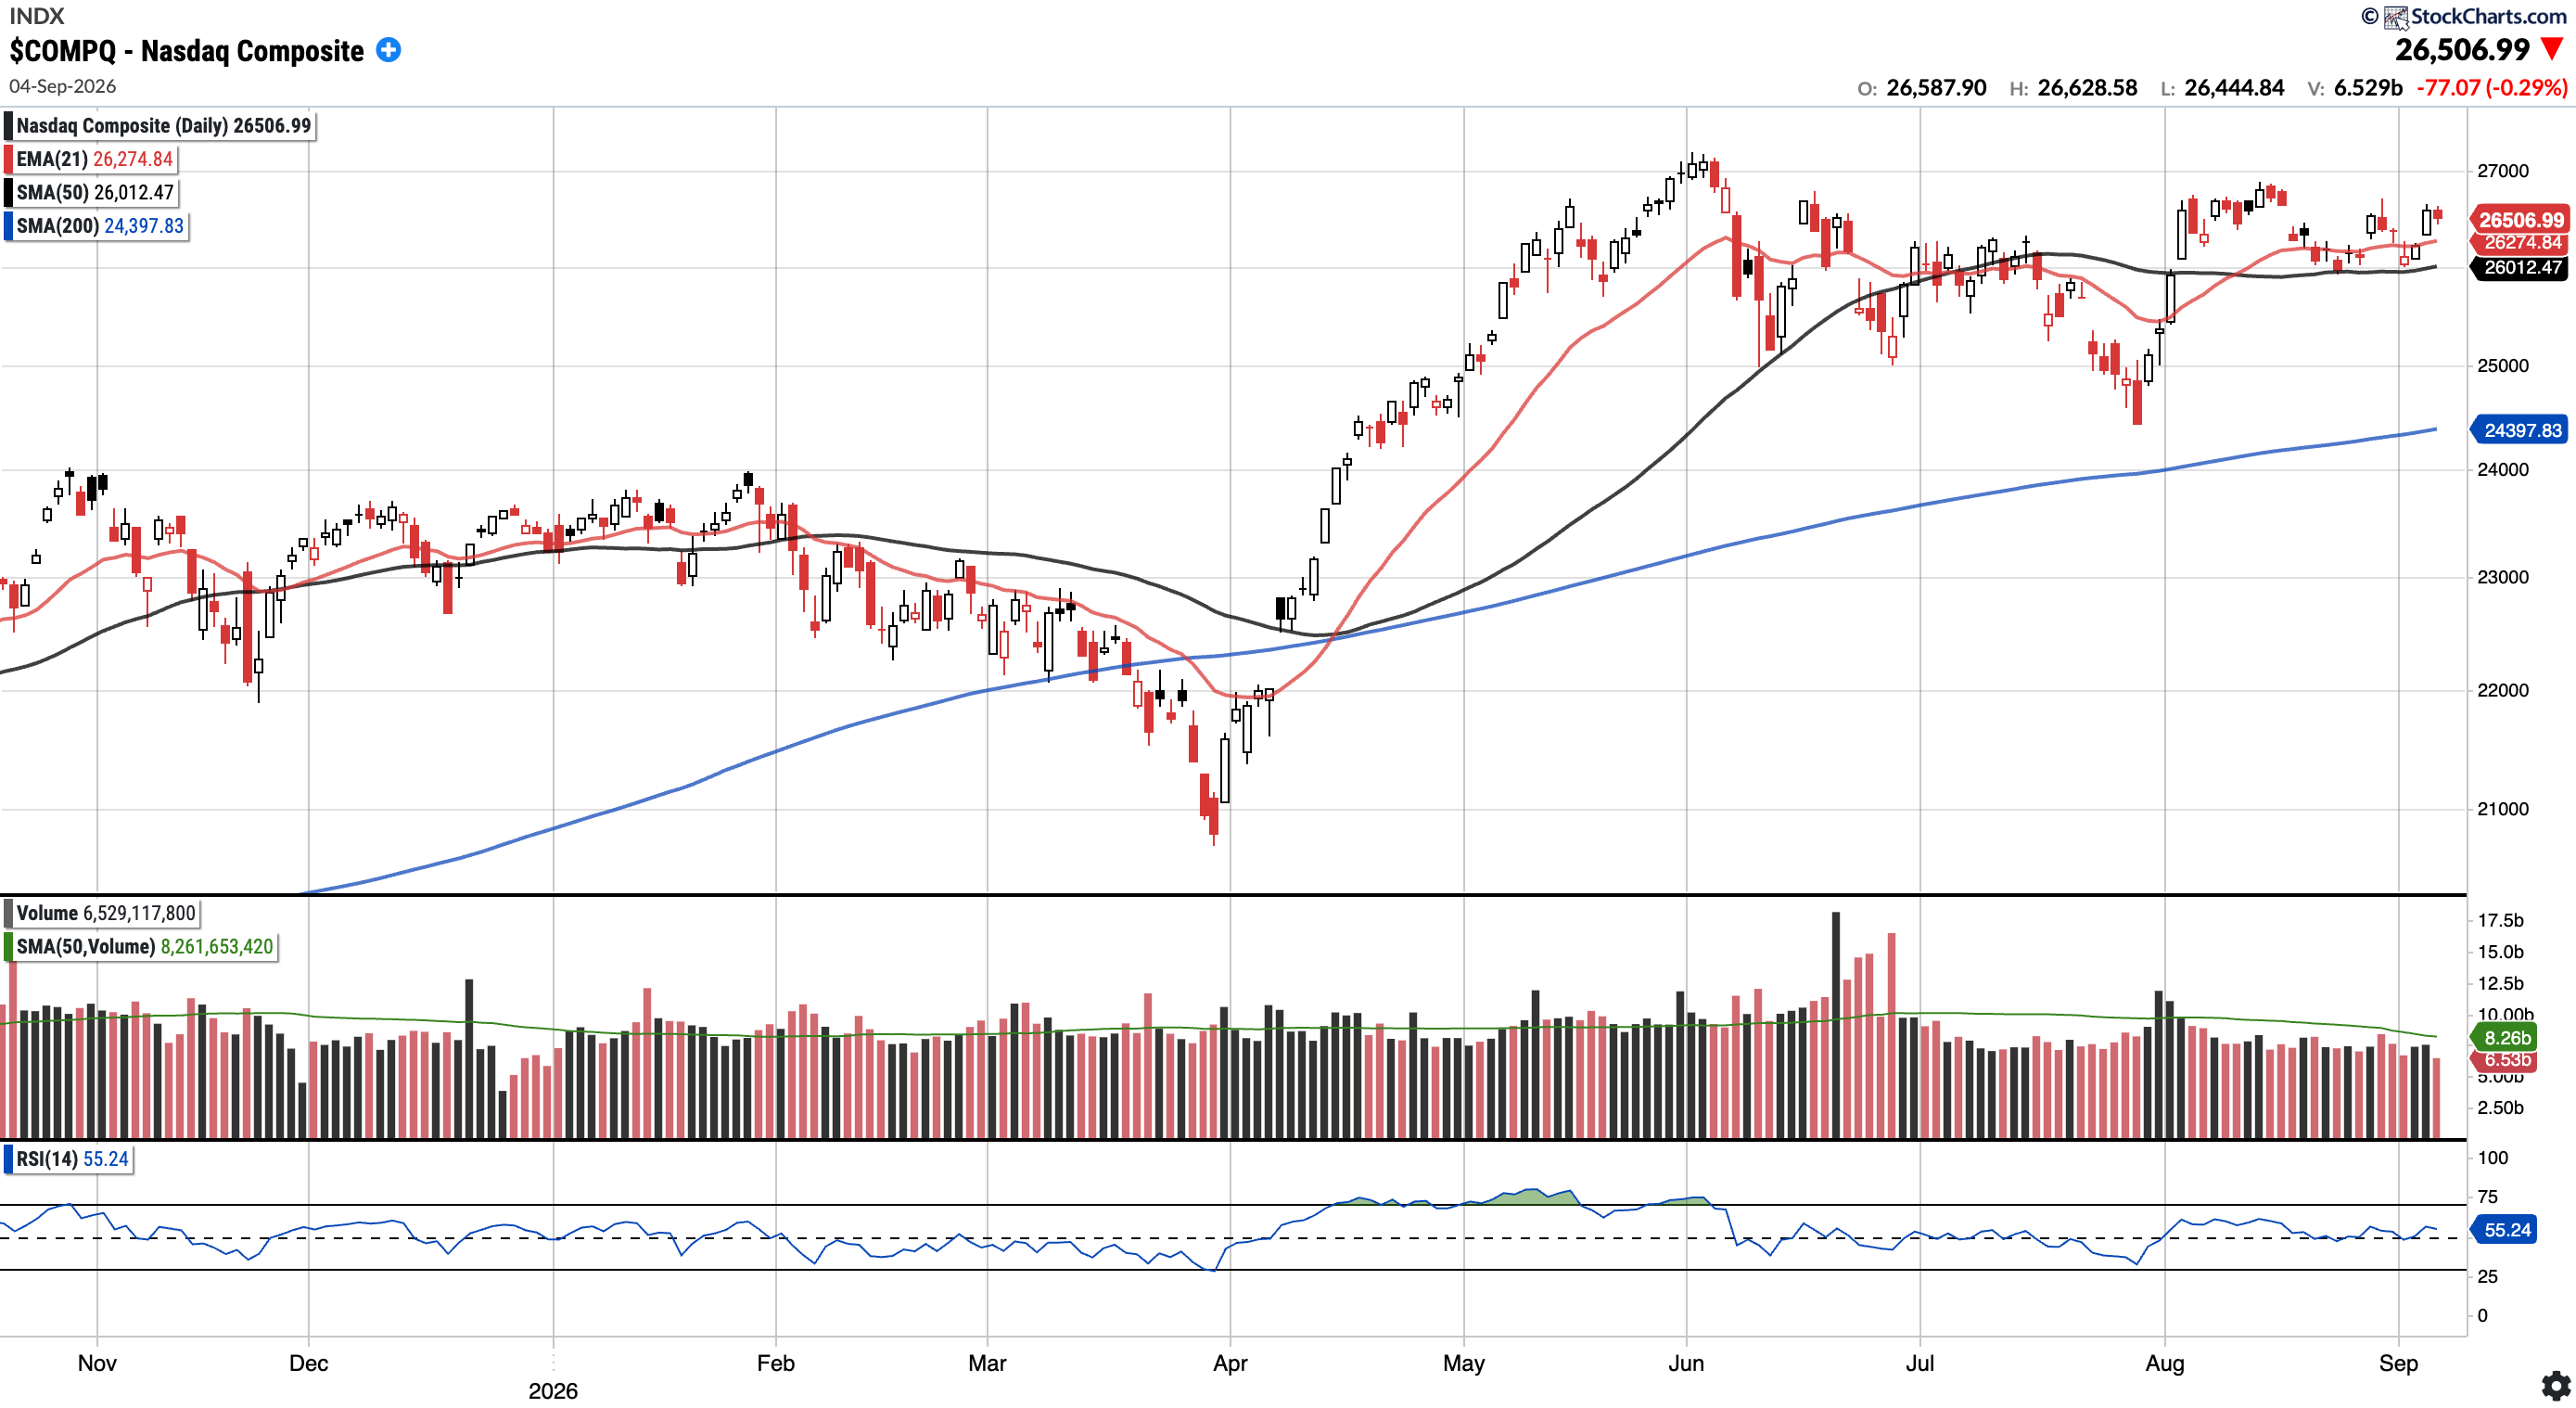
COMPQ
Currently trades at $26,506.99, 1.90% above the 50SMA and 8.64% above the 200SMA.
RSI 55.24
14.08% YTD
Distribution days in the last week: 0
The Nasdaq also remains above its key moving averages despite pulling back to the 50 SMA for the second consecutive week. The index recovered nicely with a push higher on Thursday and managed to close above the 21 EMA on Friday.
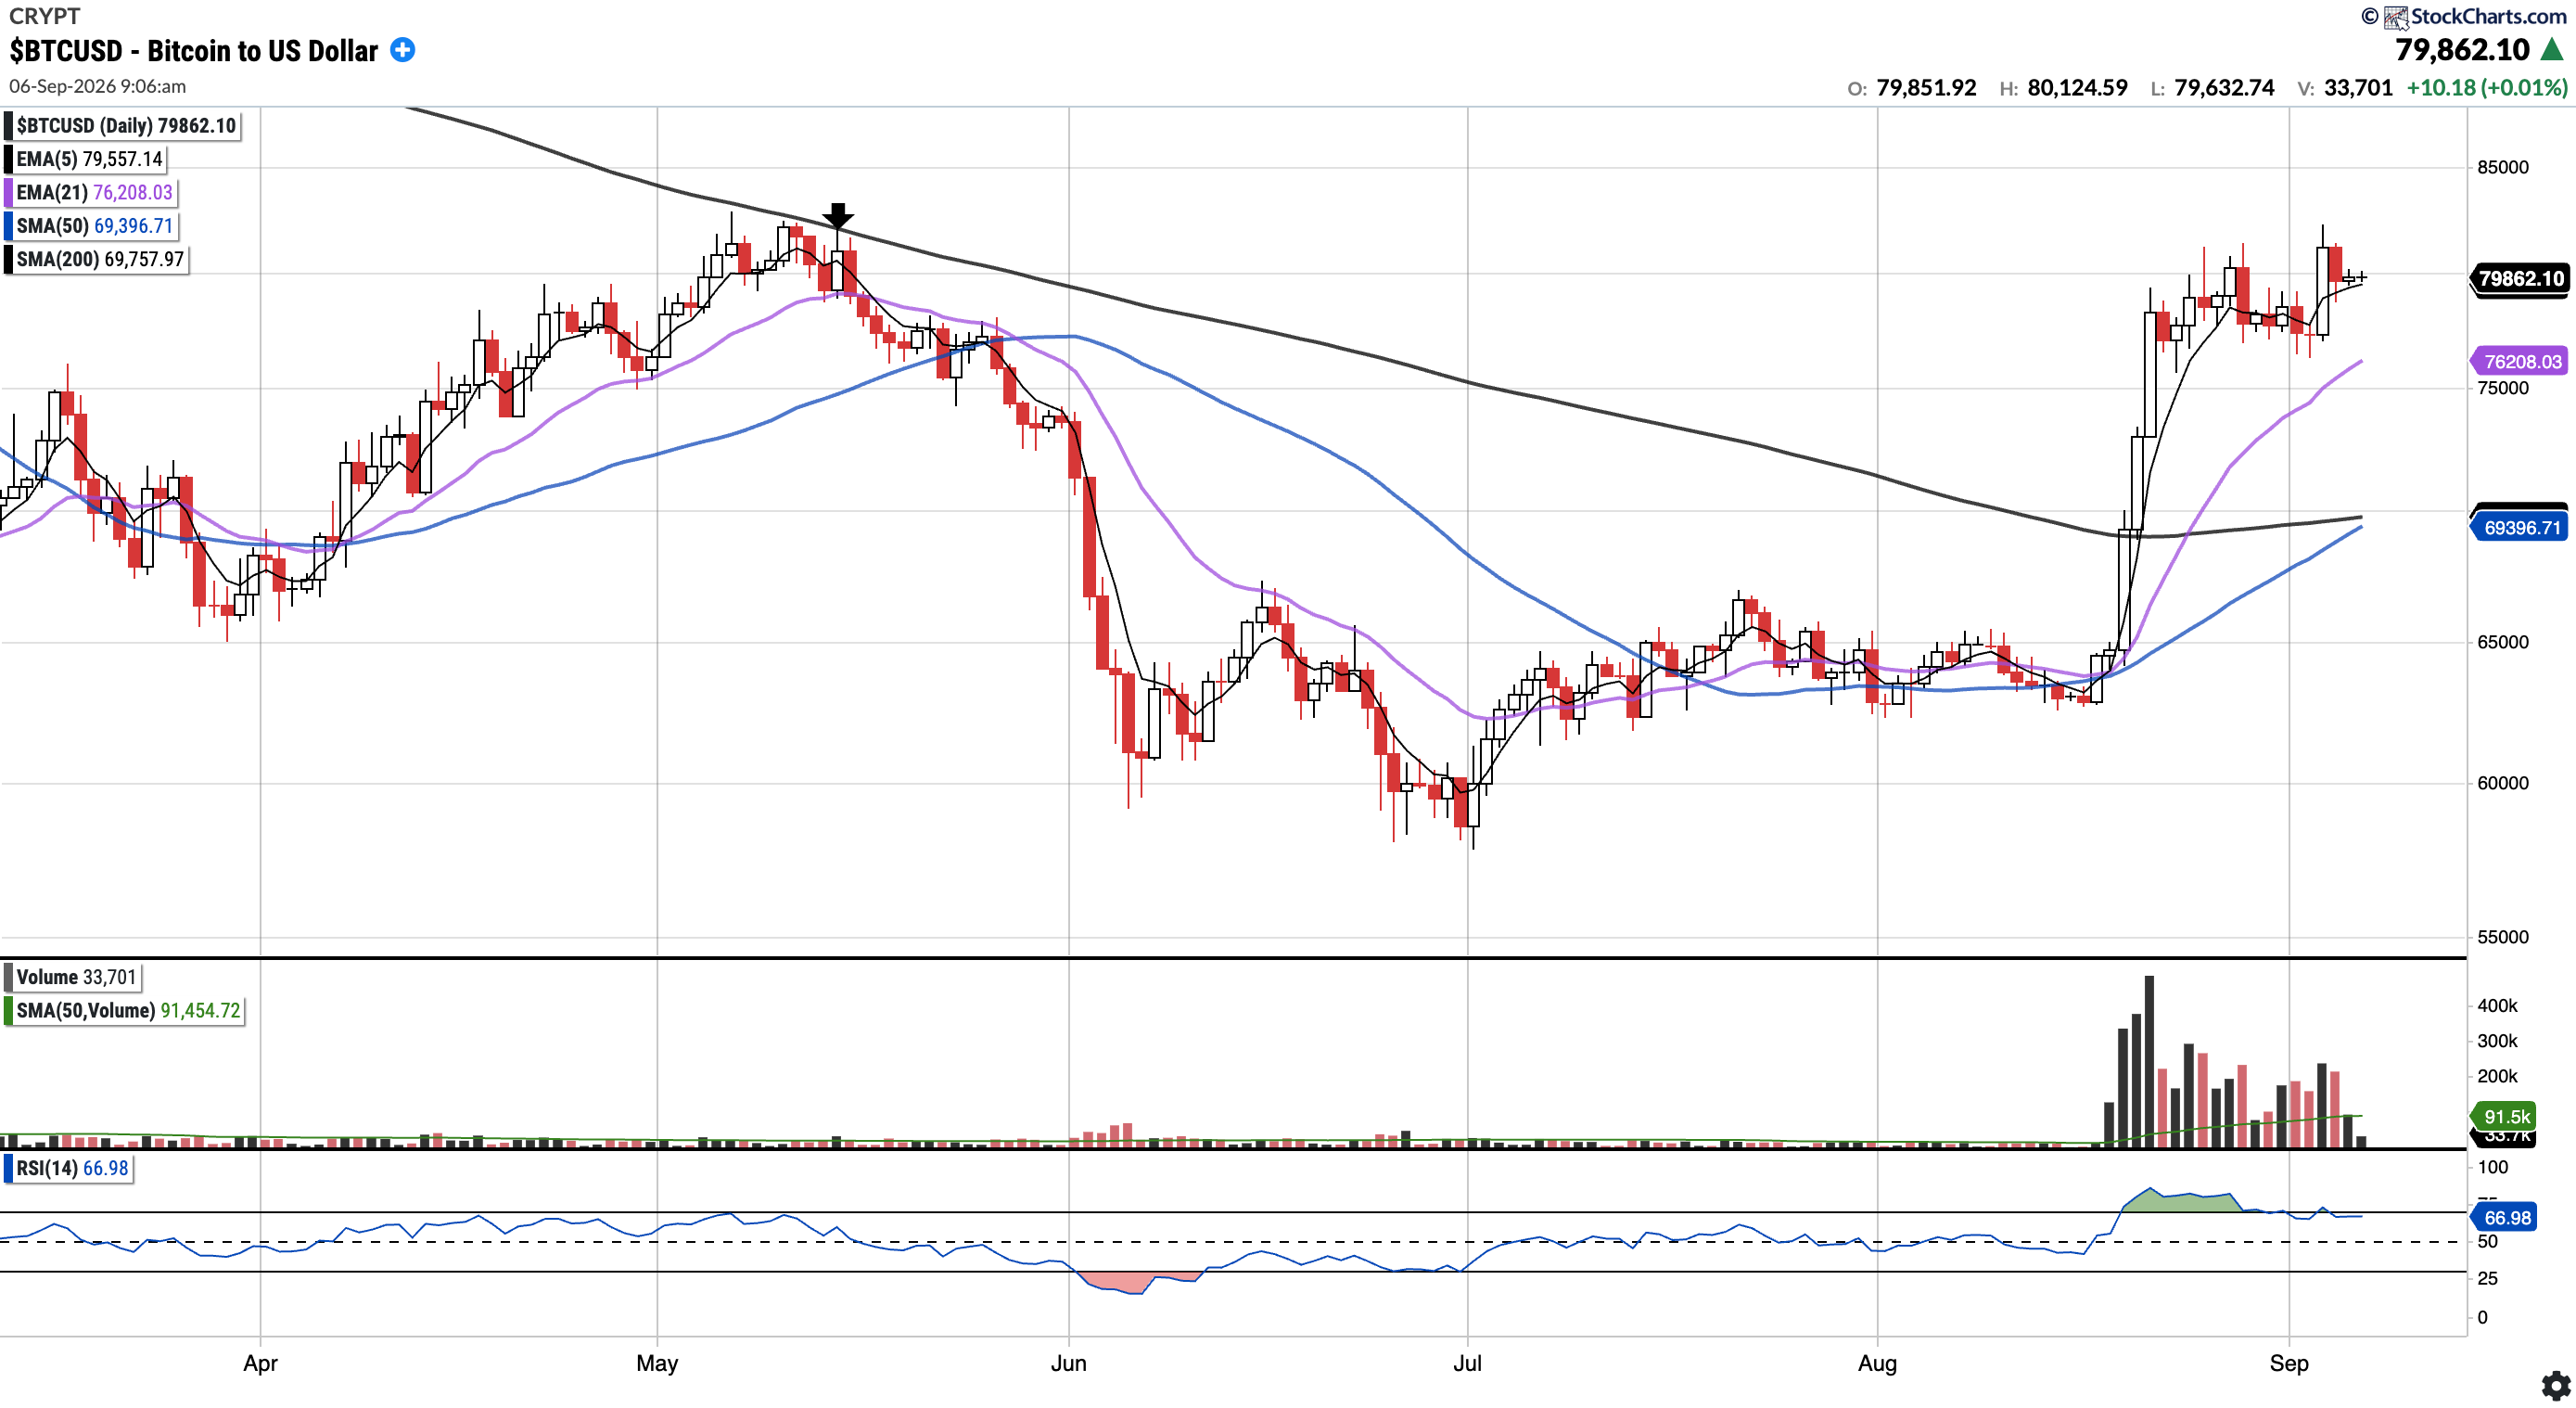
BTC (currently Long)
Currently trades at $79,963.63, 15.22% above the 50SMA and 14.64% above the 200SMA.
RSI 66.98
-9.88% YTD
Bitcoin consolidated nicely this week, closing with a small gain. While BTC remains above all key moving averages, the $82k mark is acting as resistance- a crucial level to the upside that bulls will want to see surpassed.
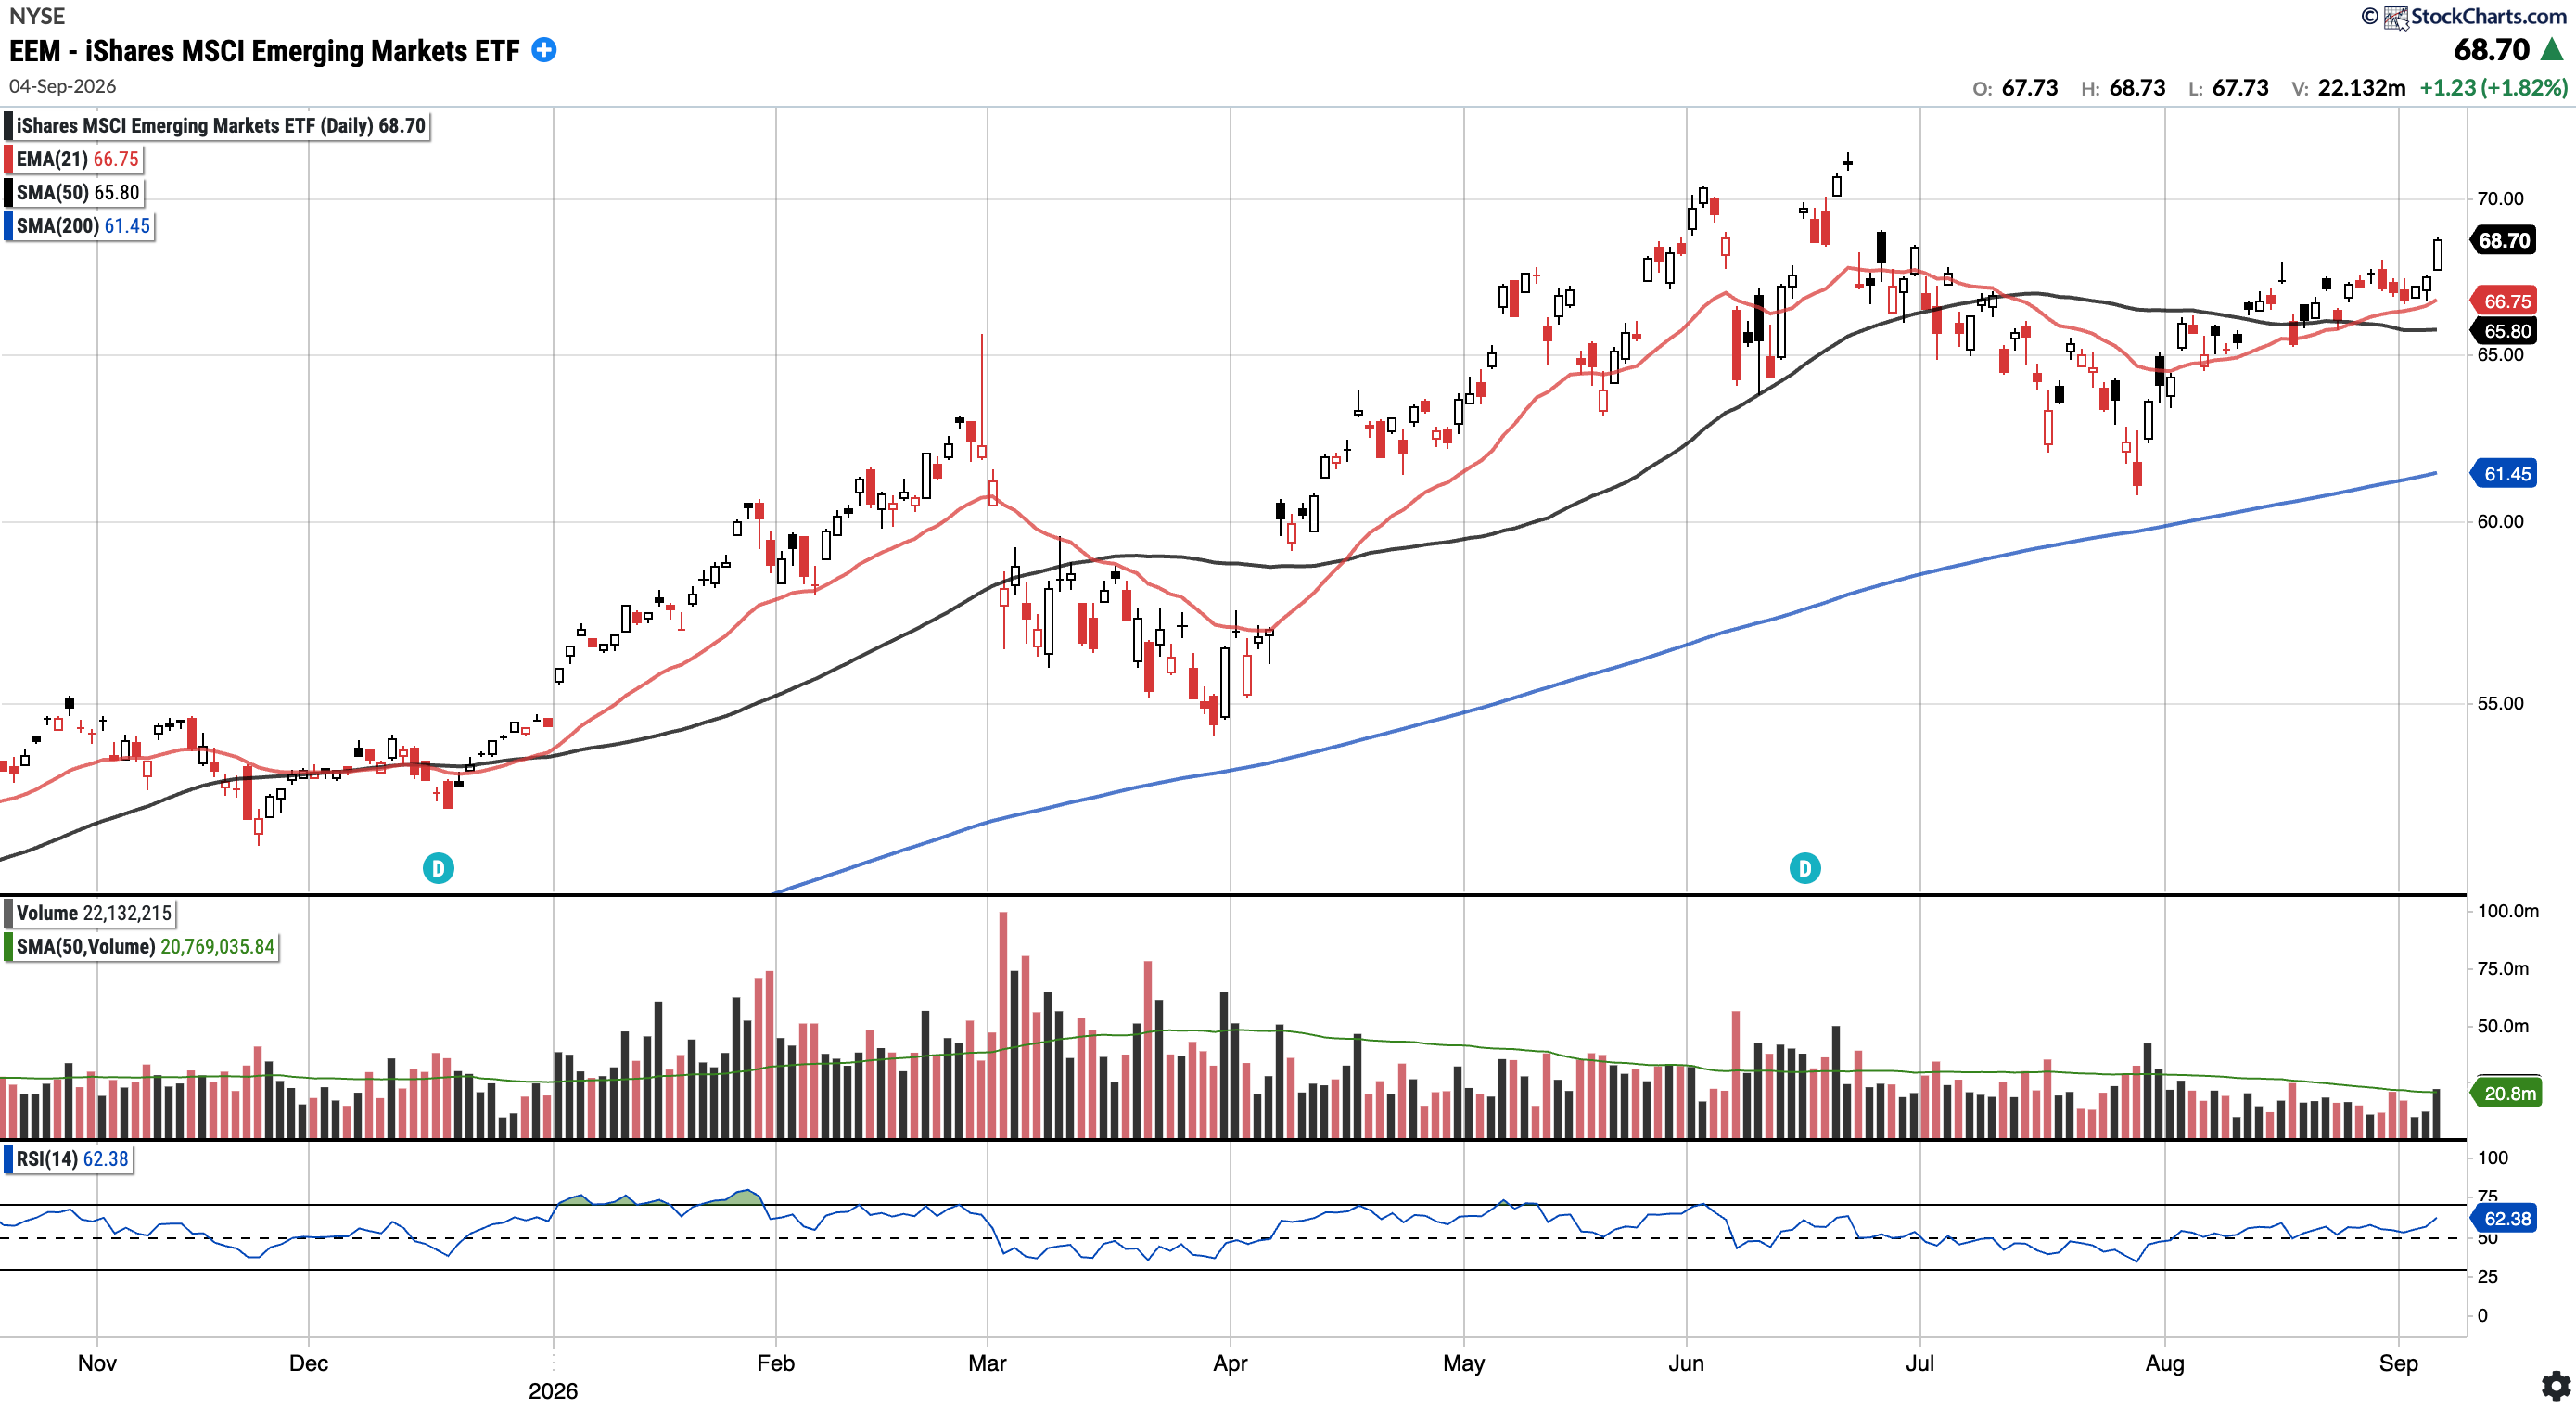
EEM
Currently trades at $68.70, 4.40% above the 50SMA and 11.80% above the 200SMA.
RSI 62.38
22.79% YTD
EEM broke above its August high to continue its uptrend, putting in a strong candle to close the week. Price held the 21EMA as support once more before pushing higher. Last week I highlighted that: “the 21EMA has now crossed above the 50SMA, a constructive signal for trend continuation.” This week saw exactly that as the trend remains positive.
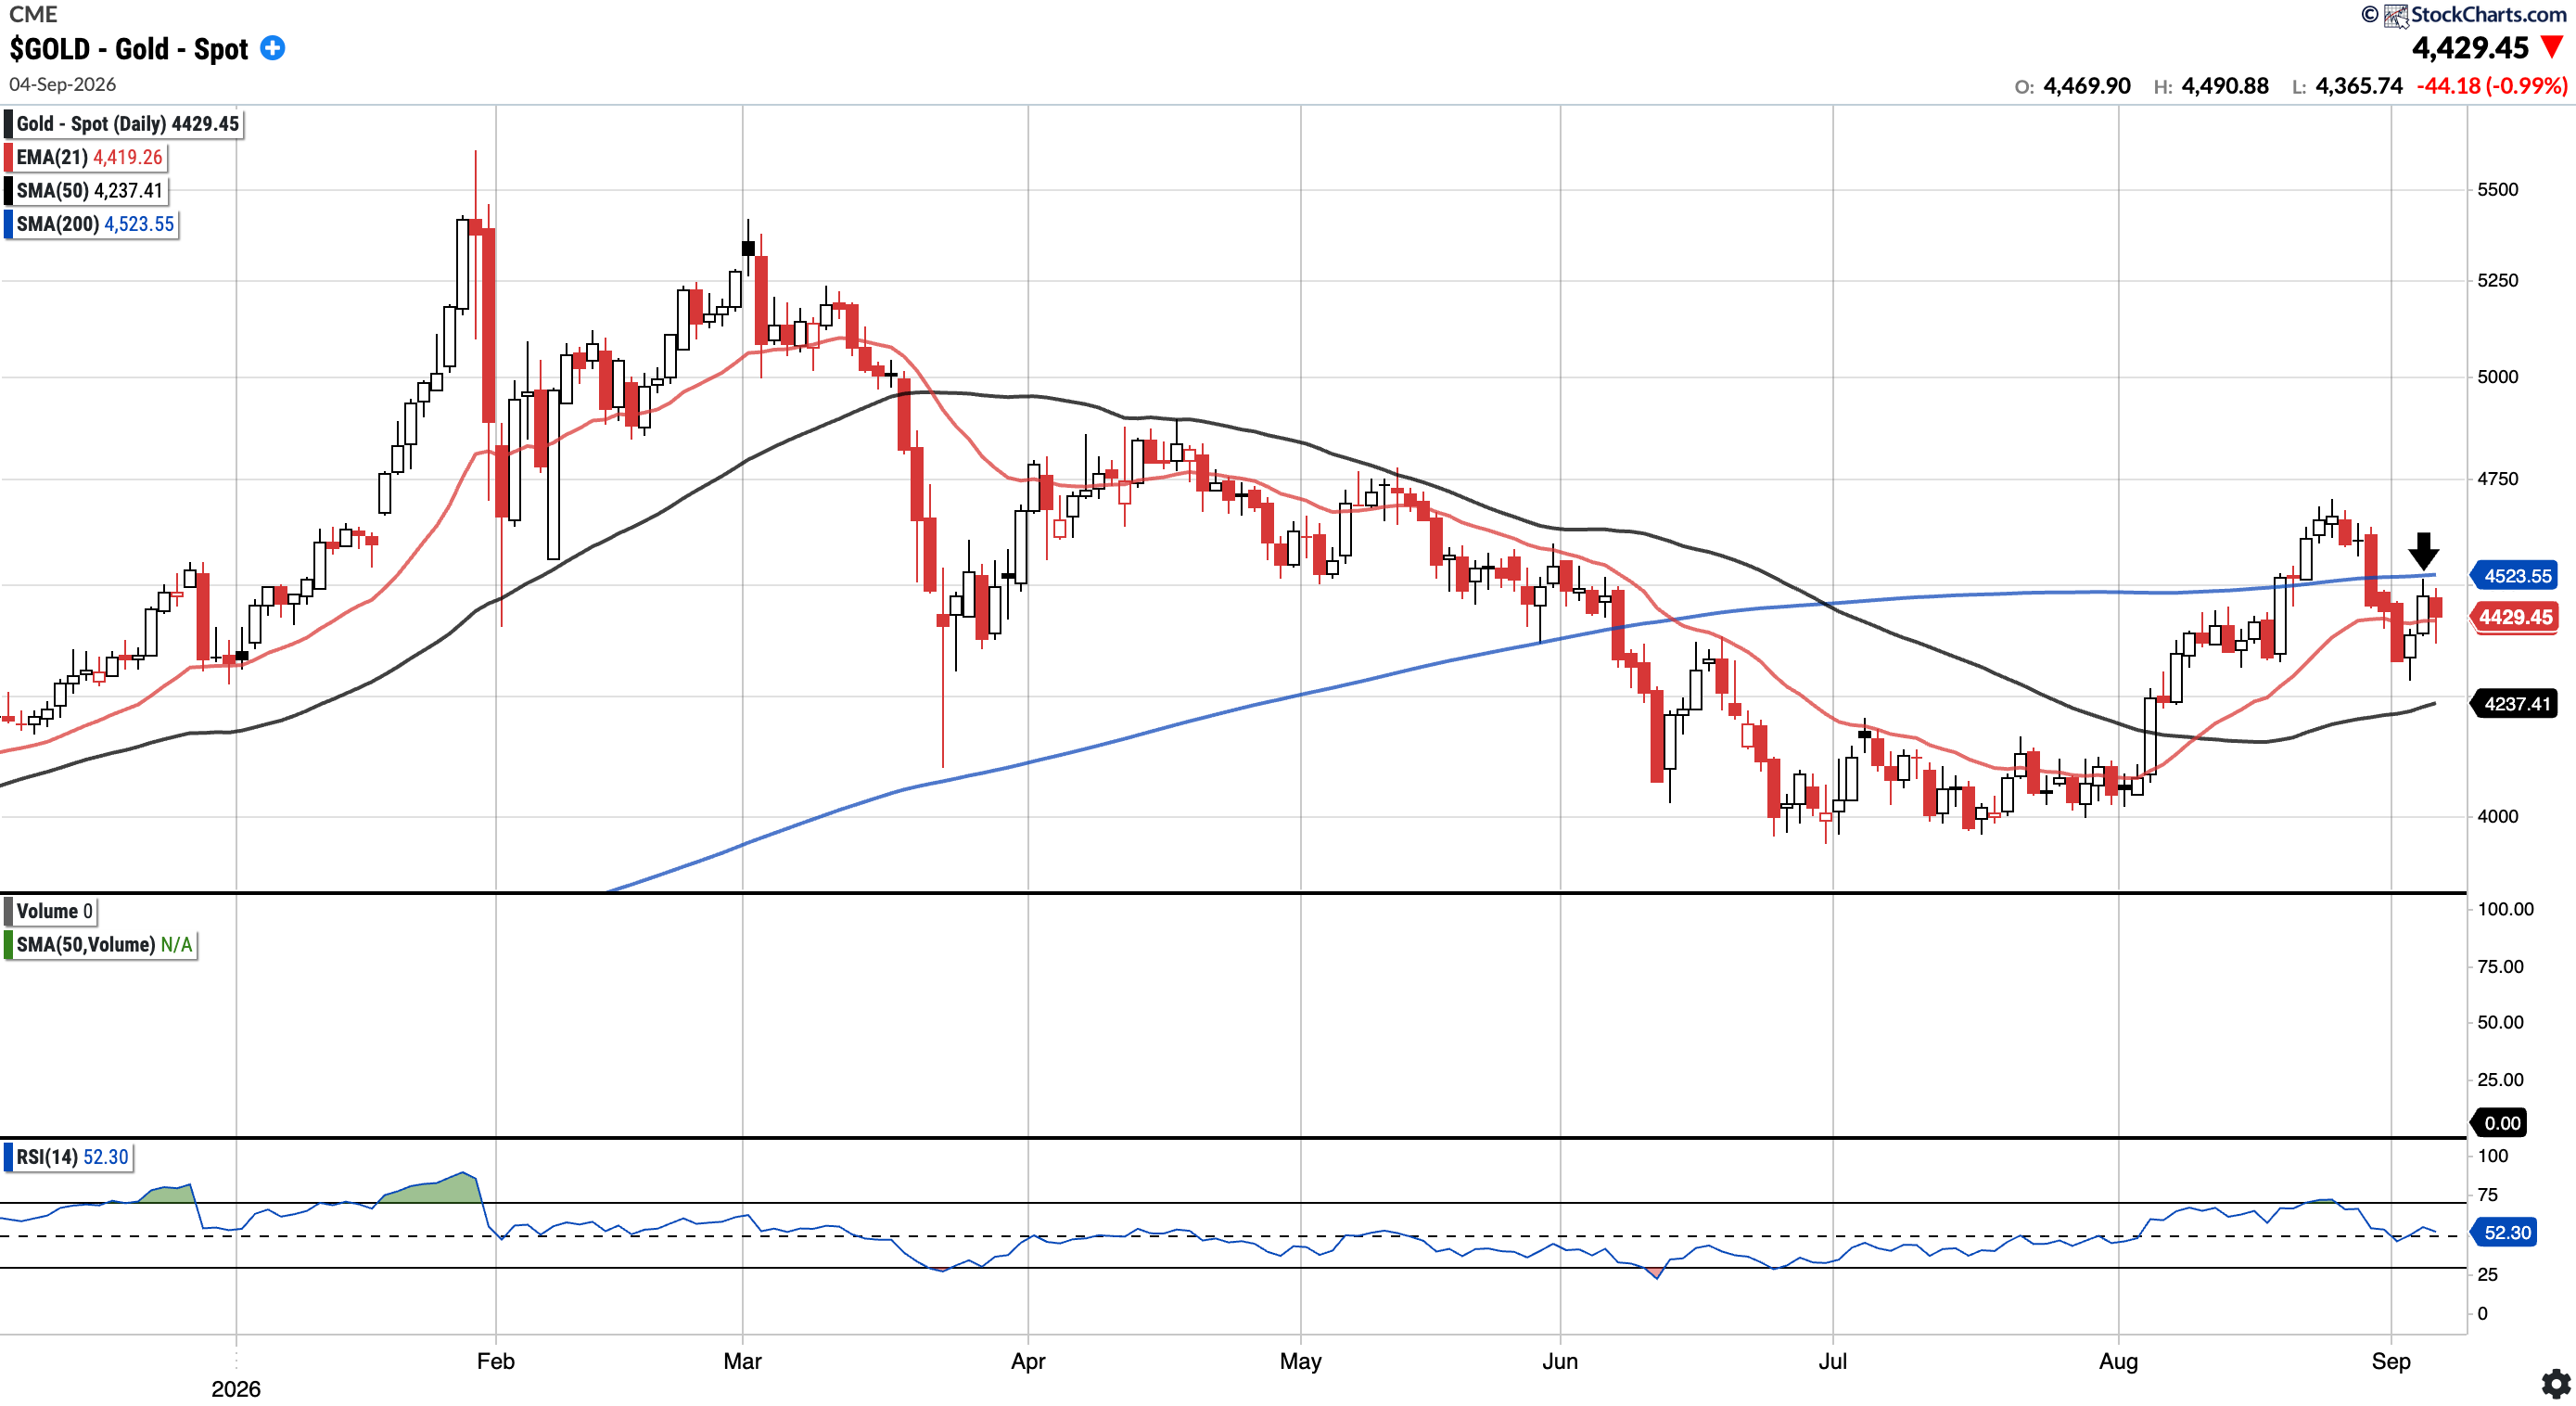
GOLD (Long Physical)
Currently trades at $4,454.08, 4.53% above the 50SMA and 2.08% below the 200SMA.
RSI 52.30
2.47% YTD
Gold was rejected at the underside of it’s 200 SMA this (see arrow). While this week’s selloff has reversed from its lows, bulls will want to see price clear the 200SMA soon.
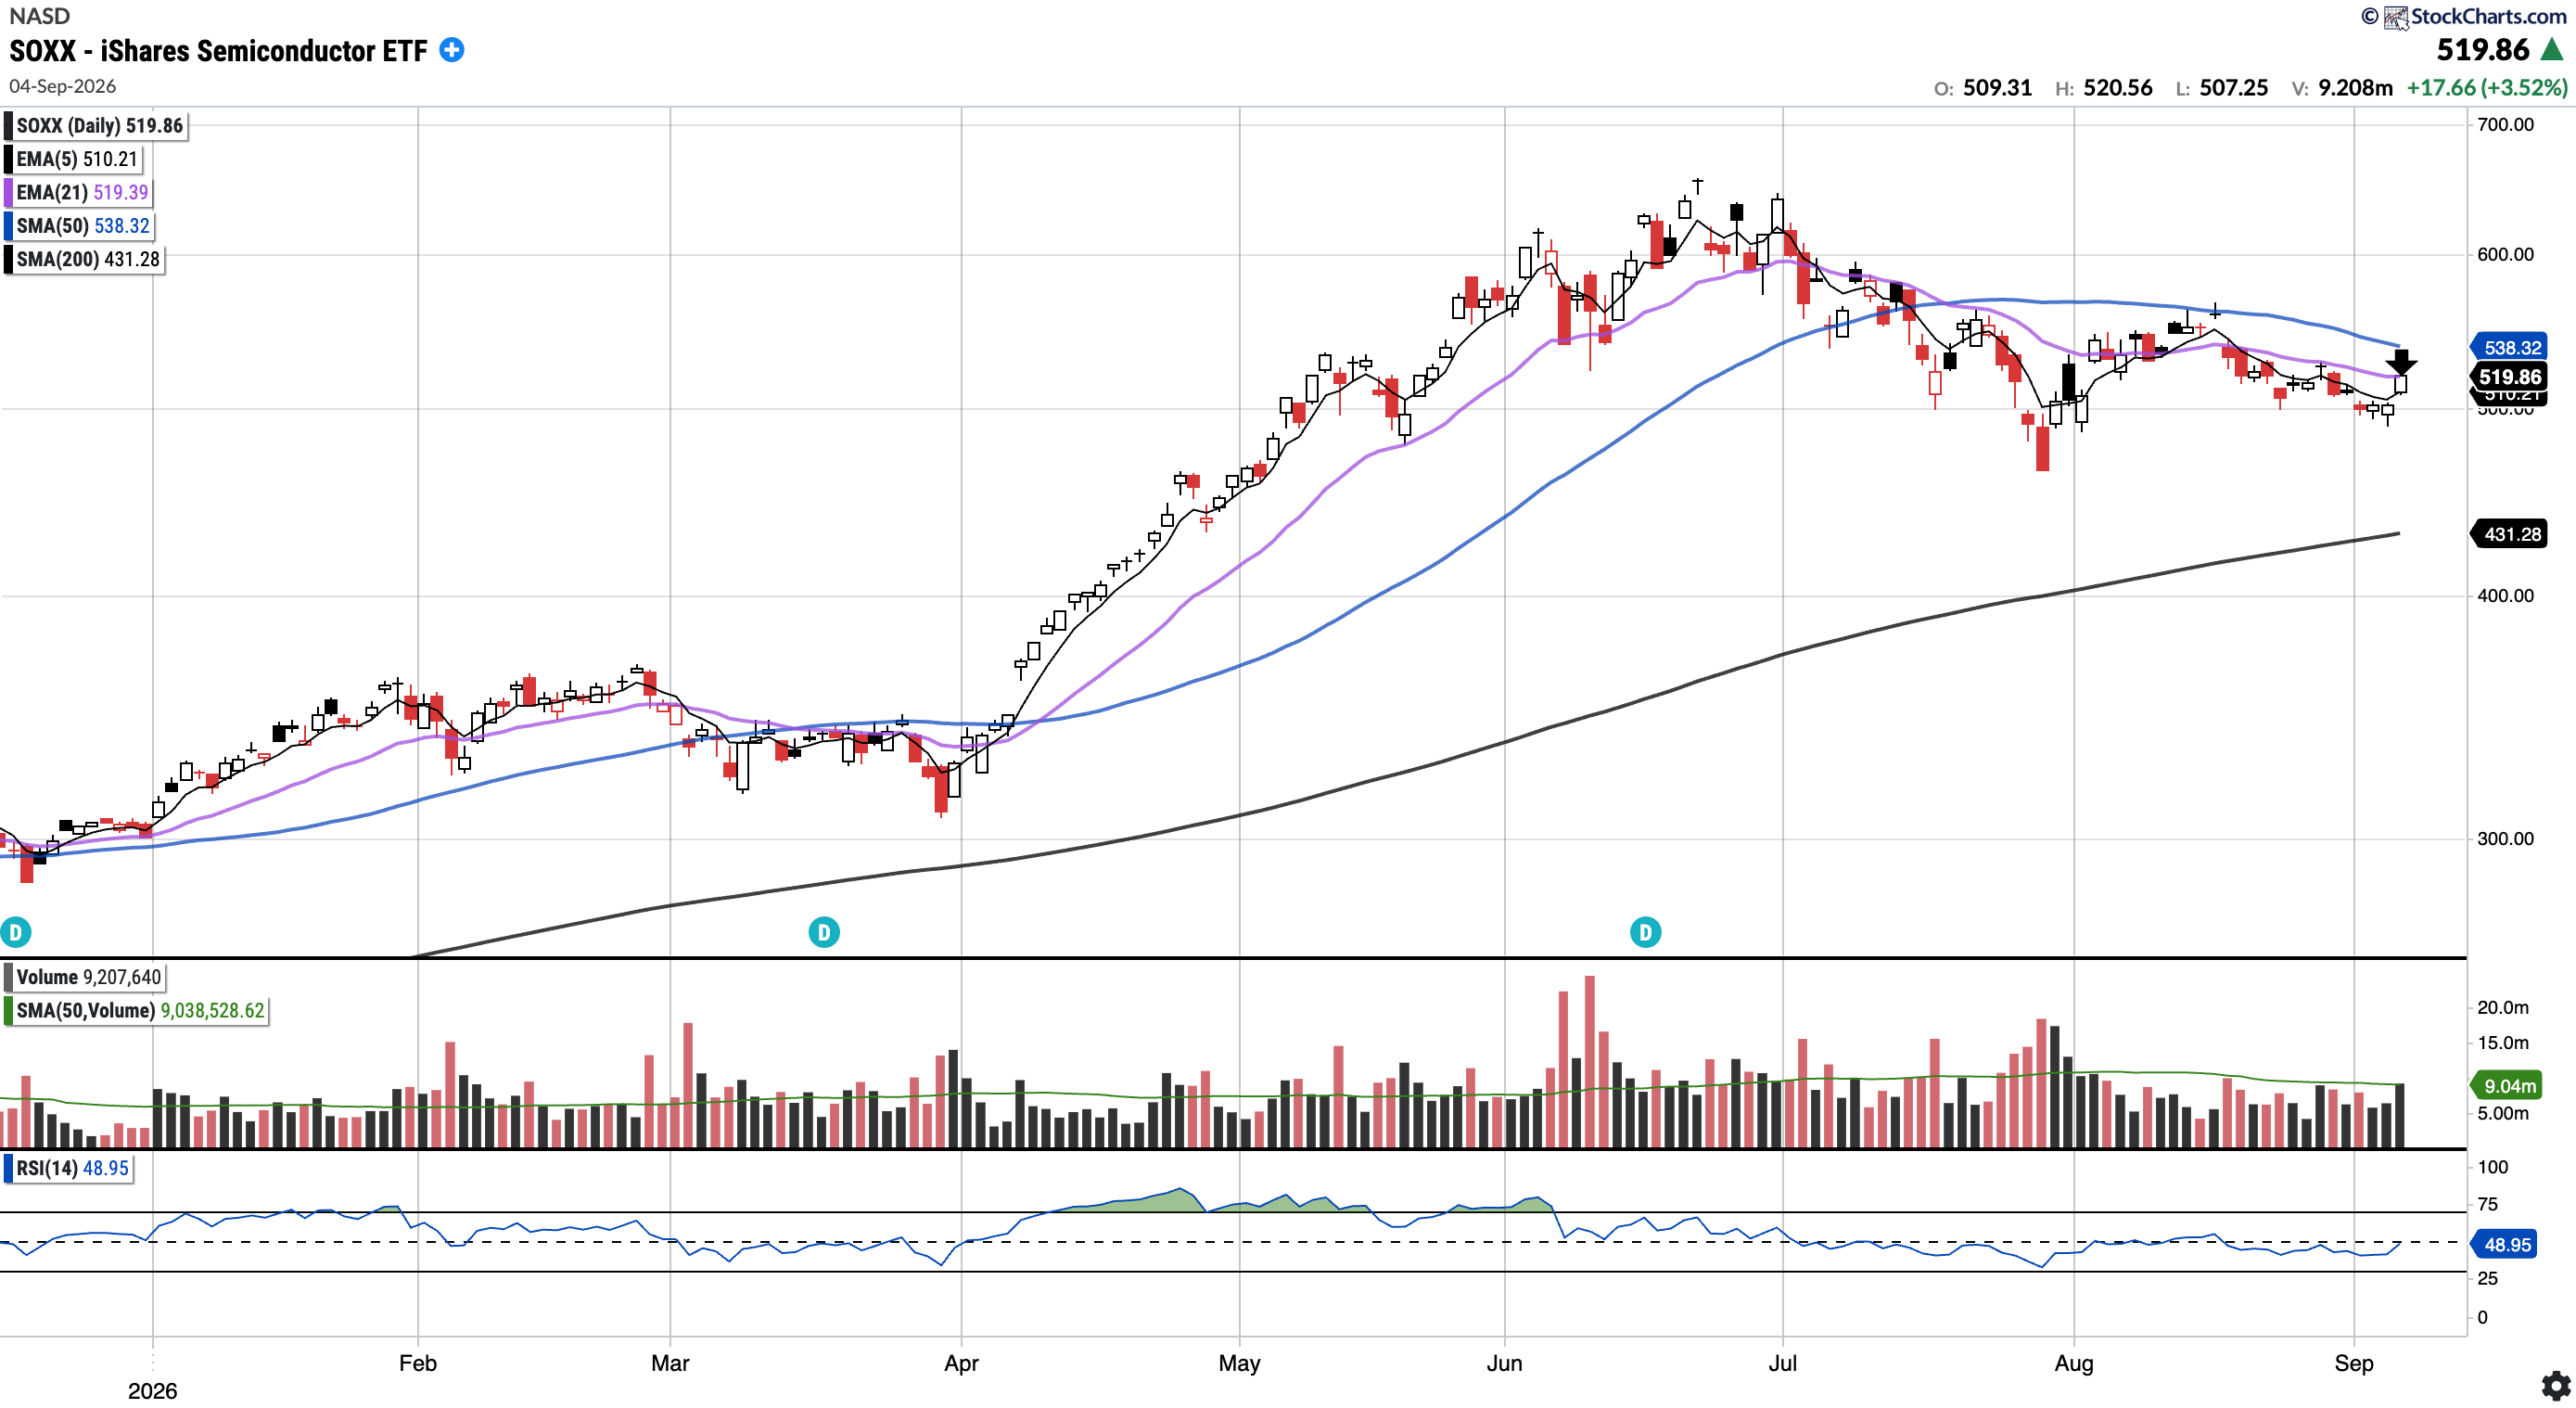
SOXX
Currently trades at $519.86, 3.43% below the 50SMA and 20.54% above the 200SMA.
RSI 48.95
65.90% YTD
SOXX continues to trade below its SMA 50, a level which has served as resistance, though it did close barely above the 21 EMA. Bulls will want to see both the 21EMA and the 50SMA reclaimed to restore longer-term momentum.
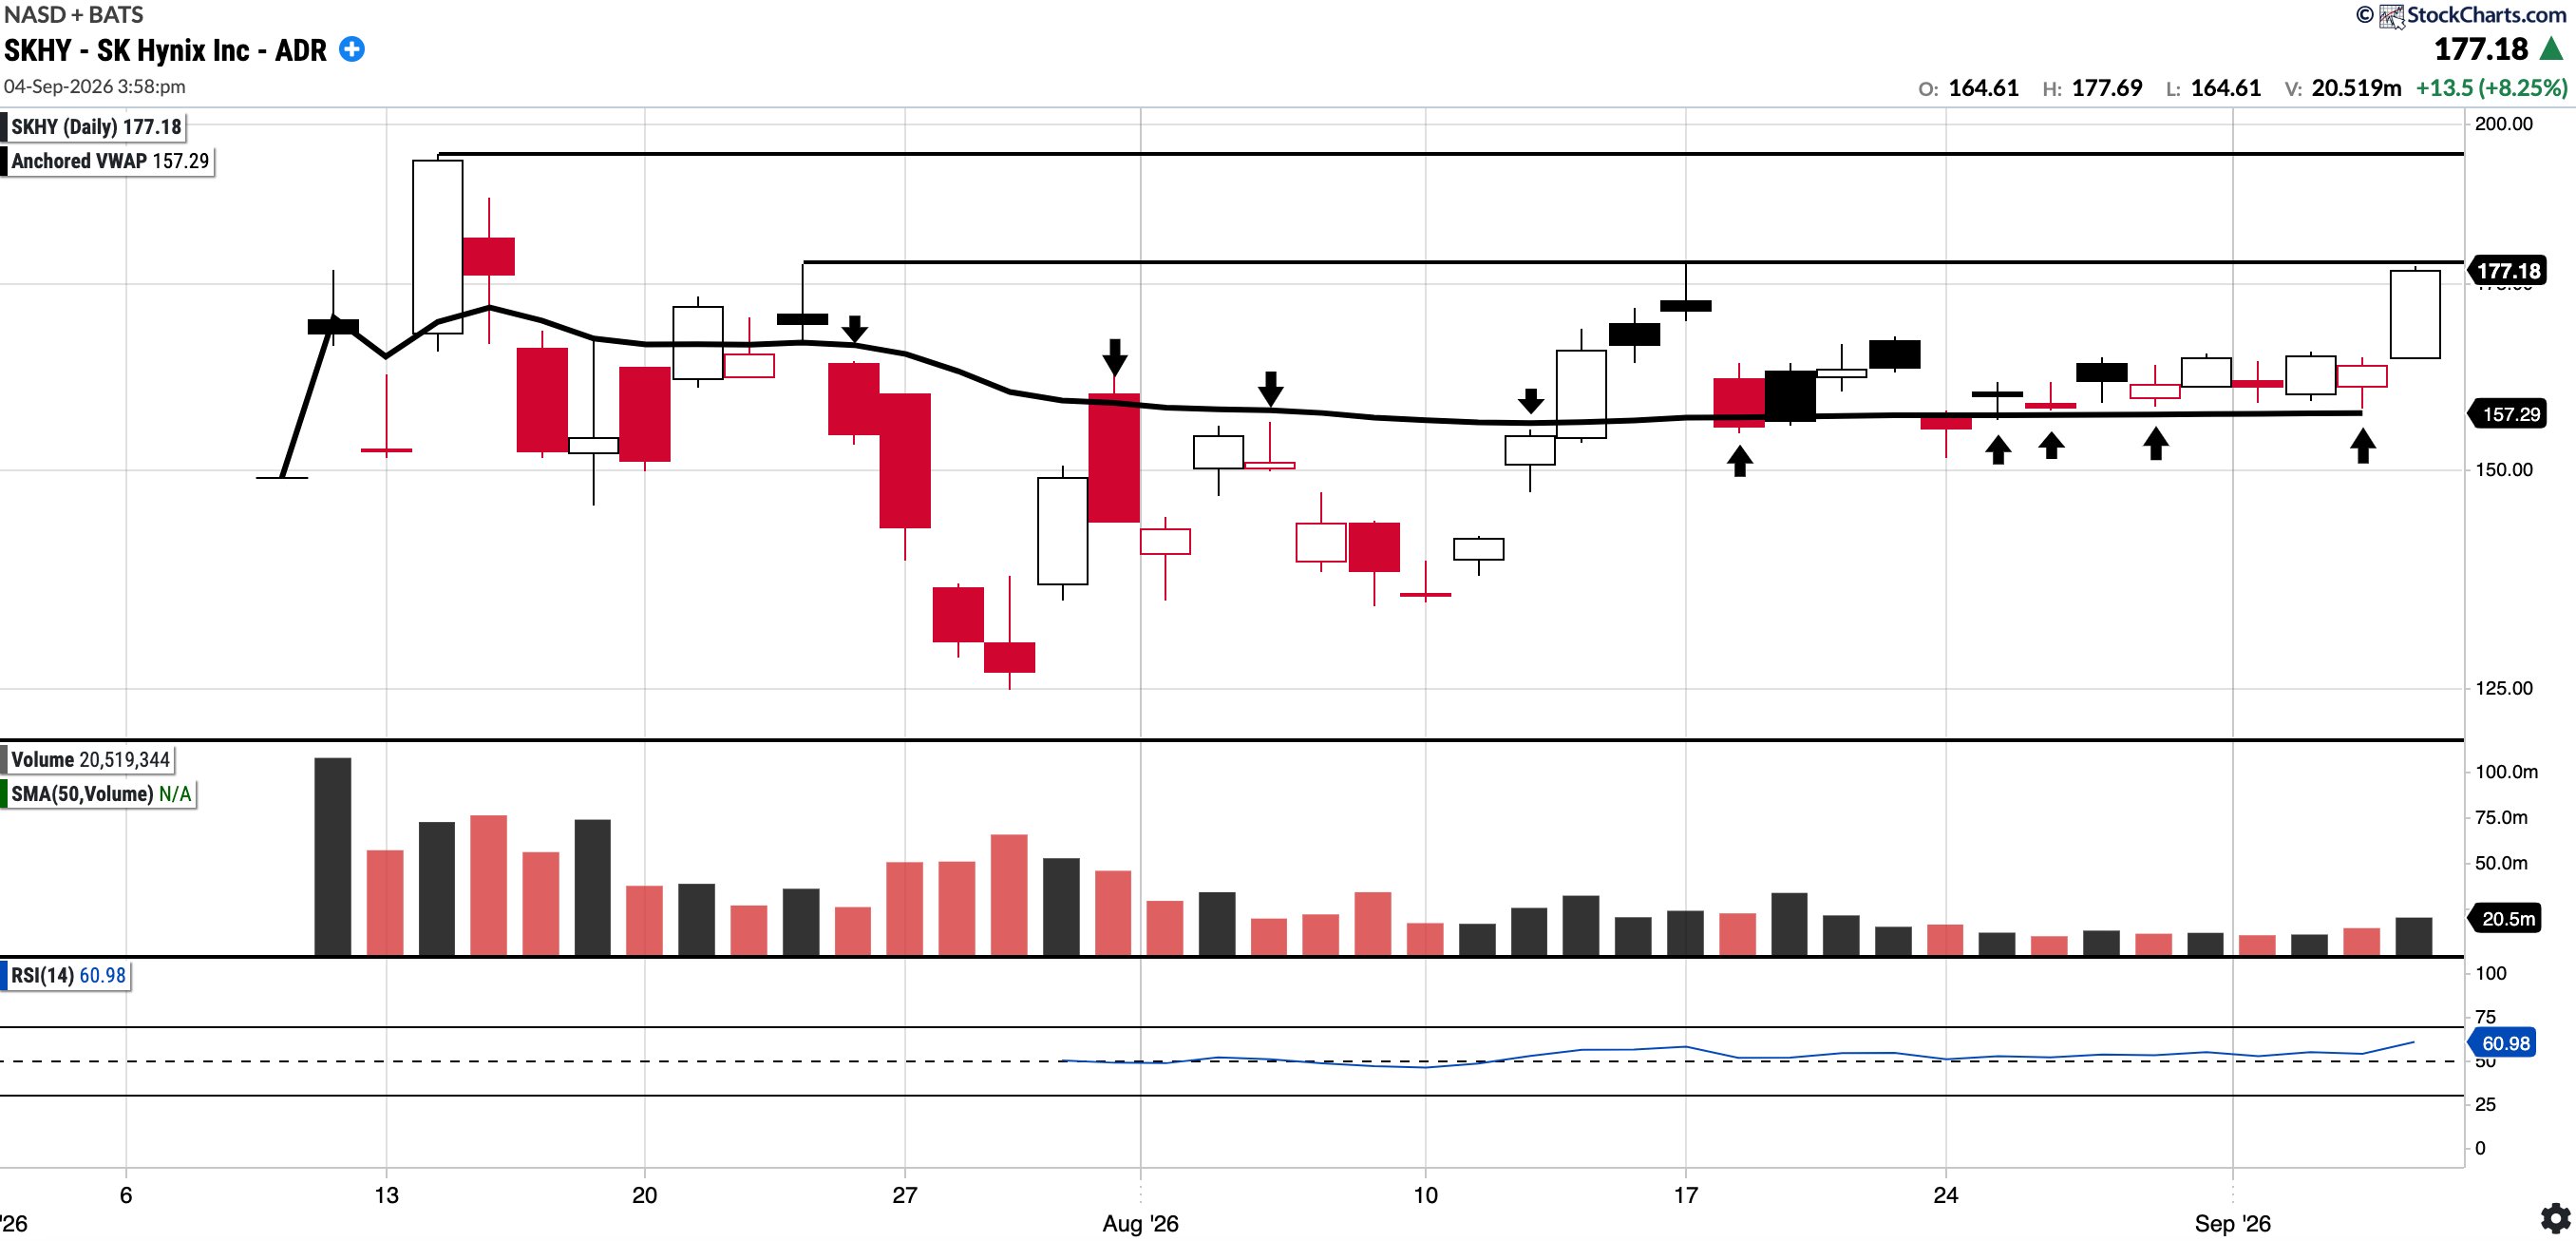
SKHY (Currently Long)
Currently trades at $177.18
RSI 60.98
5.35% YTD
SKHY has been holding its IPO-anchored VWAP (see arrows), trading in a tight range much like MU and SNDK did before their breakouts, and rallied into Friday's close. Tuesday's action will be worth watching to see whether this strength carries through toward the $178 resistance level. Bulls will want to see the IPO AVWAP continue to hold, a breakout above $178 resistance, and a push toward new all-time highs.
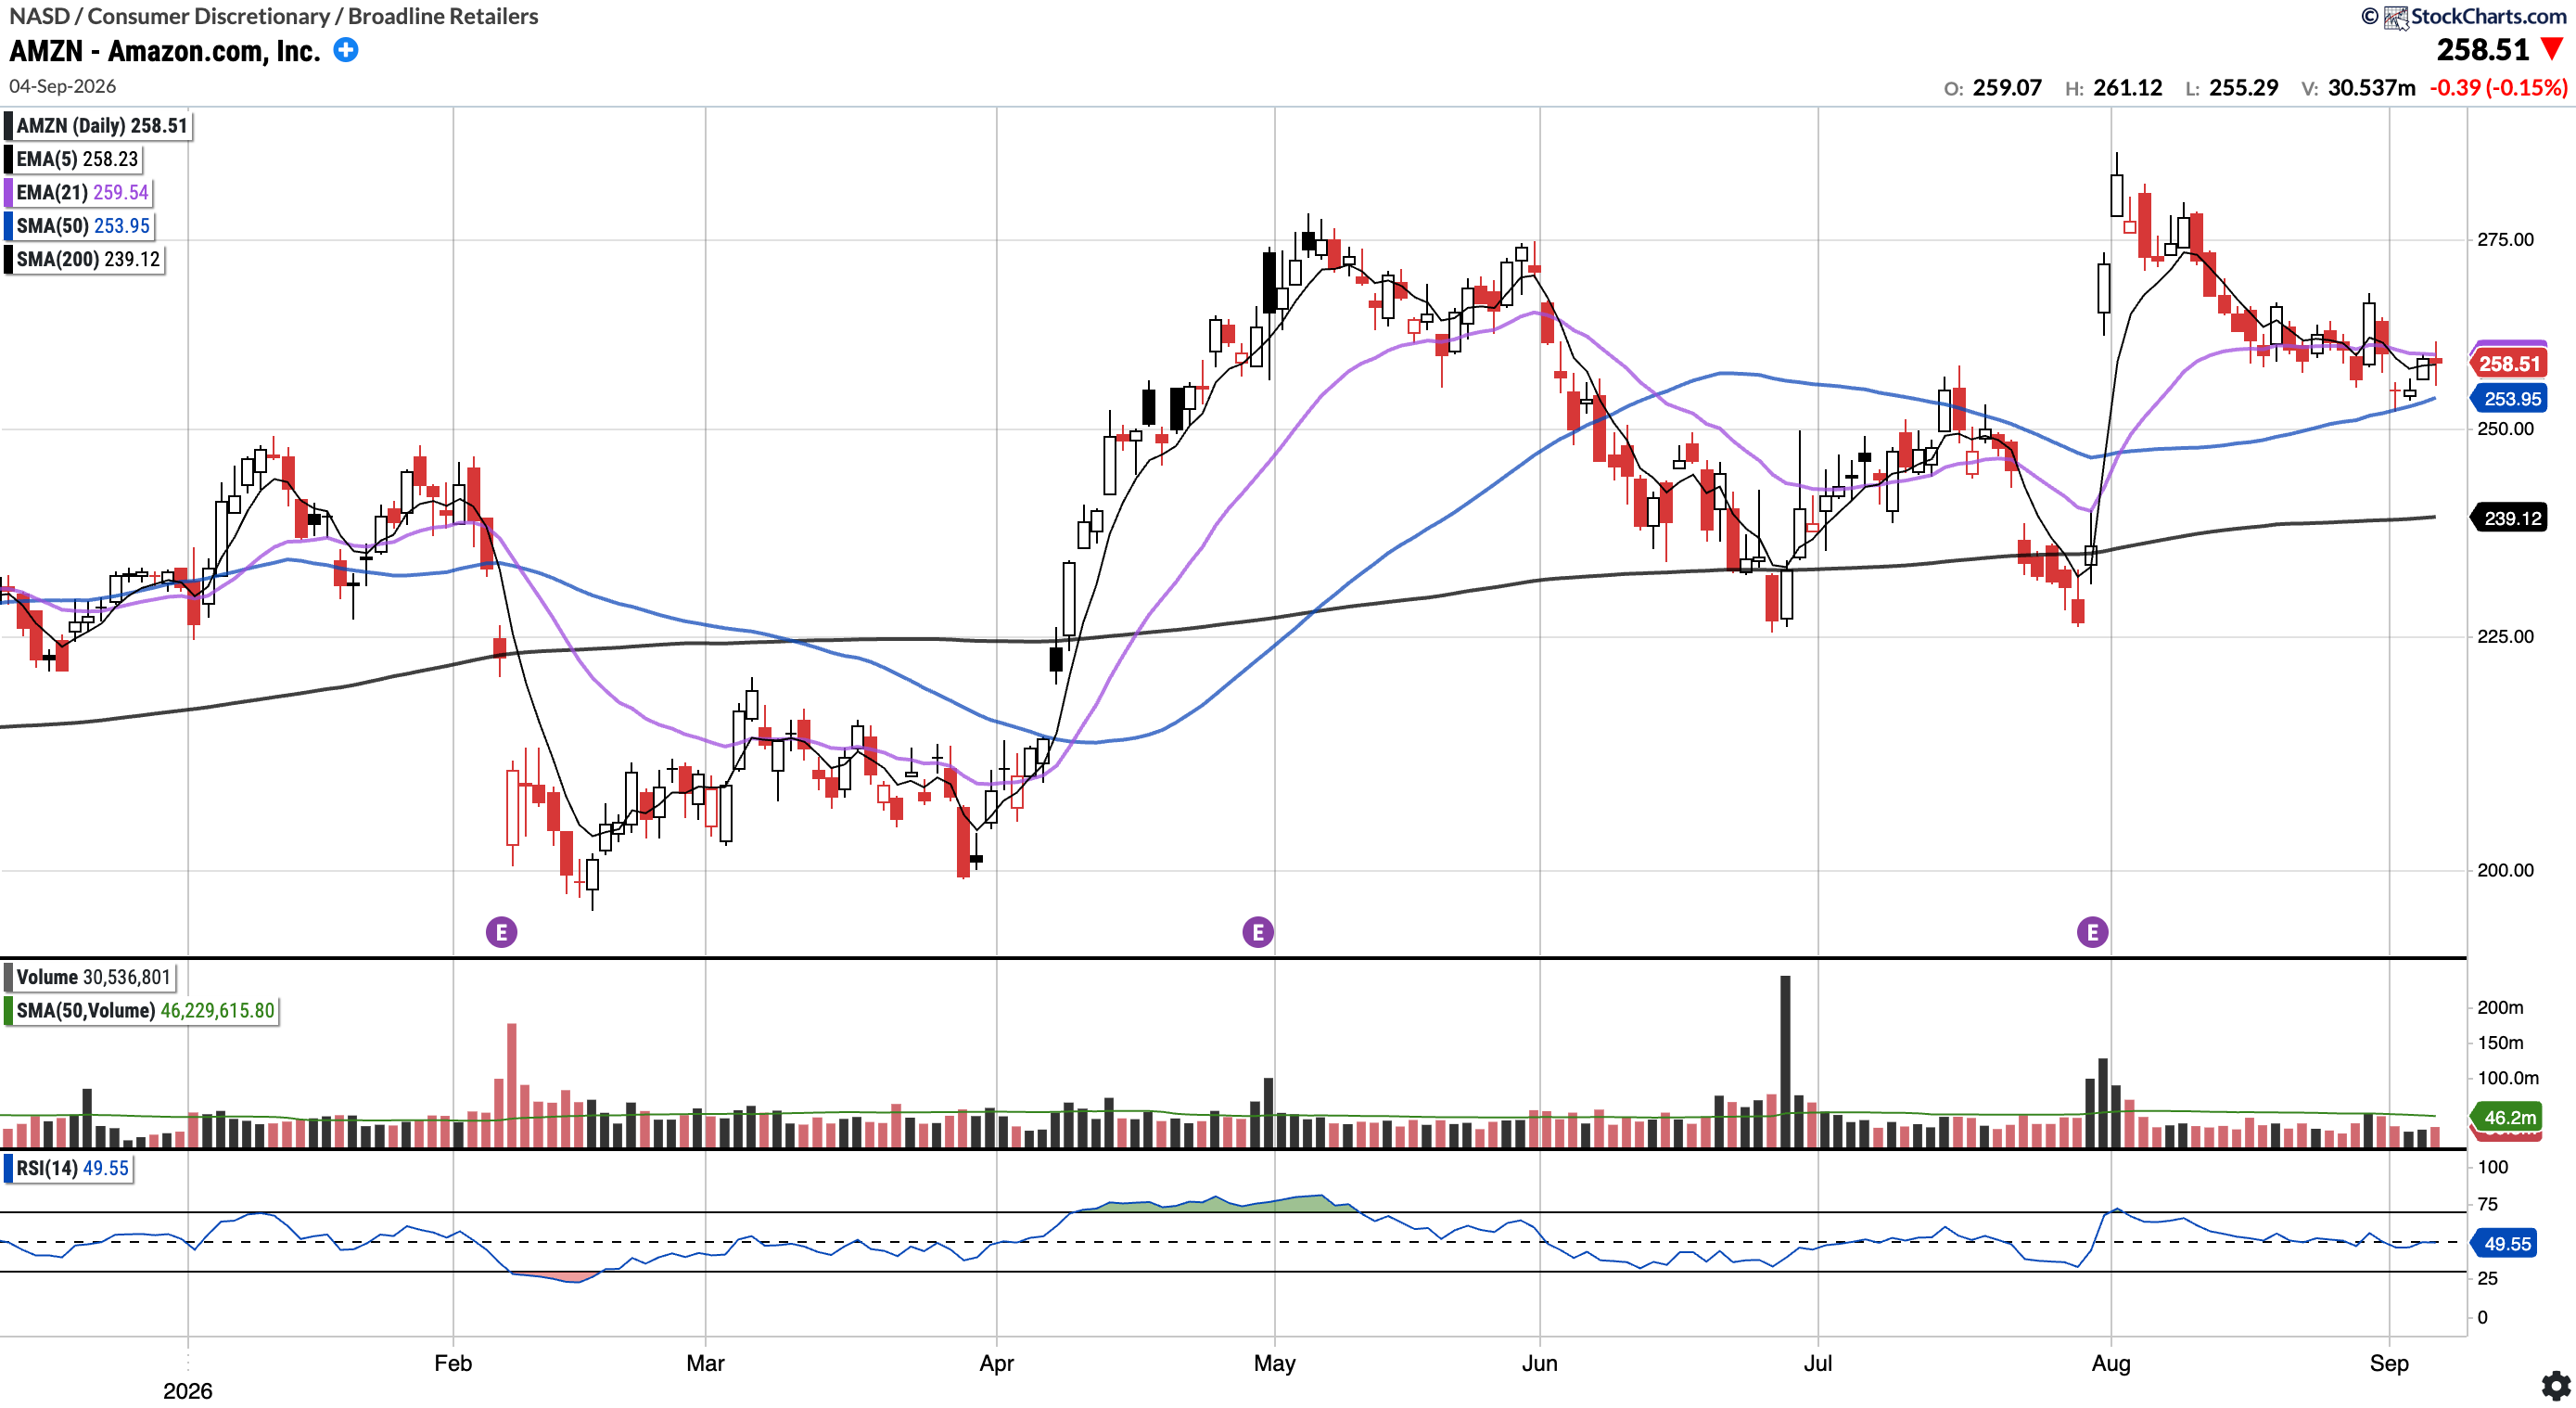
AMZN (Currently Long)
Currently trades at $258.51, 1.80% above the 50SMA and 8.11% above the 200SMA.
RSI 49.55
14.13% YTD
AMZN continued its pull back, this time to test the 50SMA day, which served as a support where it consolidated.. Bulls will want to see constructive momentum from here onward, with RSI breaking above 50. If price breaks below the 50SMA, we could see a selloff to pre-earnings gap fill.
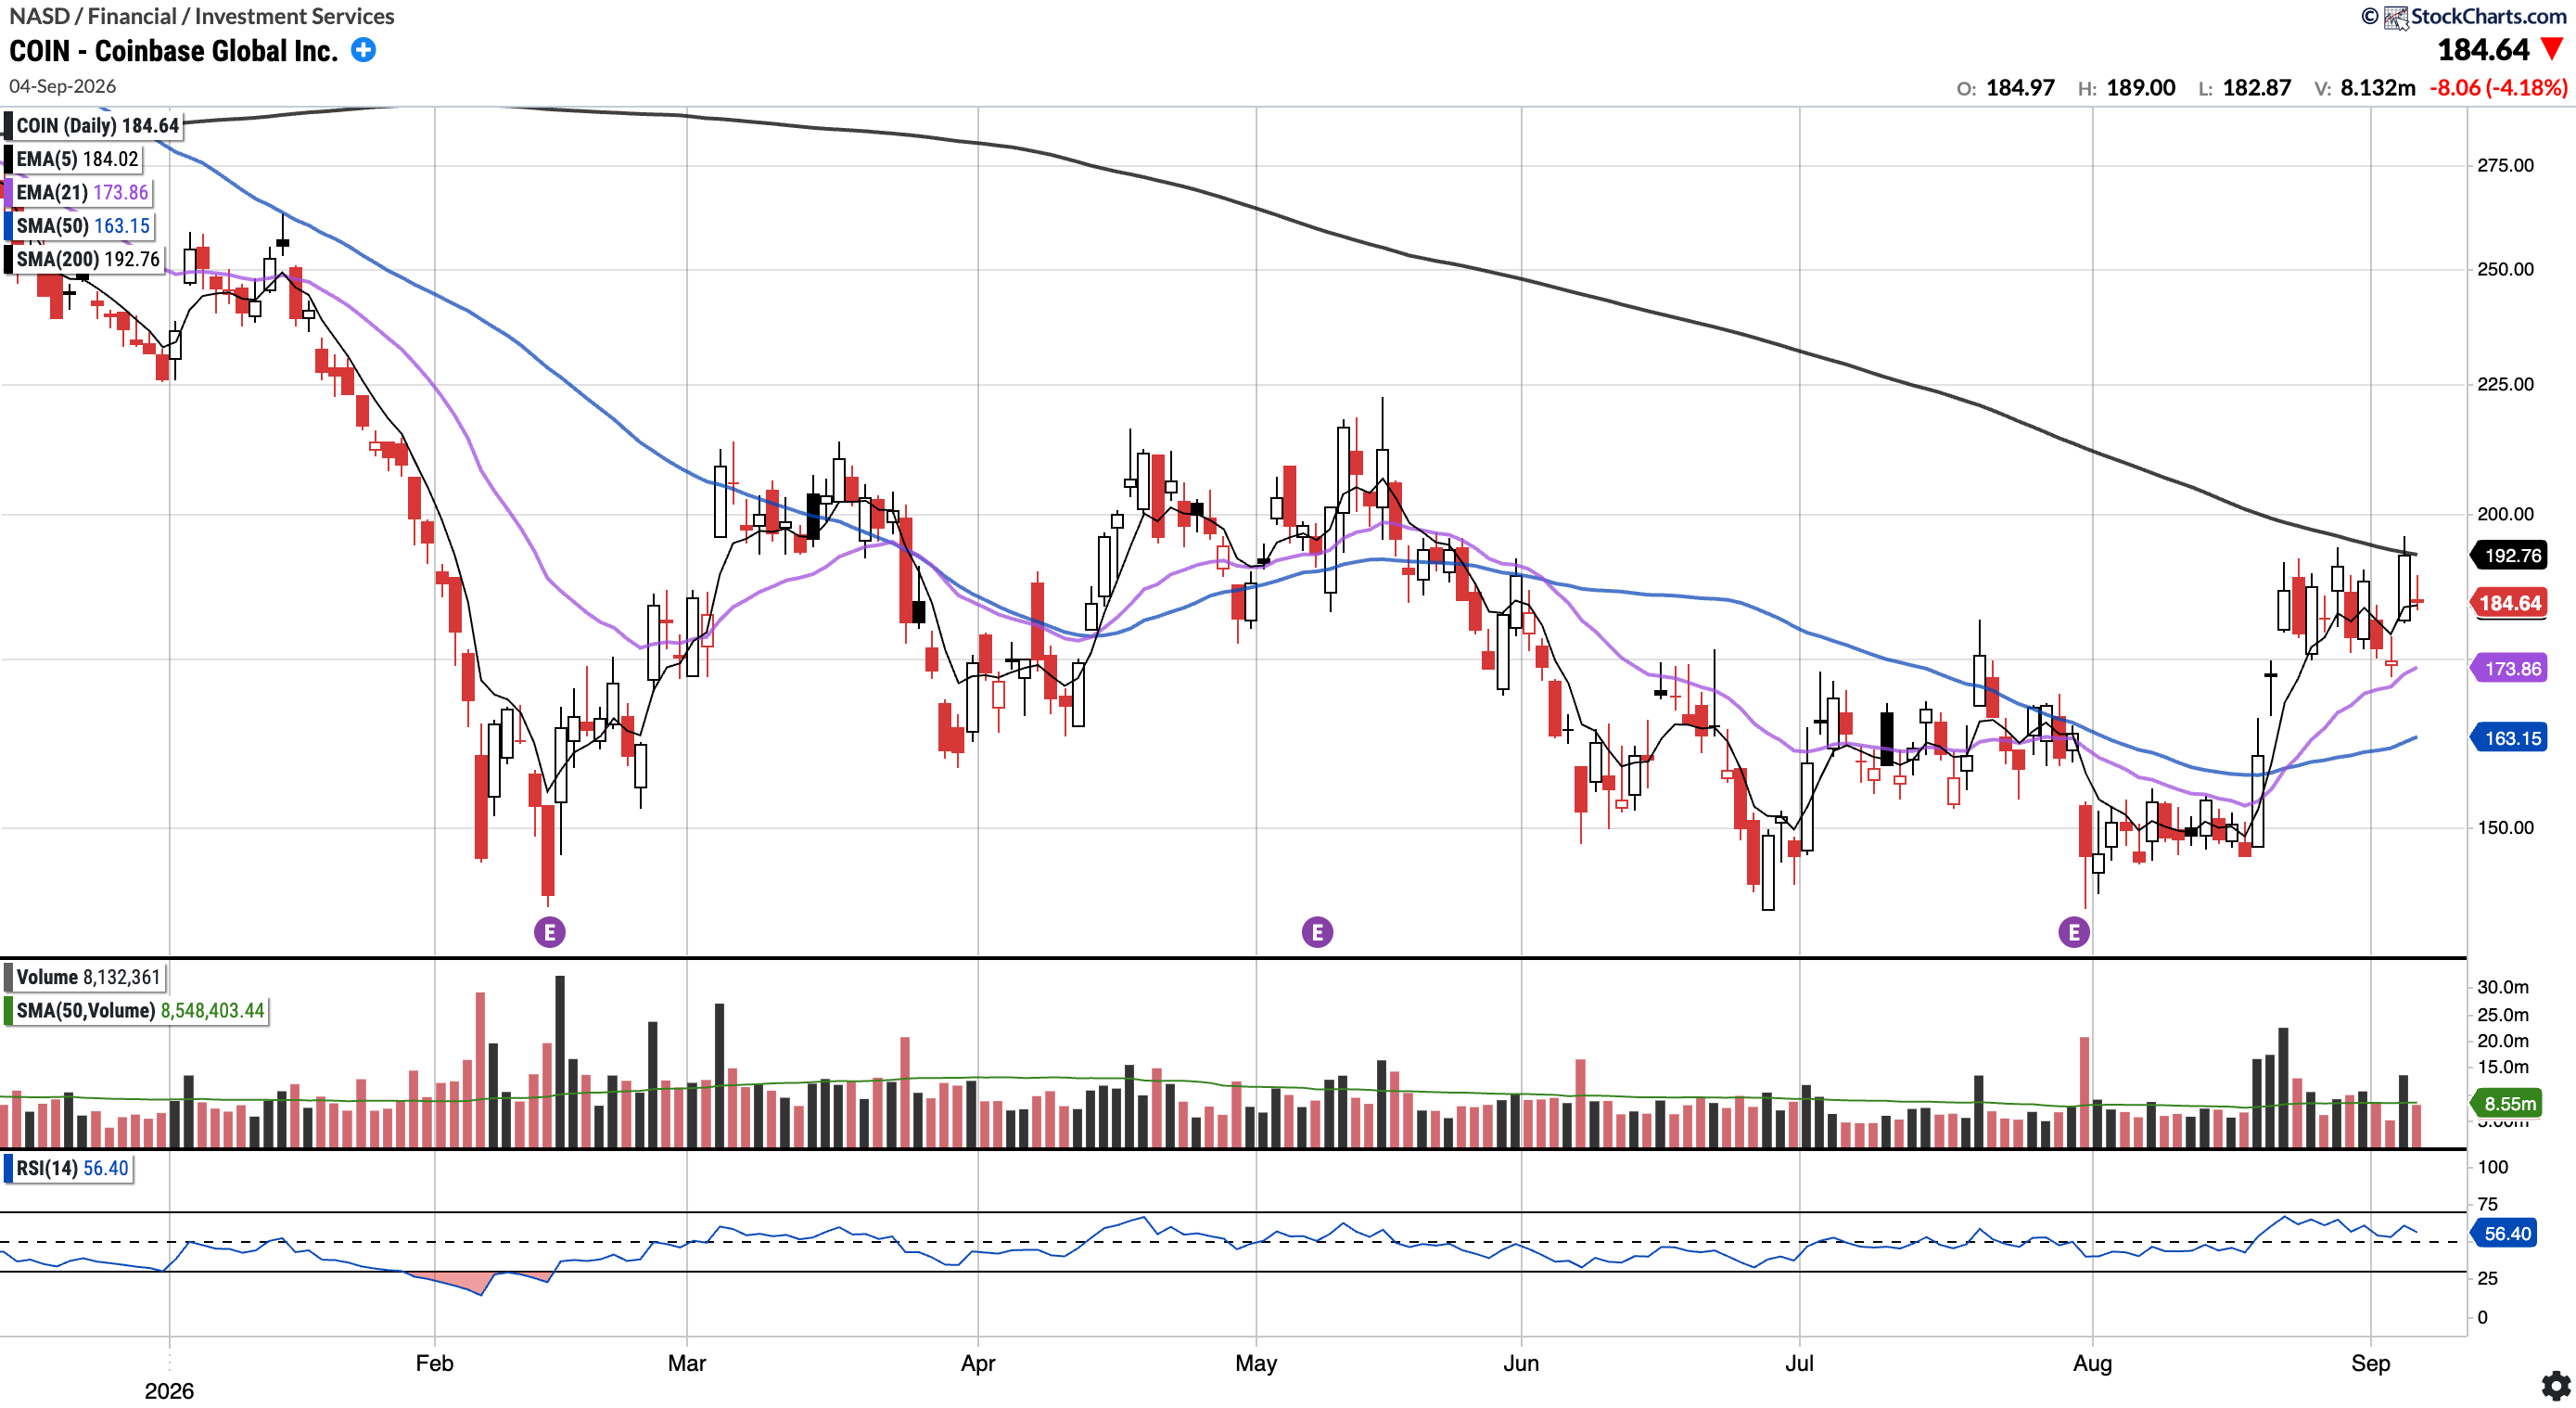
COIN (Currently Long)
Currently trades at $184.64, 13.17% above the 50SMA and 4.21% below the 200SMA.
RSI 56.40
-21.94% YTD
COIN's rally last week ran almost exactly into the 200 SMA I flagged as a resistance (in last week’s report), rejecting there before reversing. Price has since traded in and around that level. Bulls will want to see the 200 SMA reclaimed on a more decisive attempt this time.
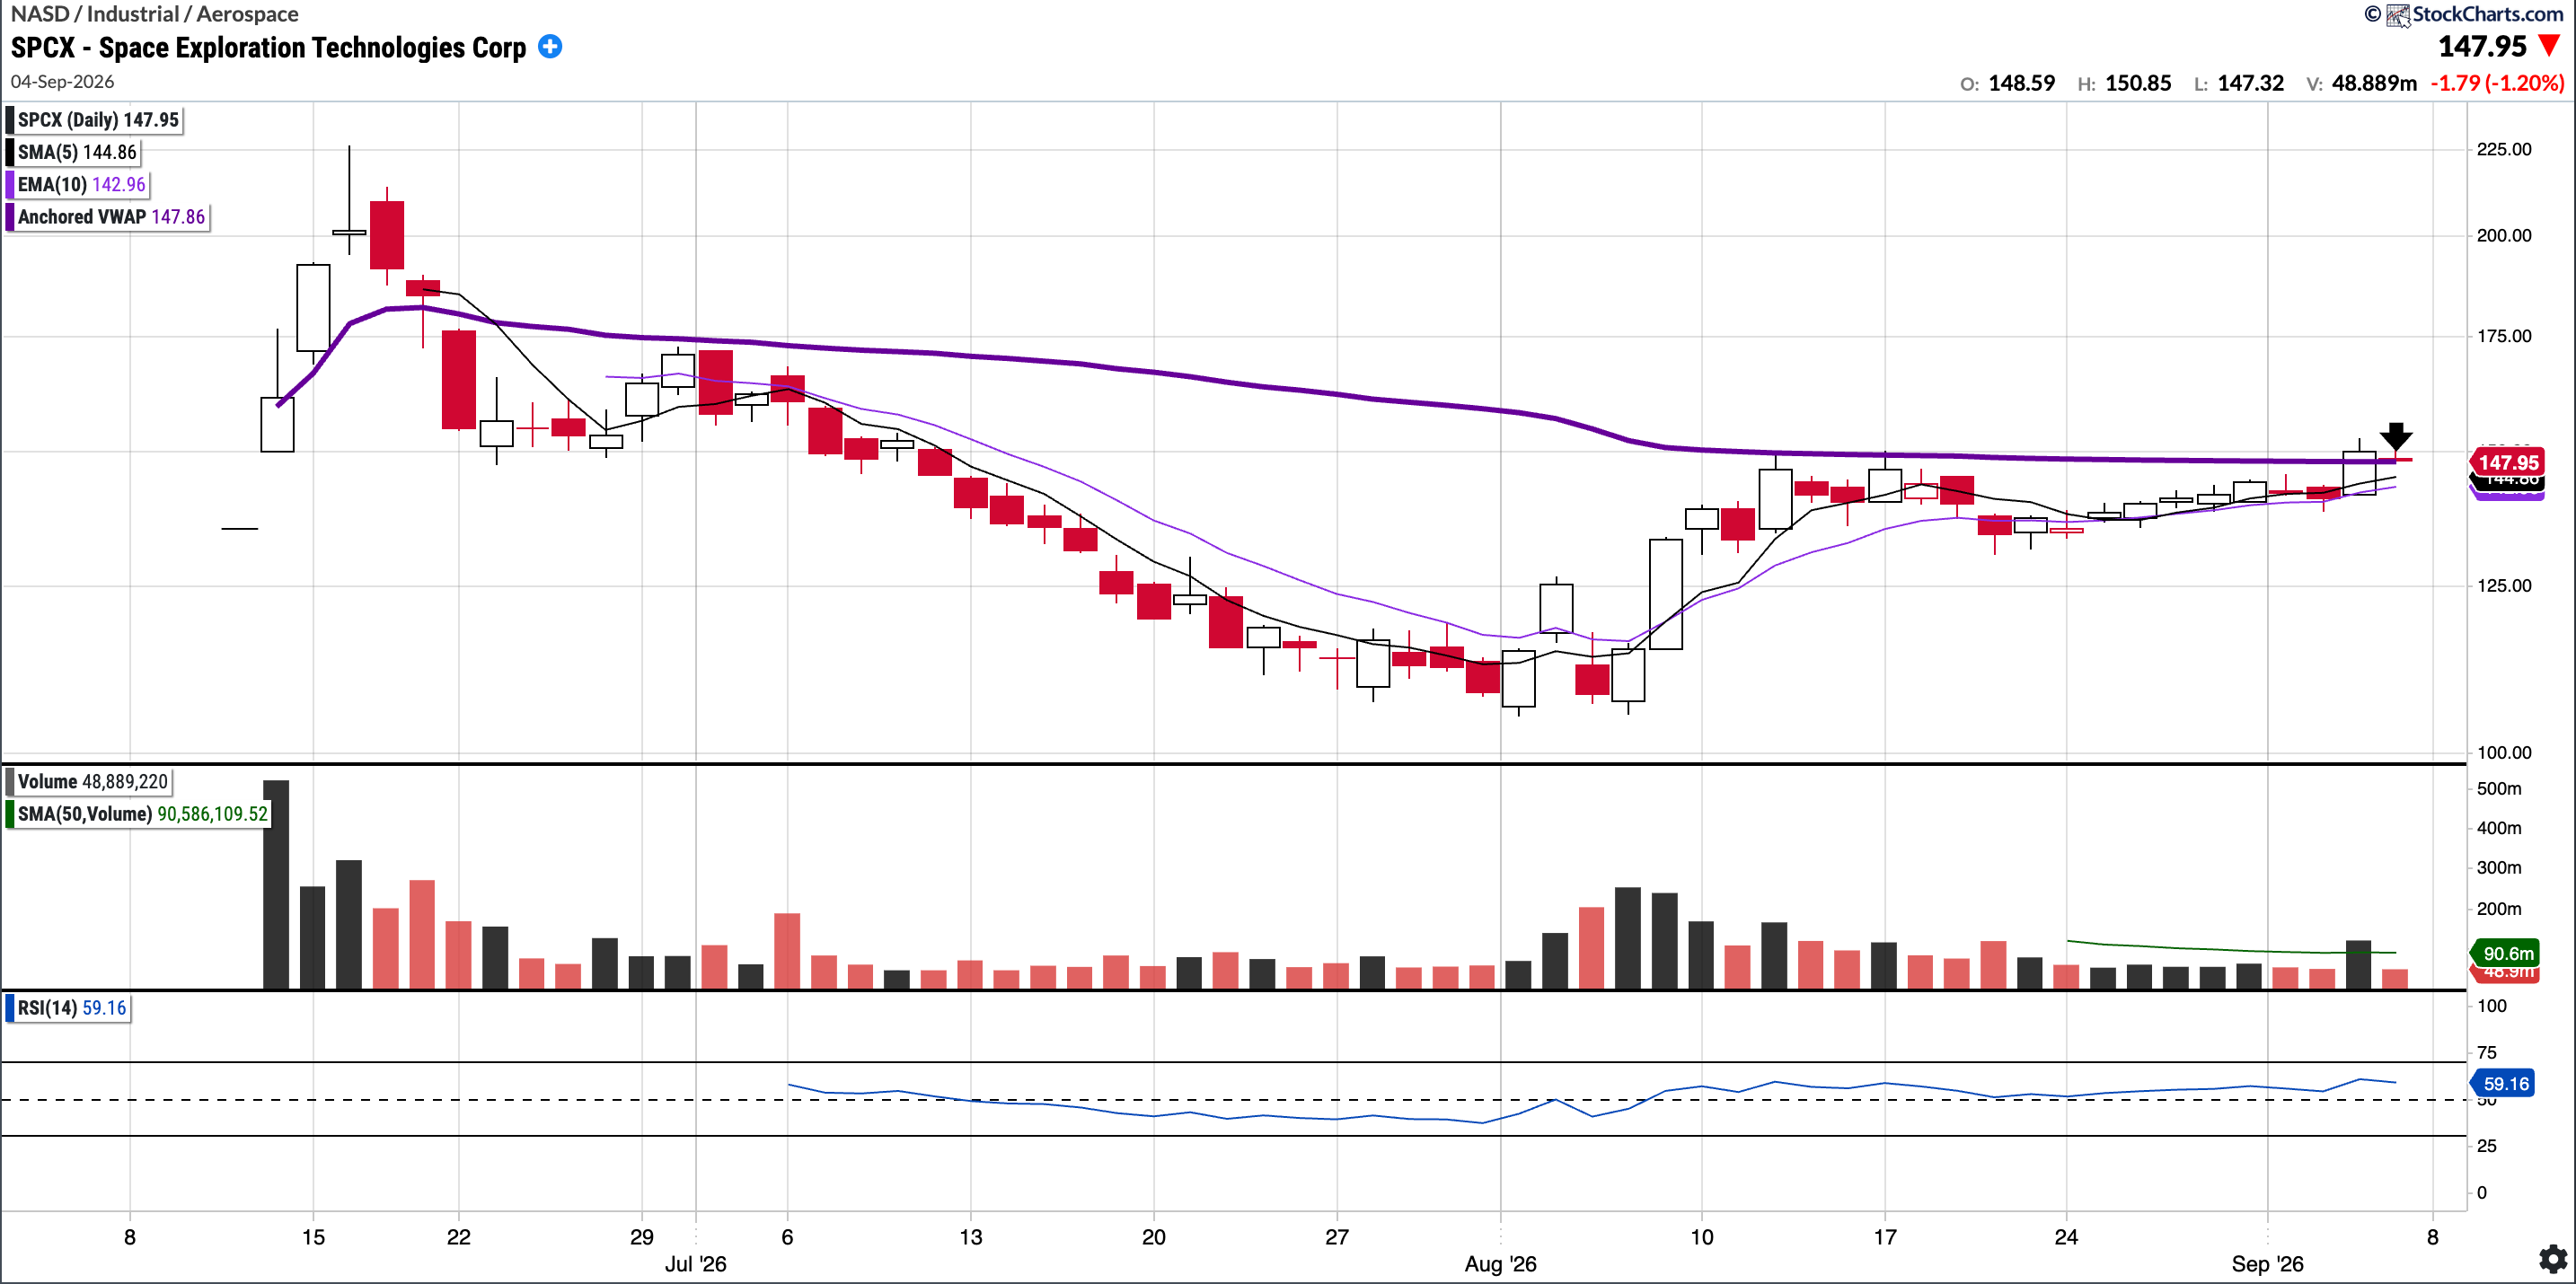
SPCX
Currently trades at $147.95, 8.80% above the 50SMA.
RSI 59.16
-8.08% YTD
SPCX closed almost exactly at the IPO AVWAP. Bulls will want to see this level flipped to support going forwards. For someone looking to trade this name, that can become a level to manage risk against (good above the IPO AVWAP, bad below)
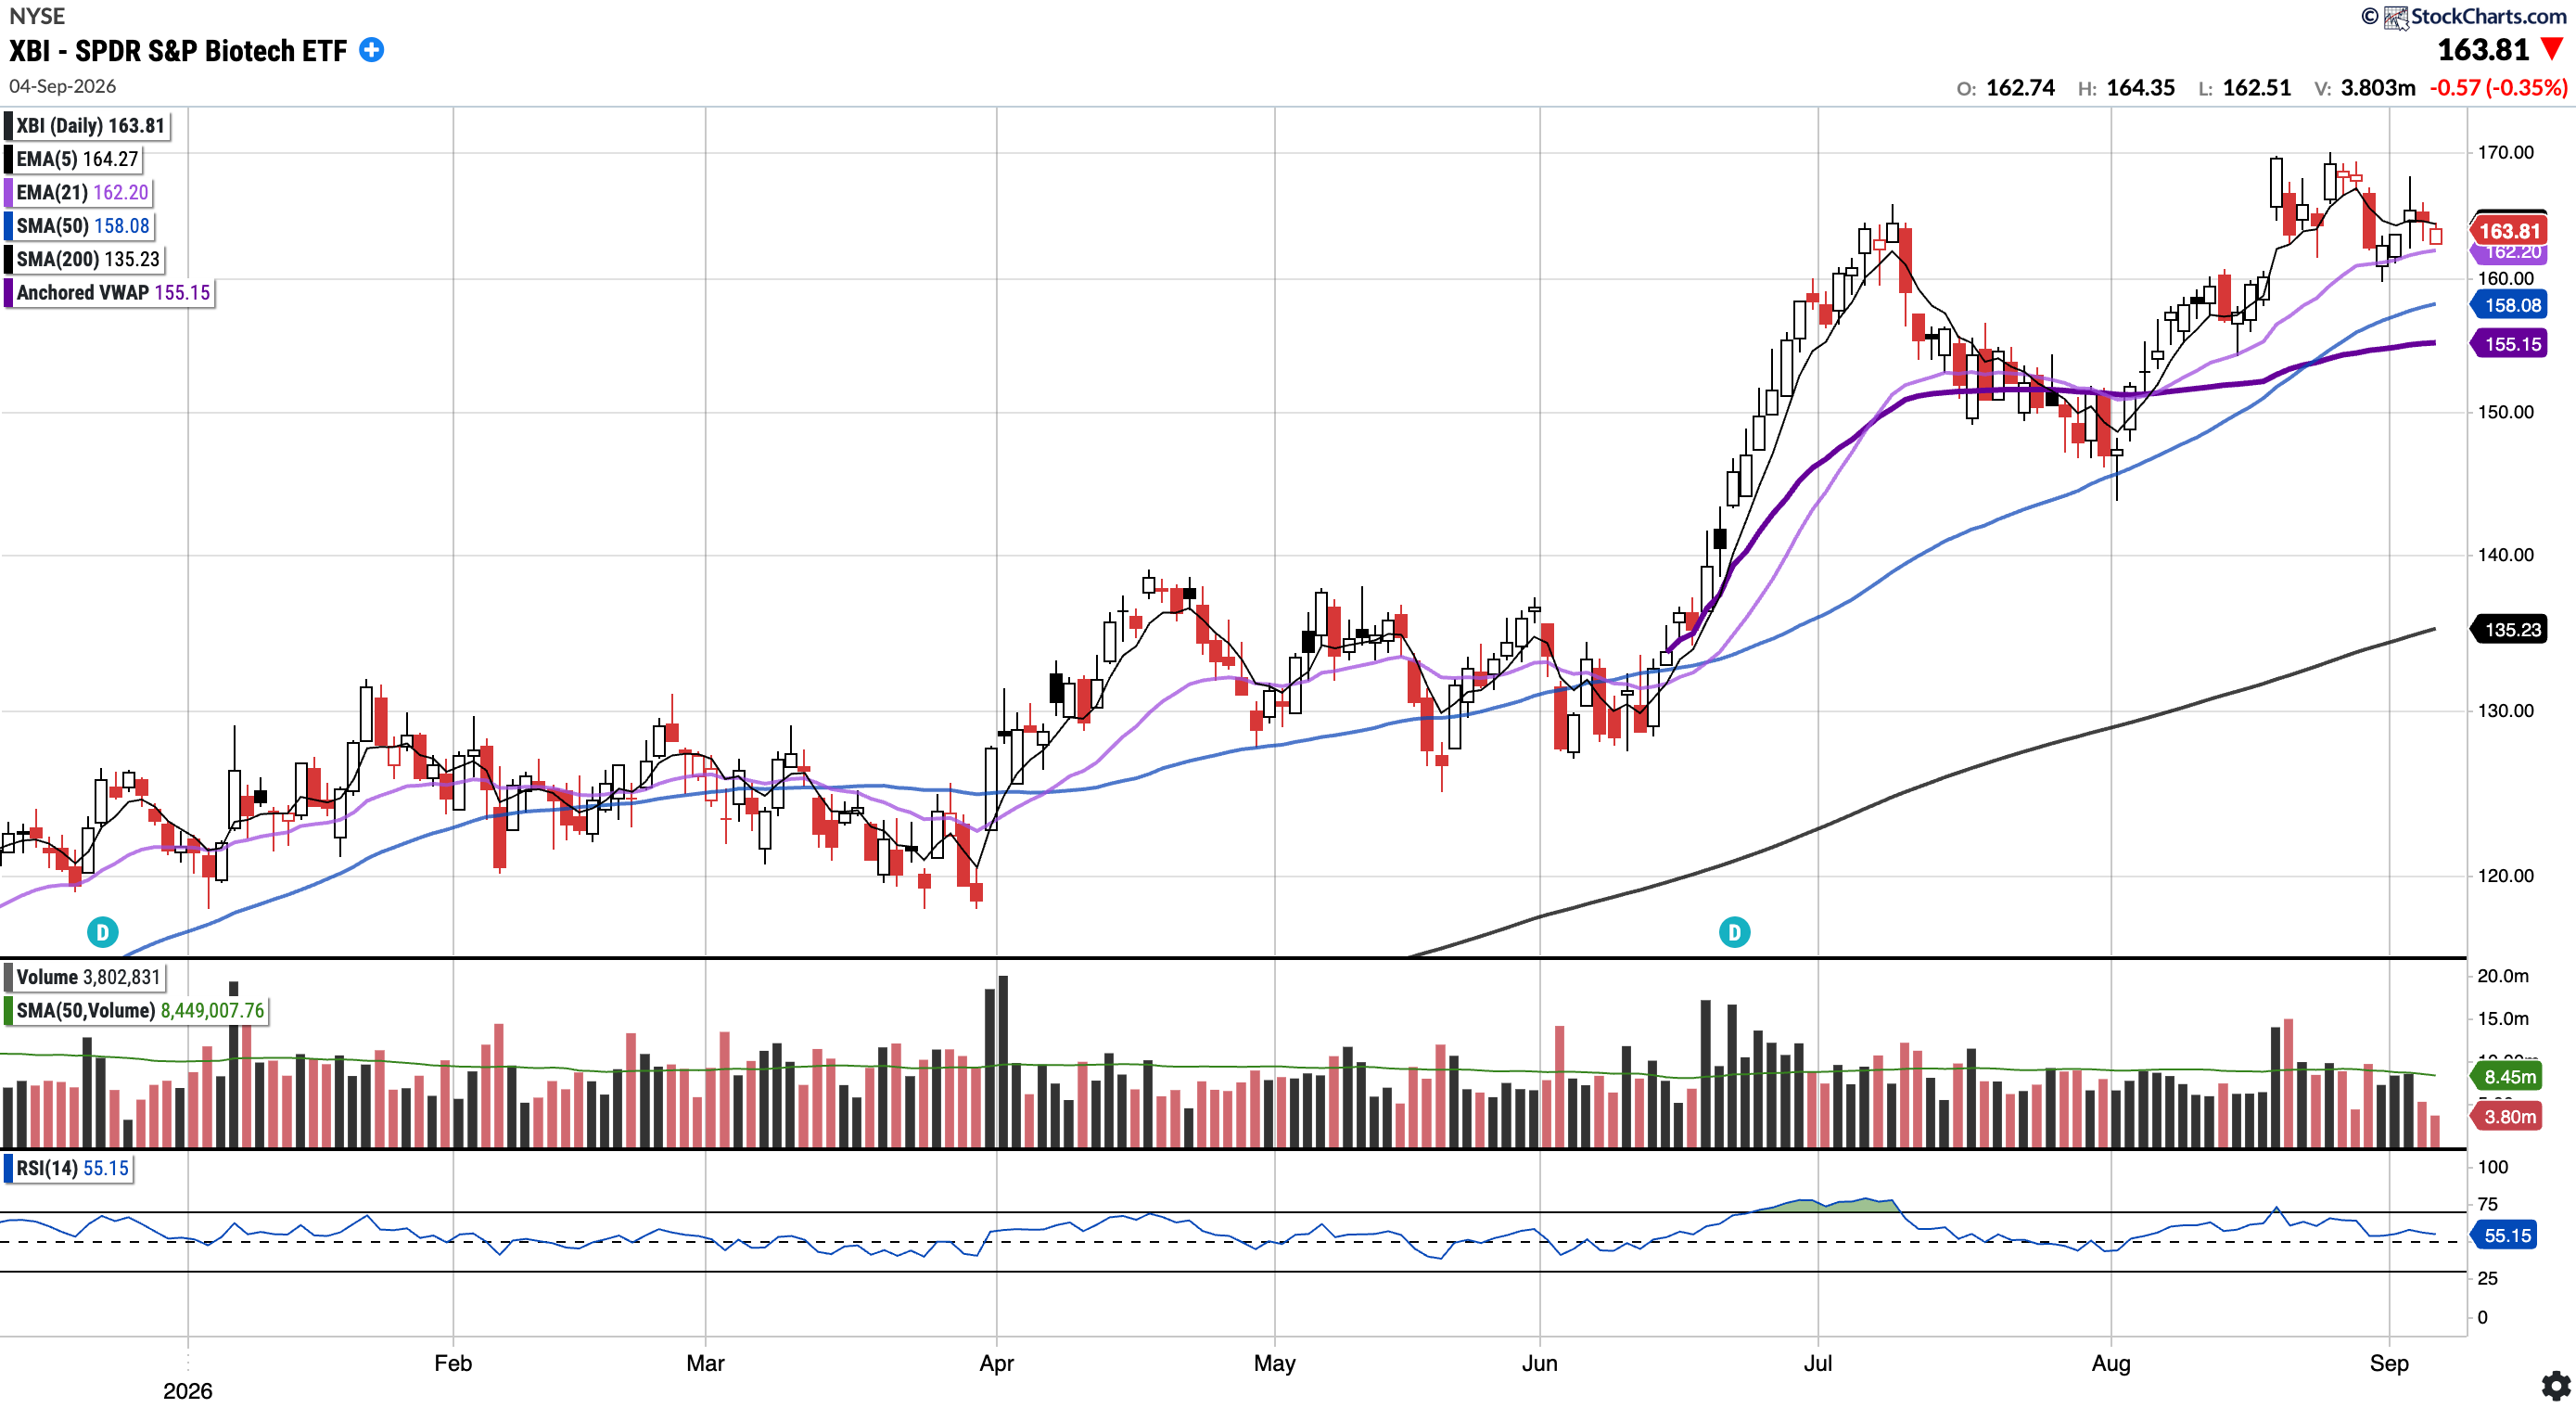
XBI
Currently trades at $163.81, 3.62% above the 50SMA and 21.13% above the 200SMA.
RSI 55.15
34.93% YTD
XBI held the 21EMA after trading in and around that level this week. If price can stay above that level, we can see a continuation of the rally. Otherwise, a selloff to the $158 support (50SMA) is not out of the question.
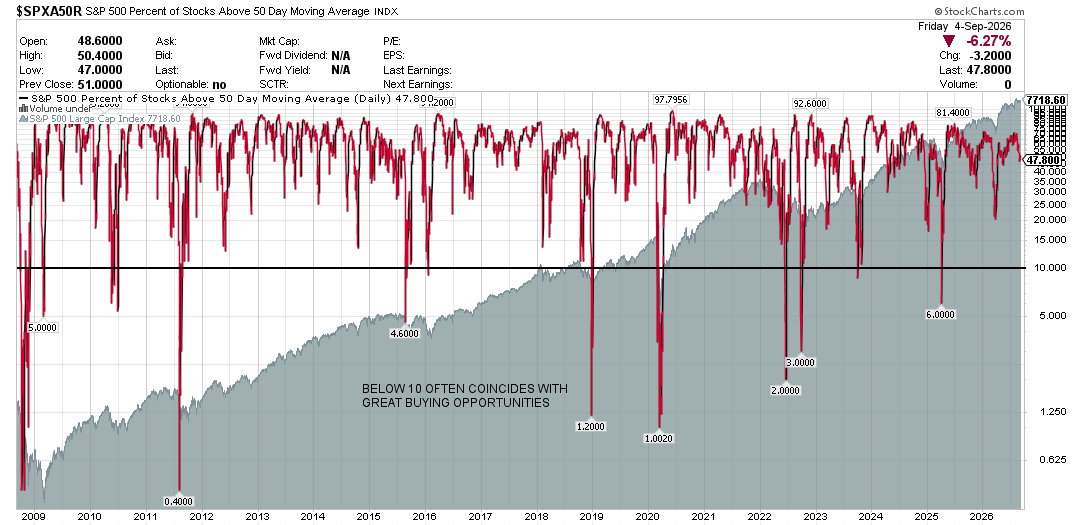
S&P 500 Percentage of Stocks Above the 50 Day Moving Average: Currently 47.8%
Breadth decreased slightly again this week, with the percentage of stocks above the 50-day moving average now at 47.8% compared to 53.6% last week.
Notable portfolio changes in previous week (all updated live in subscriber channels):