


Hope you all are having a good weekend. Below, we will be previewing the upcoming week’s events and providing a portfolio update as usual.
Format for what is covered in this weekly preview:
A Look at the Indices
Key Upcoming Economic Events
Upcoming Earnings
Charts
Current Portfolio Holdings:
Sizing | Cost Basis | Timeframe | Planned Moves
Closing Thoughts (Scroll to here for my Market Commentary)
I recommend checking out the most recent Monthly Portfolio and Performance Update below:

Indices
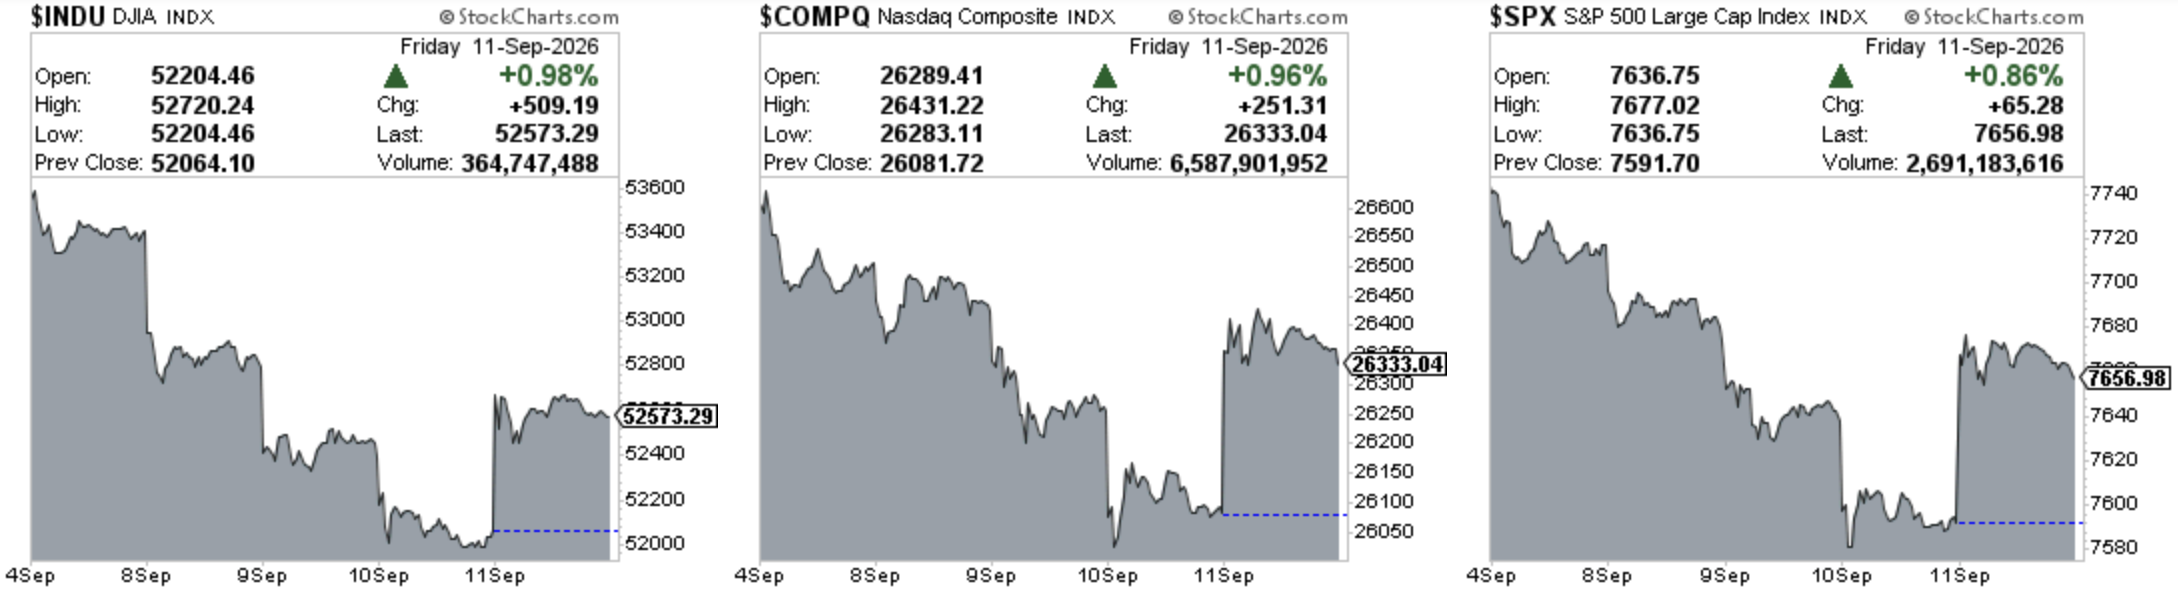
Dow Jones Industrial Average declined -1.57% in the last week
S&P 500 declined -0.80% in the last week
Nasdaq Composite declined -0.66% in the last week
IWM declined -2.41% in the last week
Key upcoming economic events
Monday, September 14
U.S. Treasury 3-Month and 6-Month Bill Auctions
Tuesday, September 15
FOMC Meeting begins (two-day meeting, decision Wednesday)
NY Empire State Manufacturing Index (September)
Wednesday, September 16
FOMC Interest Rate Decision and Summary of Economic Projections (2:00PM ET)
Fed Chair press conference (2:30 PM ET)
Retail Sales (August)
Import and Export Price Indexes (August)
NAHB Housing Market Index (September)
Business Inventories (July)
Net Long-Term TIC Flows (July)
Thursday, September 17
Housing Starts and Building Permits (August)
Philadelphia Fed Manufacturing Index (September)
Initial Weekly Jobless Claims
Friday, September 18
Conference Board Leading Economic Index (August)
U.S. Industrial Production & Capacity Utilisation (August):
Fed Speaker: Scheduled remarks from Fed Governor Michelle Bowman.
Upcoming Earnings
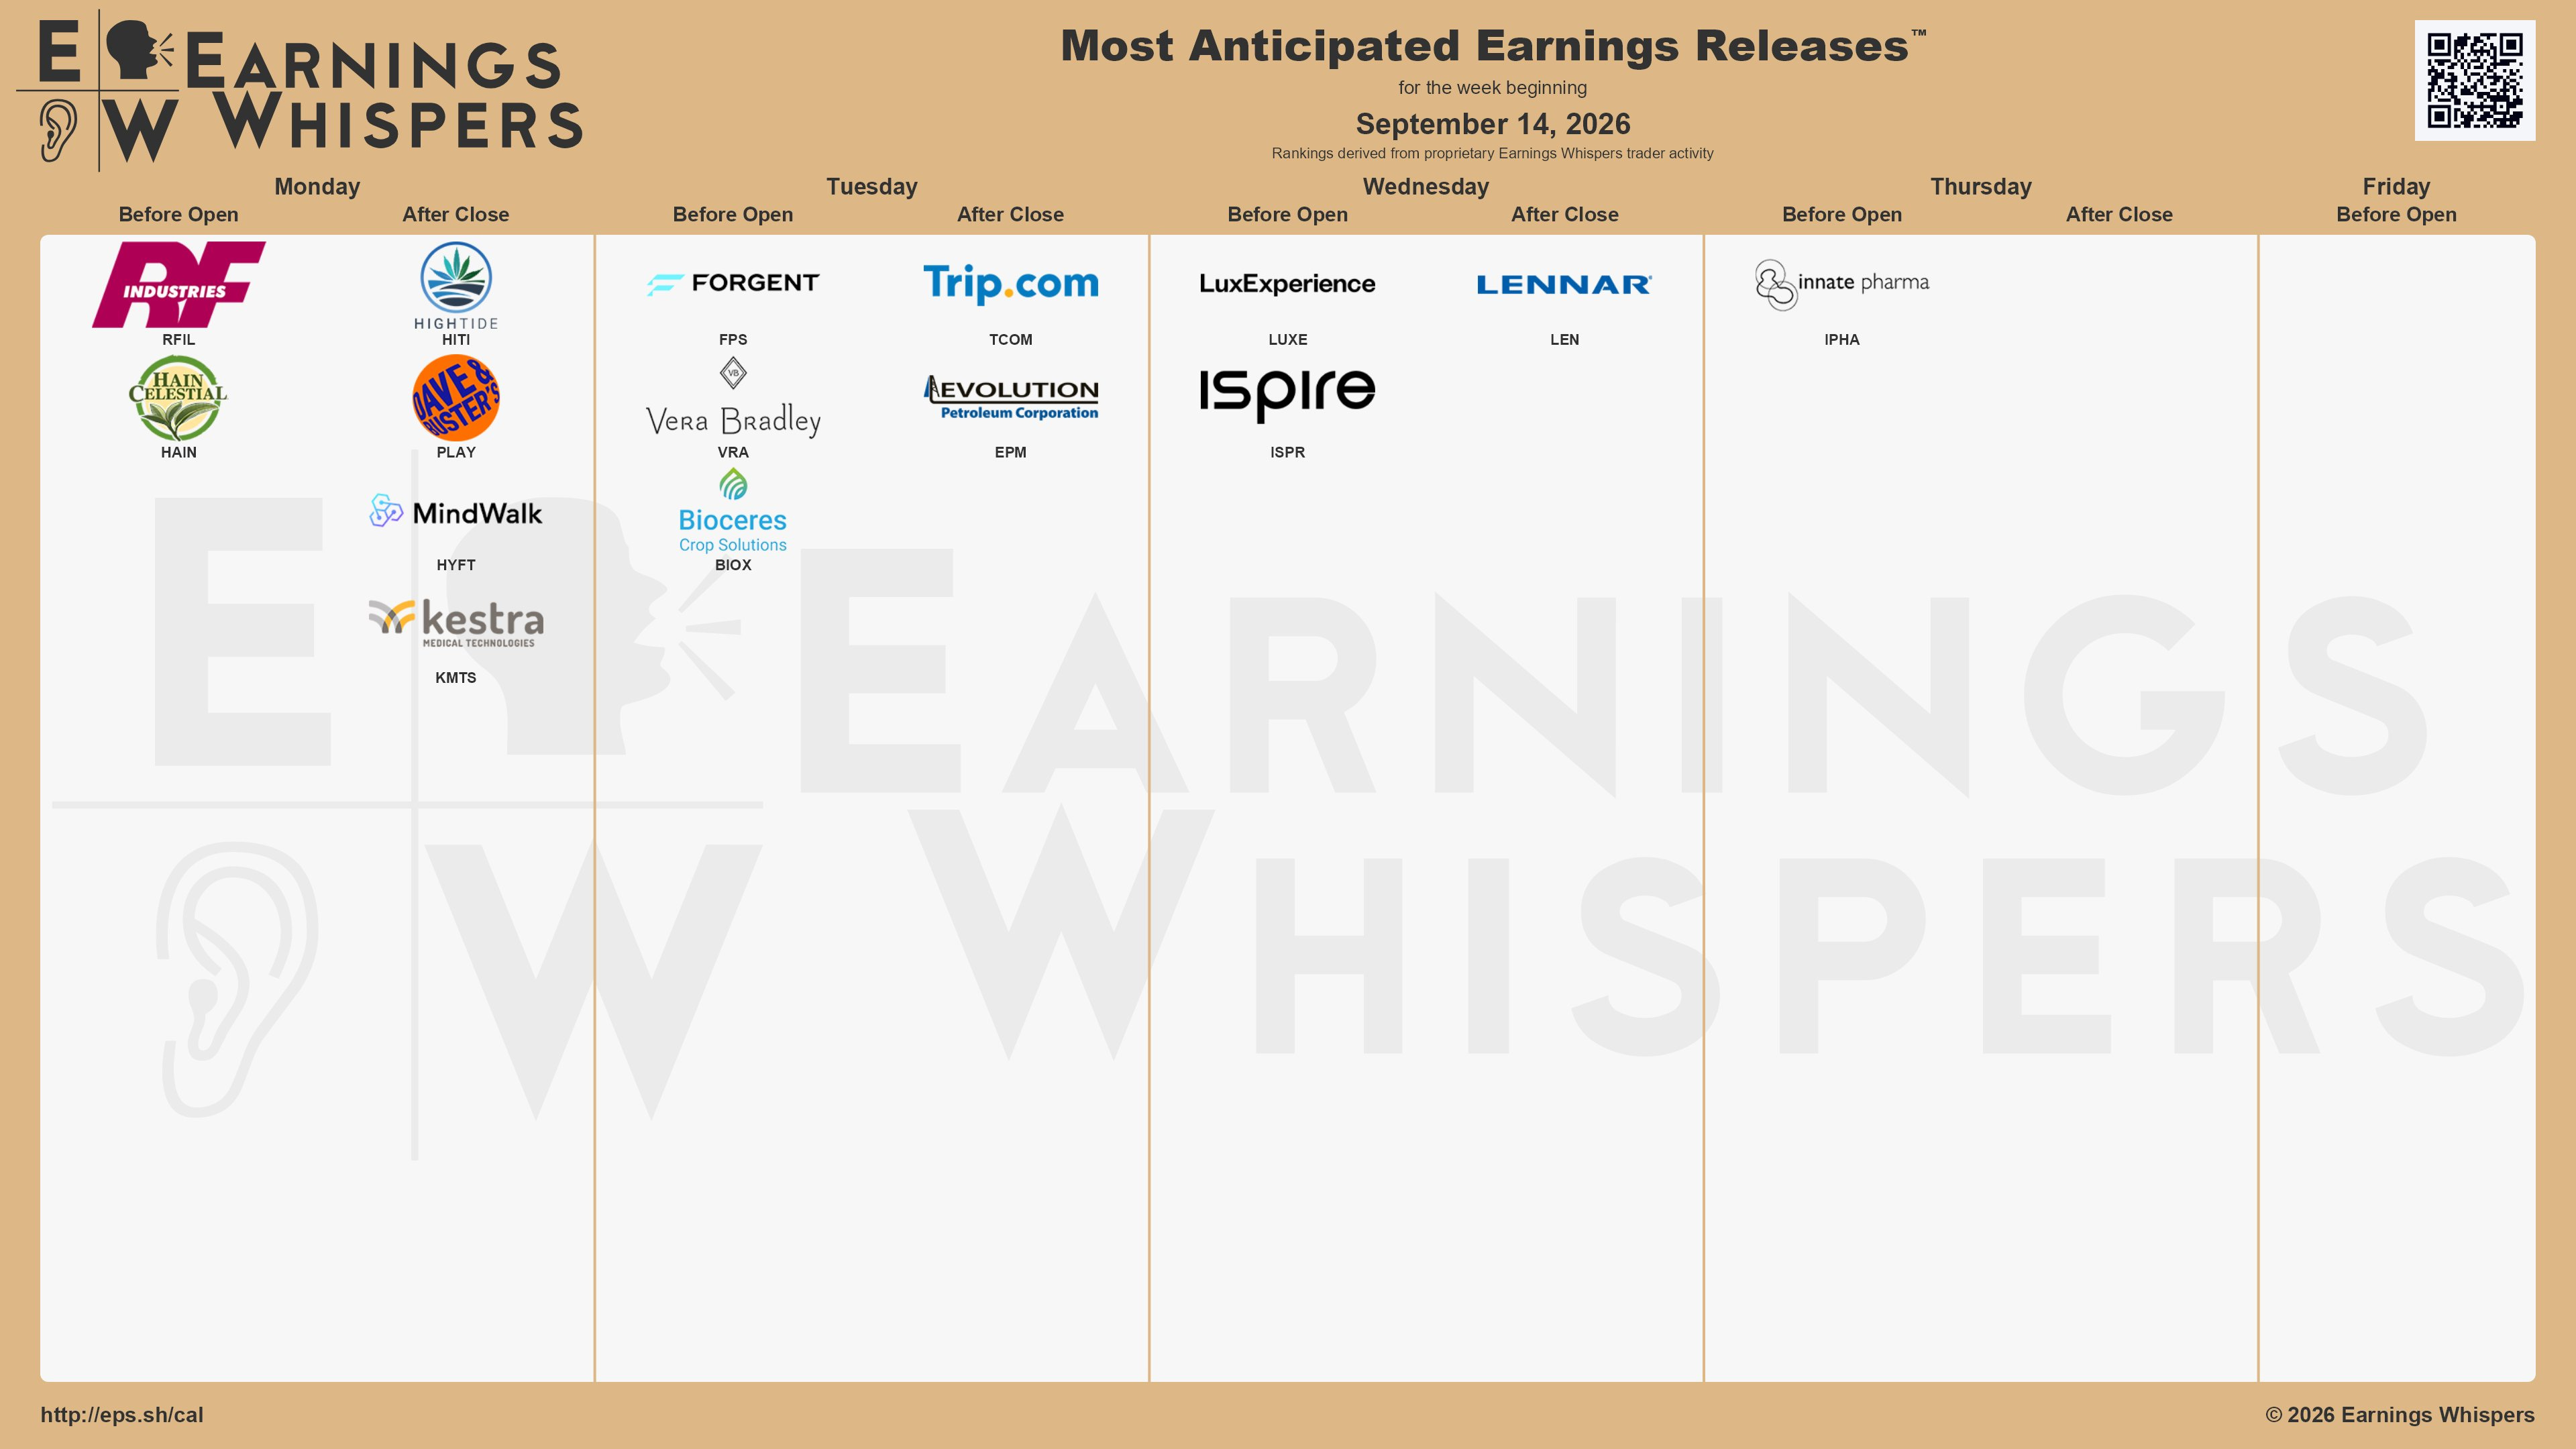
Below is the infographic by Earnings Whispers highlighting the schedule for this week:
Charts
SPX
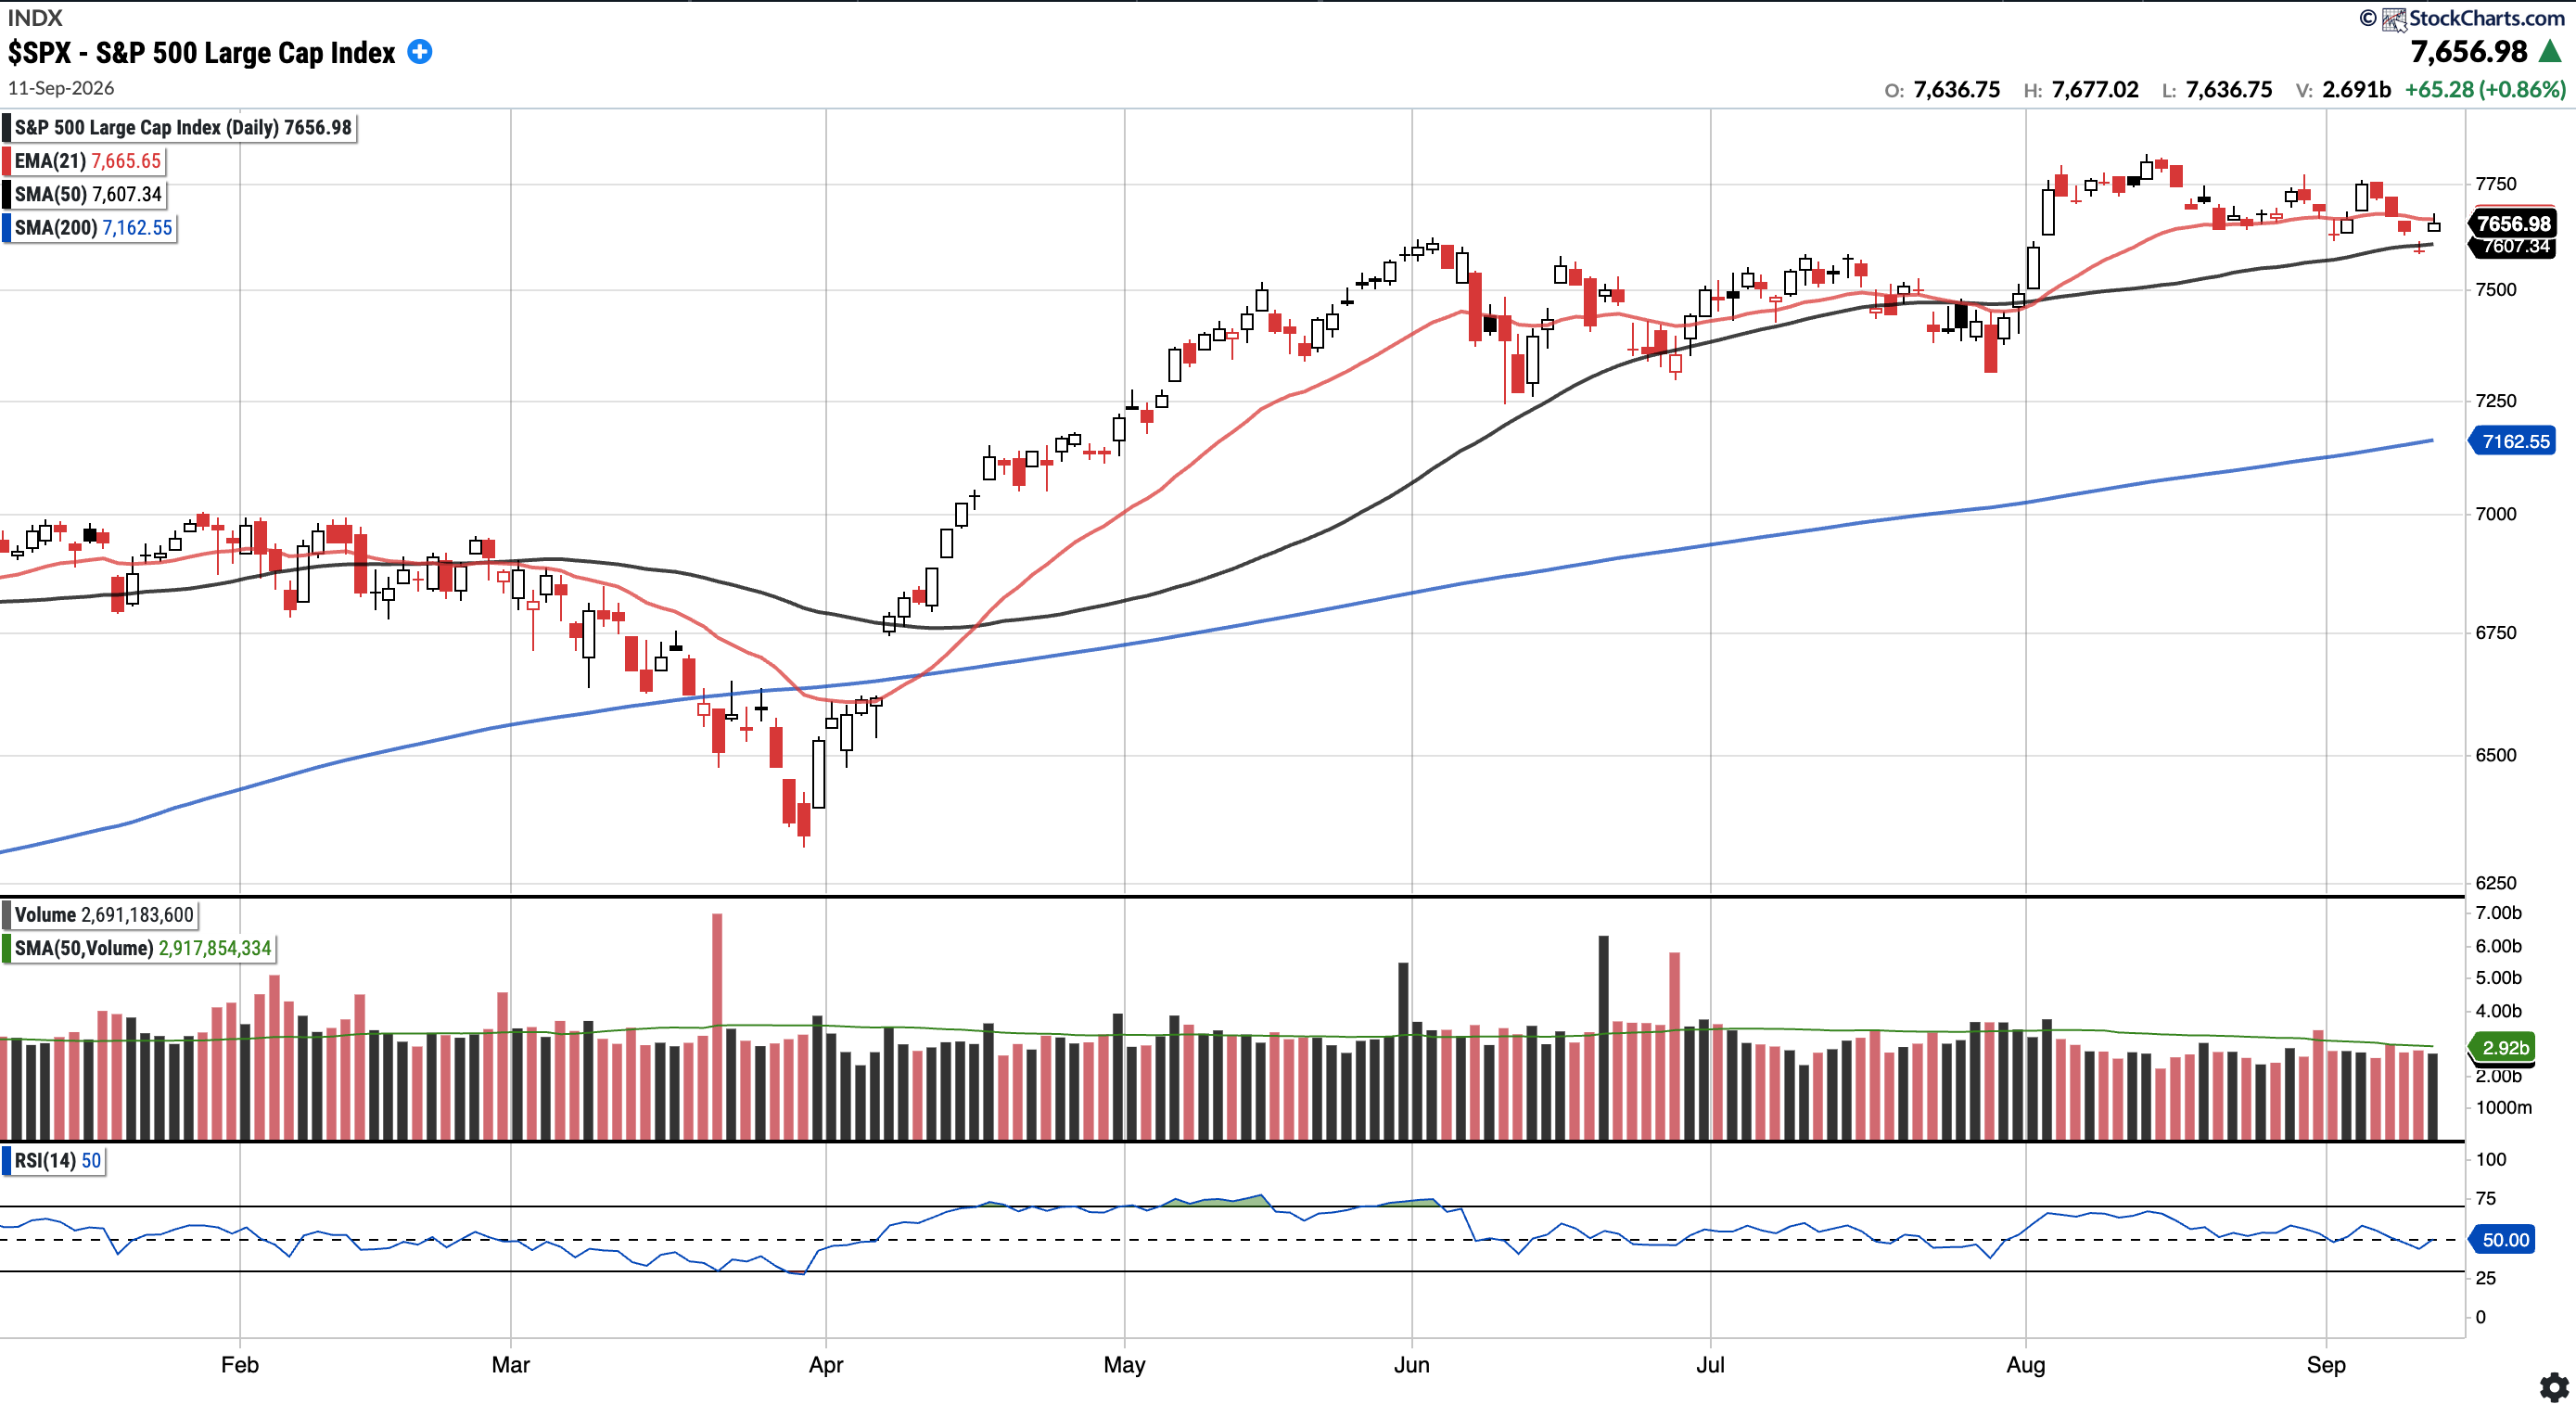
Currently trades at $7656.98, 0.65% above the 50SMA and 6.90% above the 200SMA.
RSI 50.0
11.64% YTD
Distribution days in the last week: 2
Although the S&P 500 lost the 50 SMA mid-week, it closed out the week above it but below the 21 EMA. While it failed to close above the 21 EMA, this rally after a slightly hotter core CPI is constructive. However, the upcoming FOMC meeting is likely to be a major market-moving event to watch this week.
COMPQ
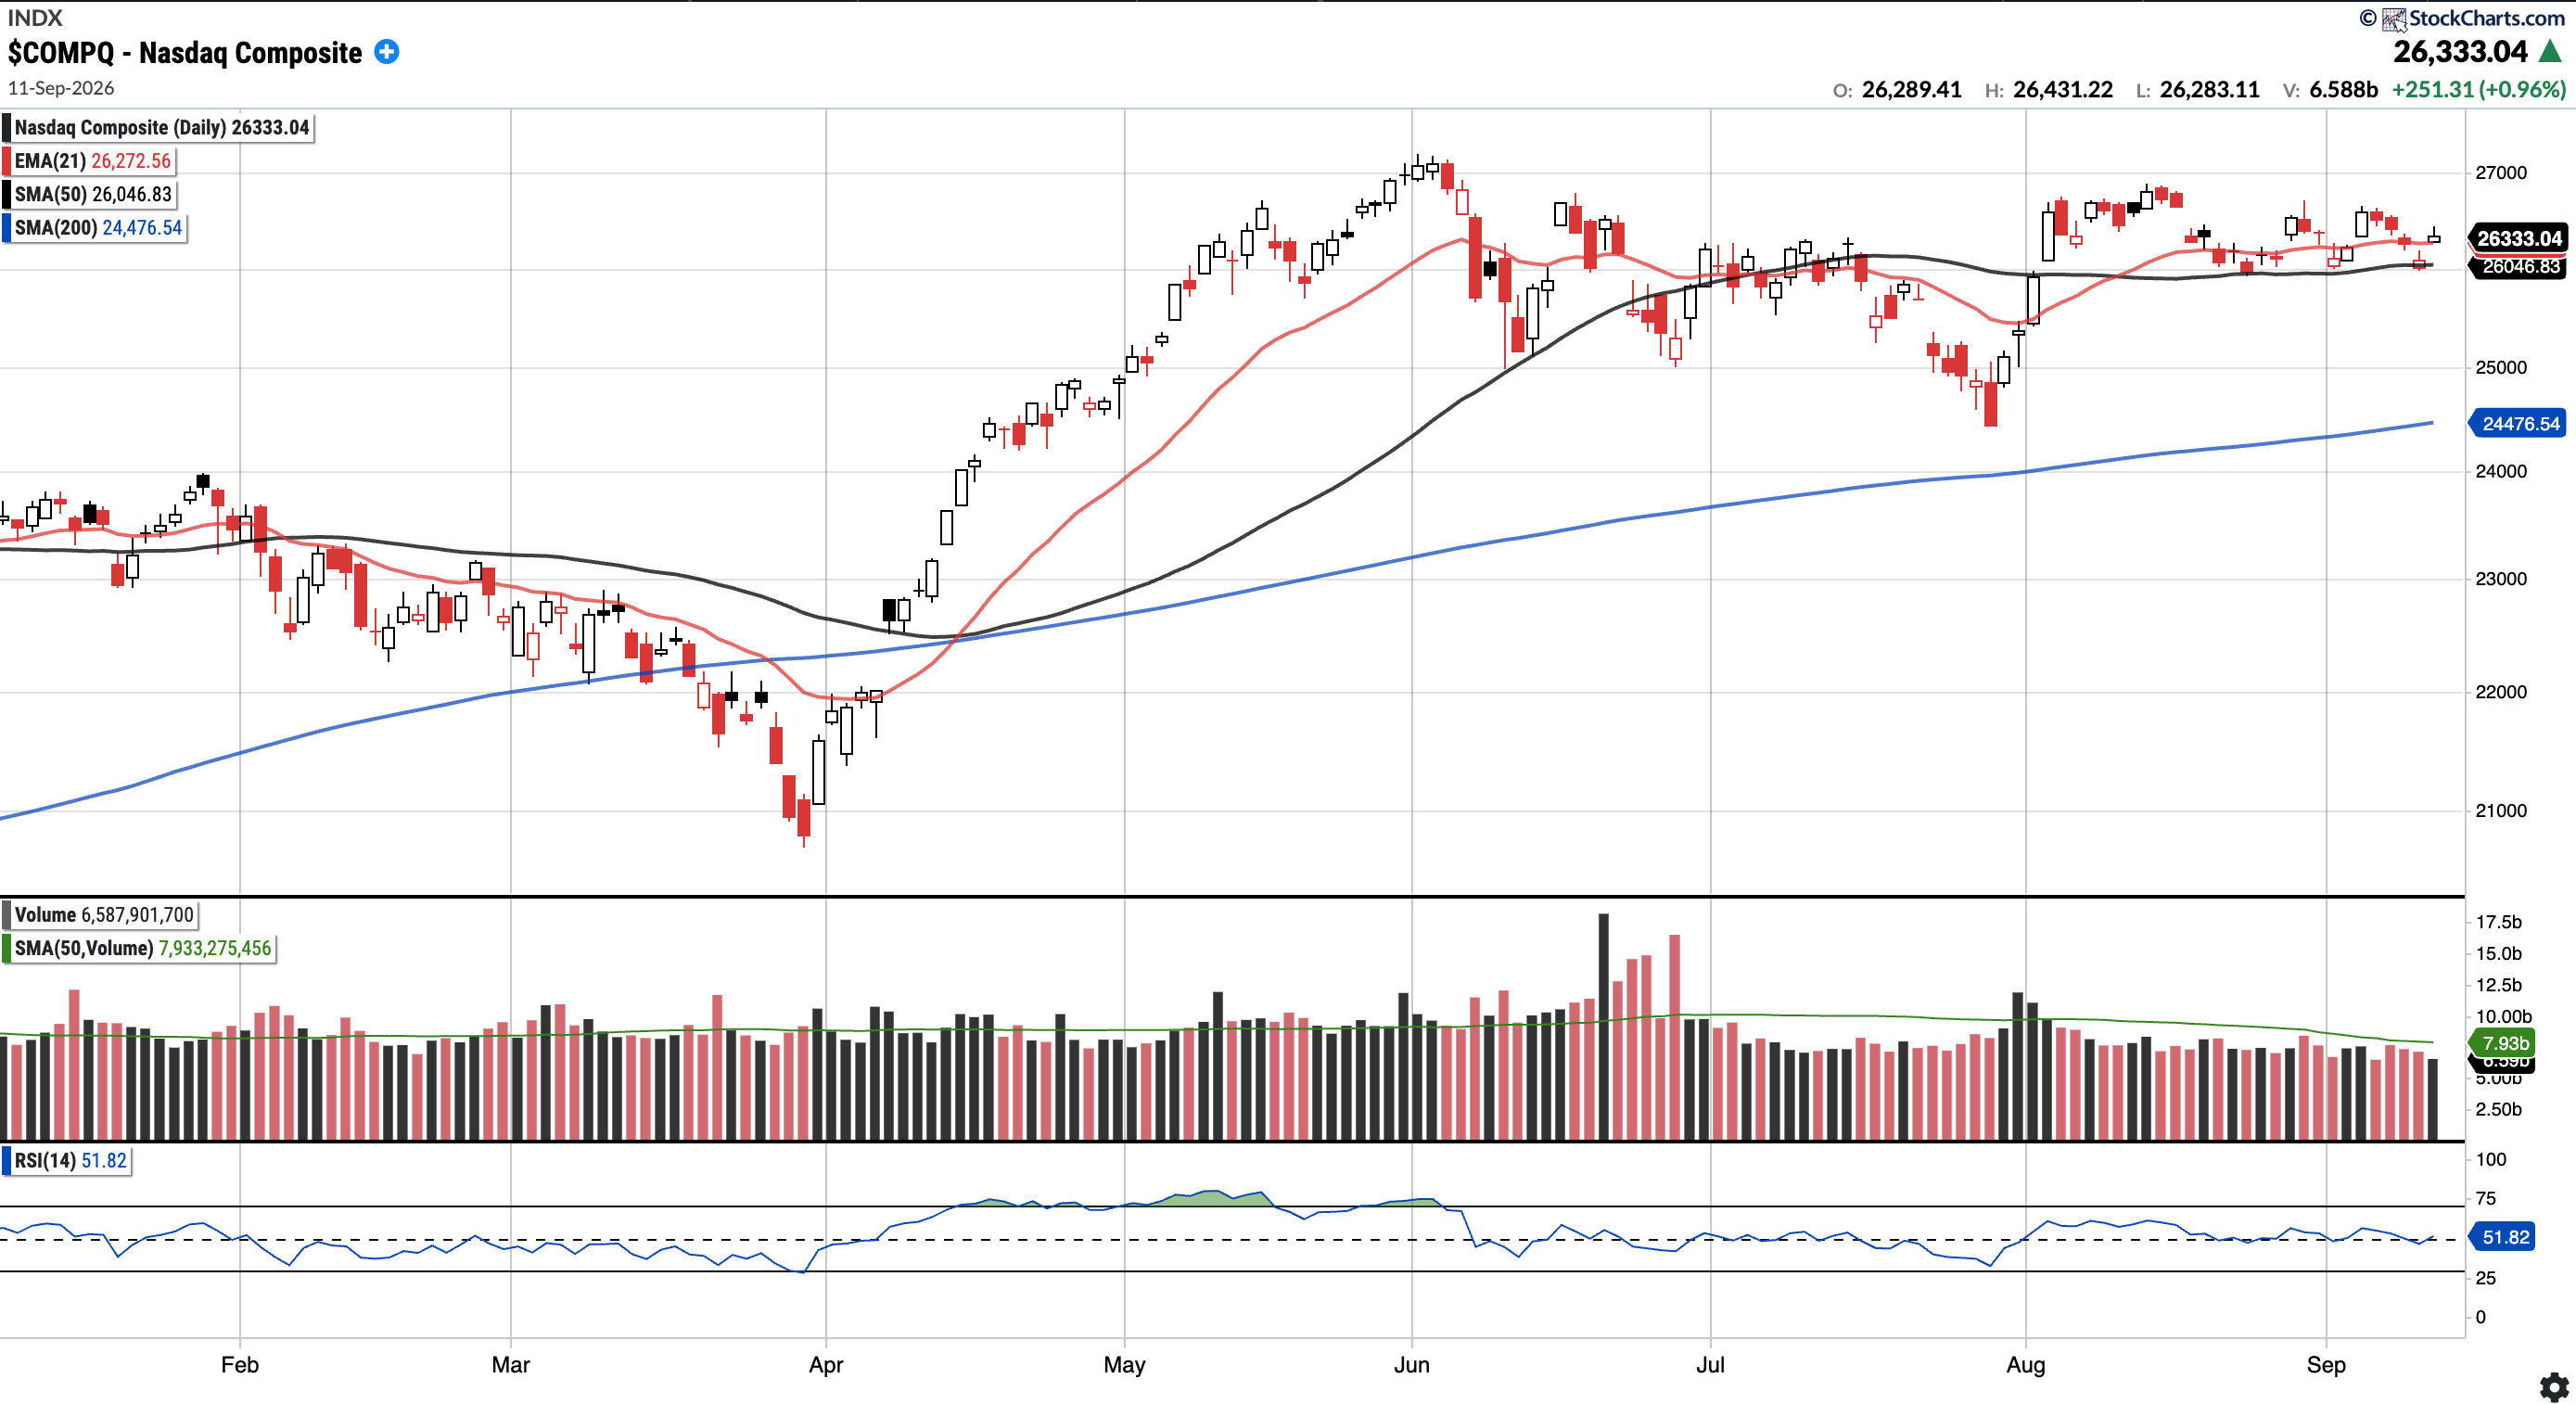
Currently trades at $26333.04, 1.10% above the 50SMA and 7.58% above the 200SMA.
RSI 51.82
13.33% YTD
Distribution days in the last week: 1
The Nasdaq remains above its key moving averages, including the 21 EMA, despite pulling back to the 50 SMA for the third consecutive week. Price held this 50 SMA support with a nice recovery due to a push higher on Friday, allowing the index to close above the 21 EMA.
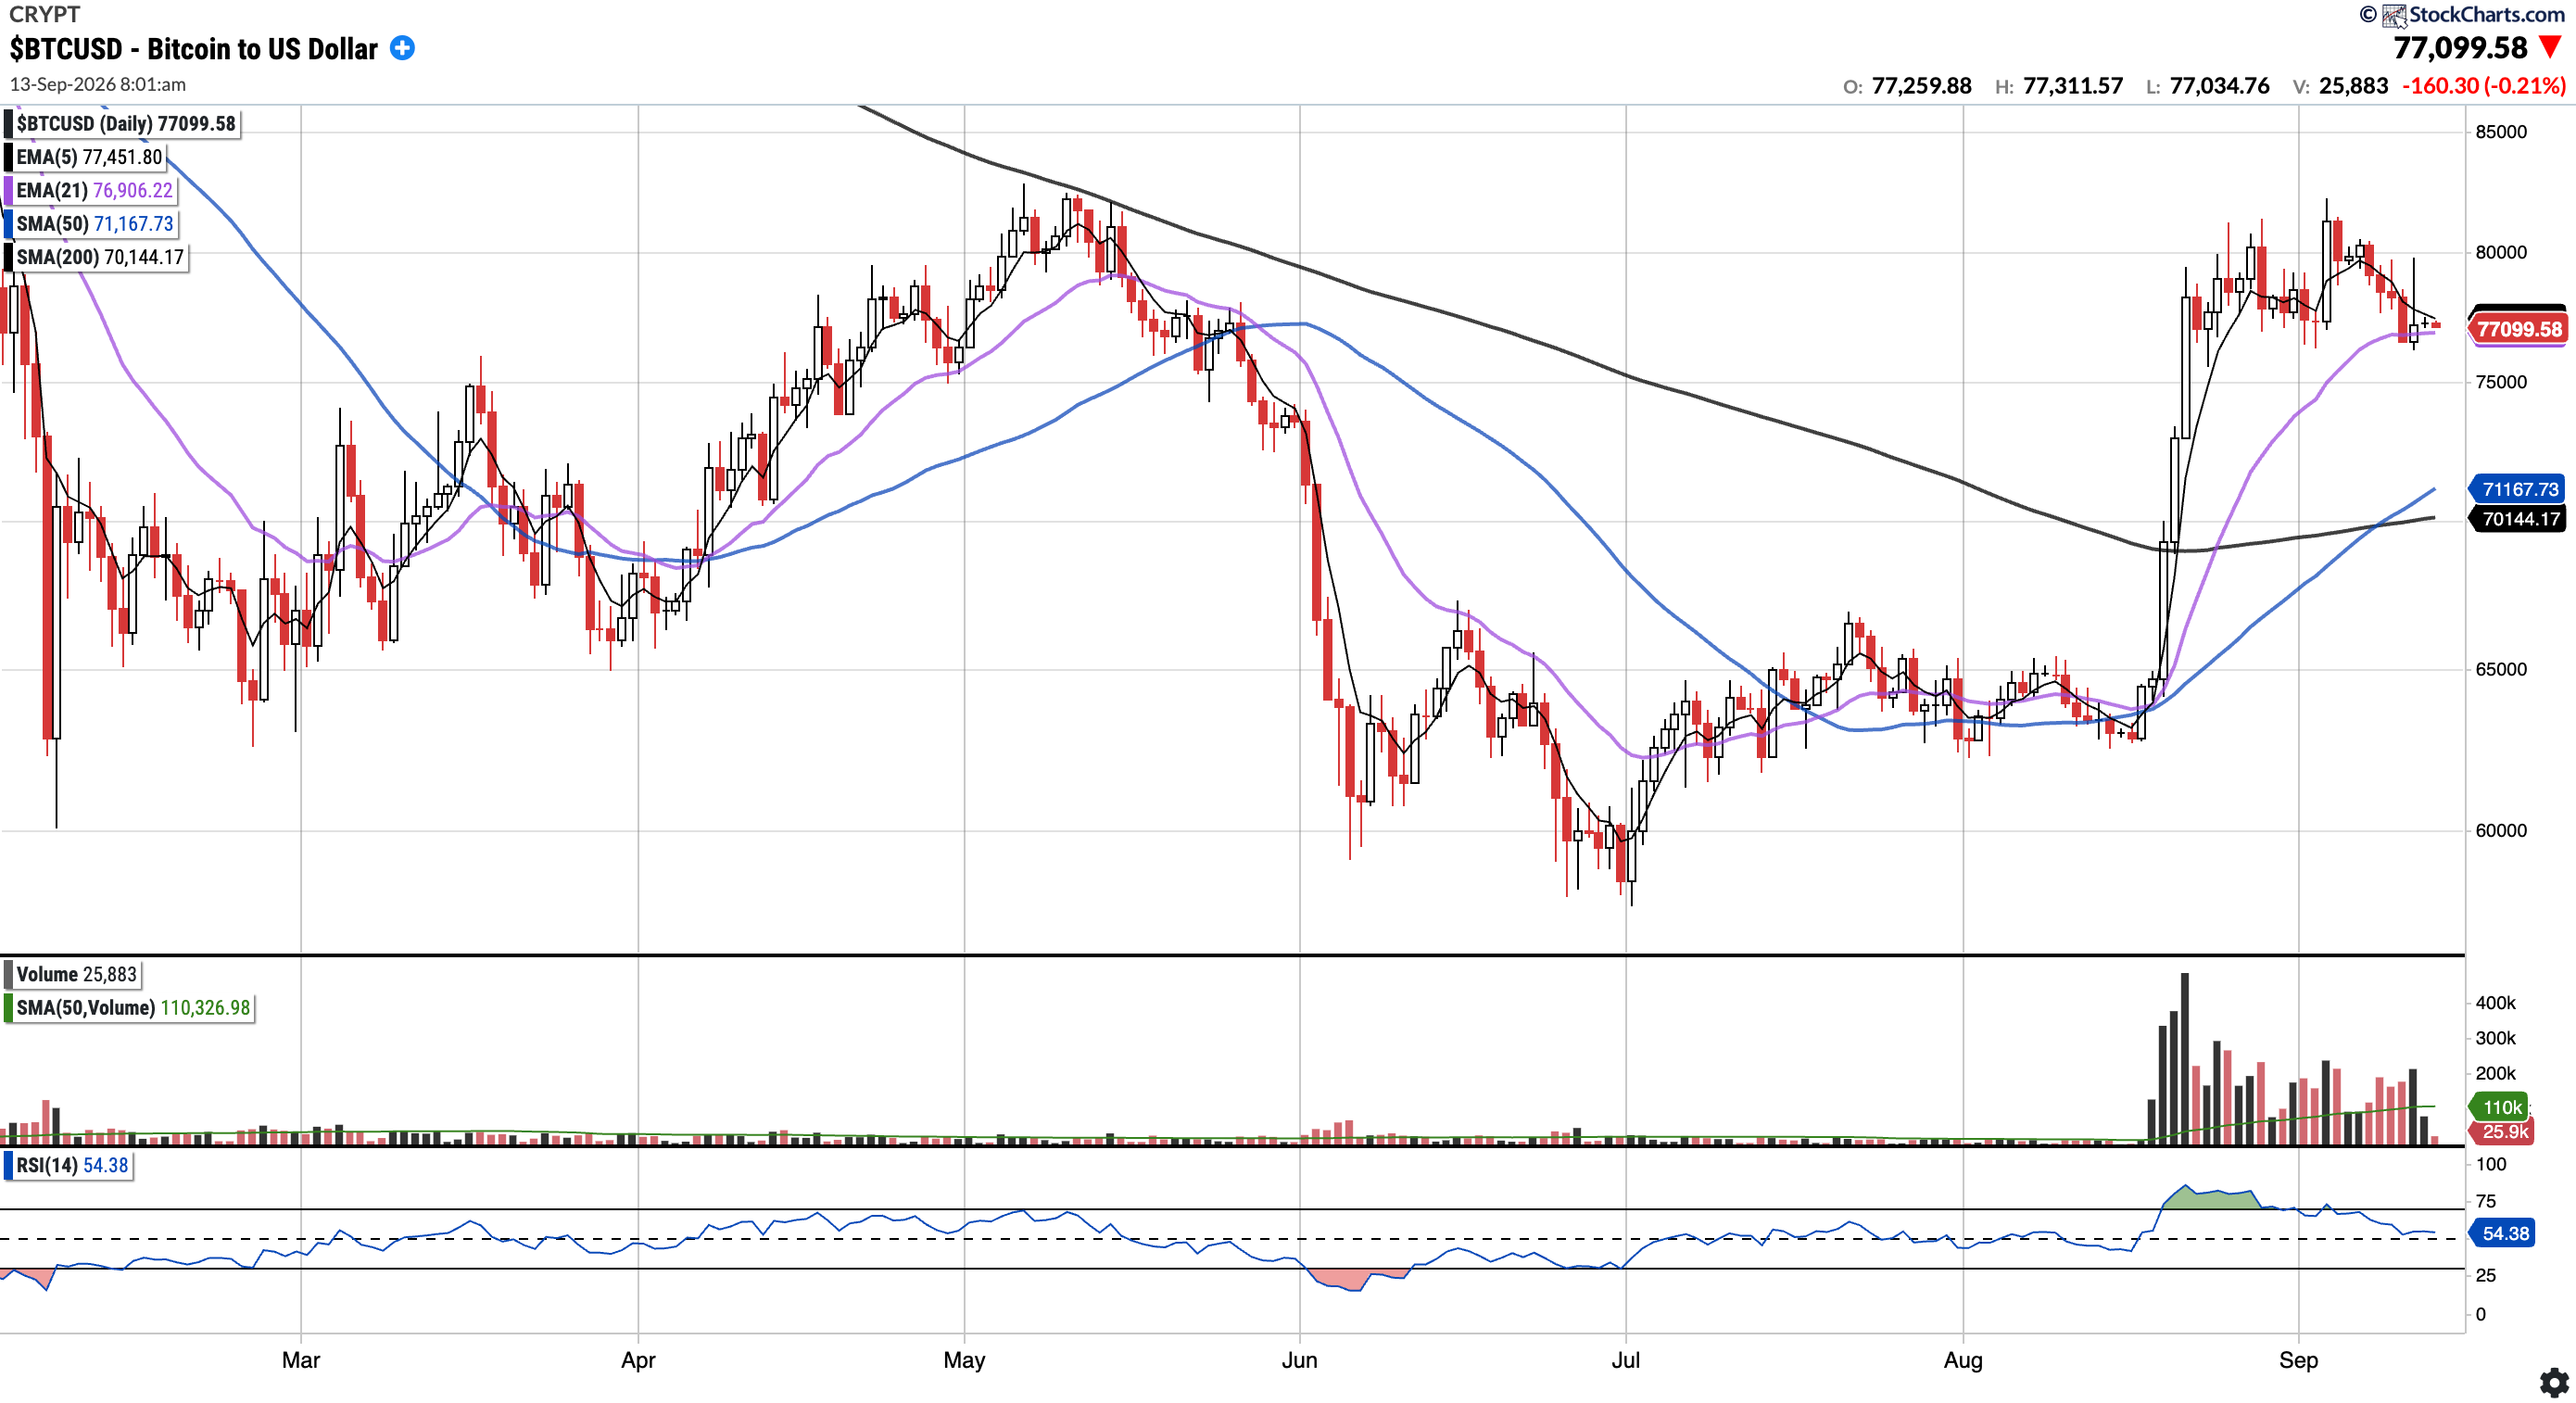
BTC (currently Long)
Currently trades at $77,099.58, 8.34% above the 50SMA and 9.93% above the 200SMA.
RSI 54.56
-13.11% YTD
Bitcoin traded sideways around its 21 EMA all week, despite a strong push higher on Wednesday. While BTC holds above all its key moving averages, the $80k–$82k zone continues to act as heavy resistance, a crucial overhead level that bulls need to clear.
EEM
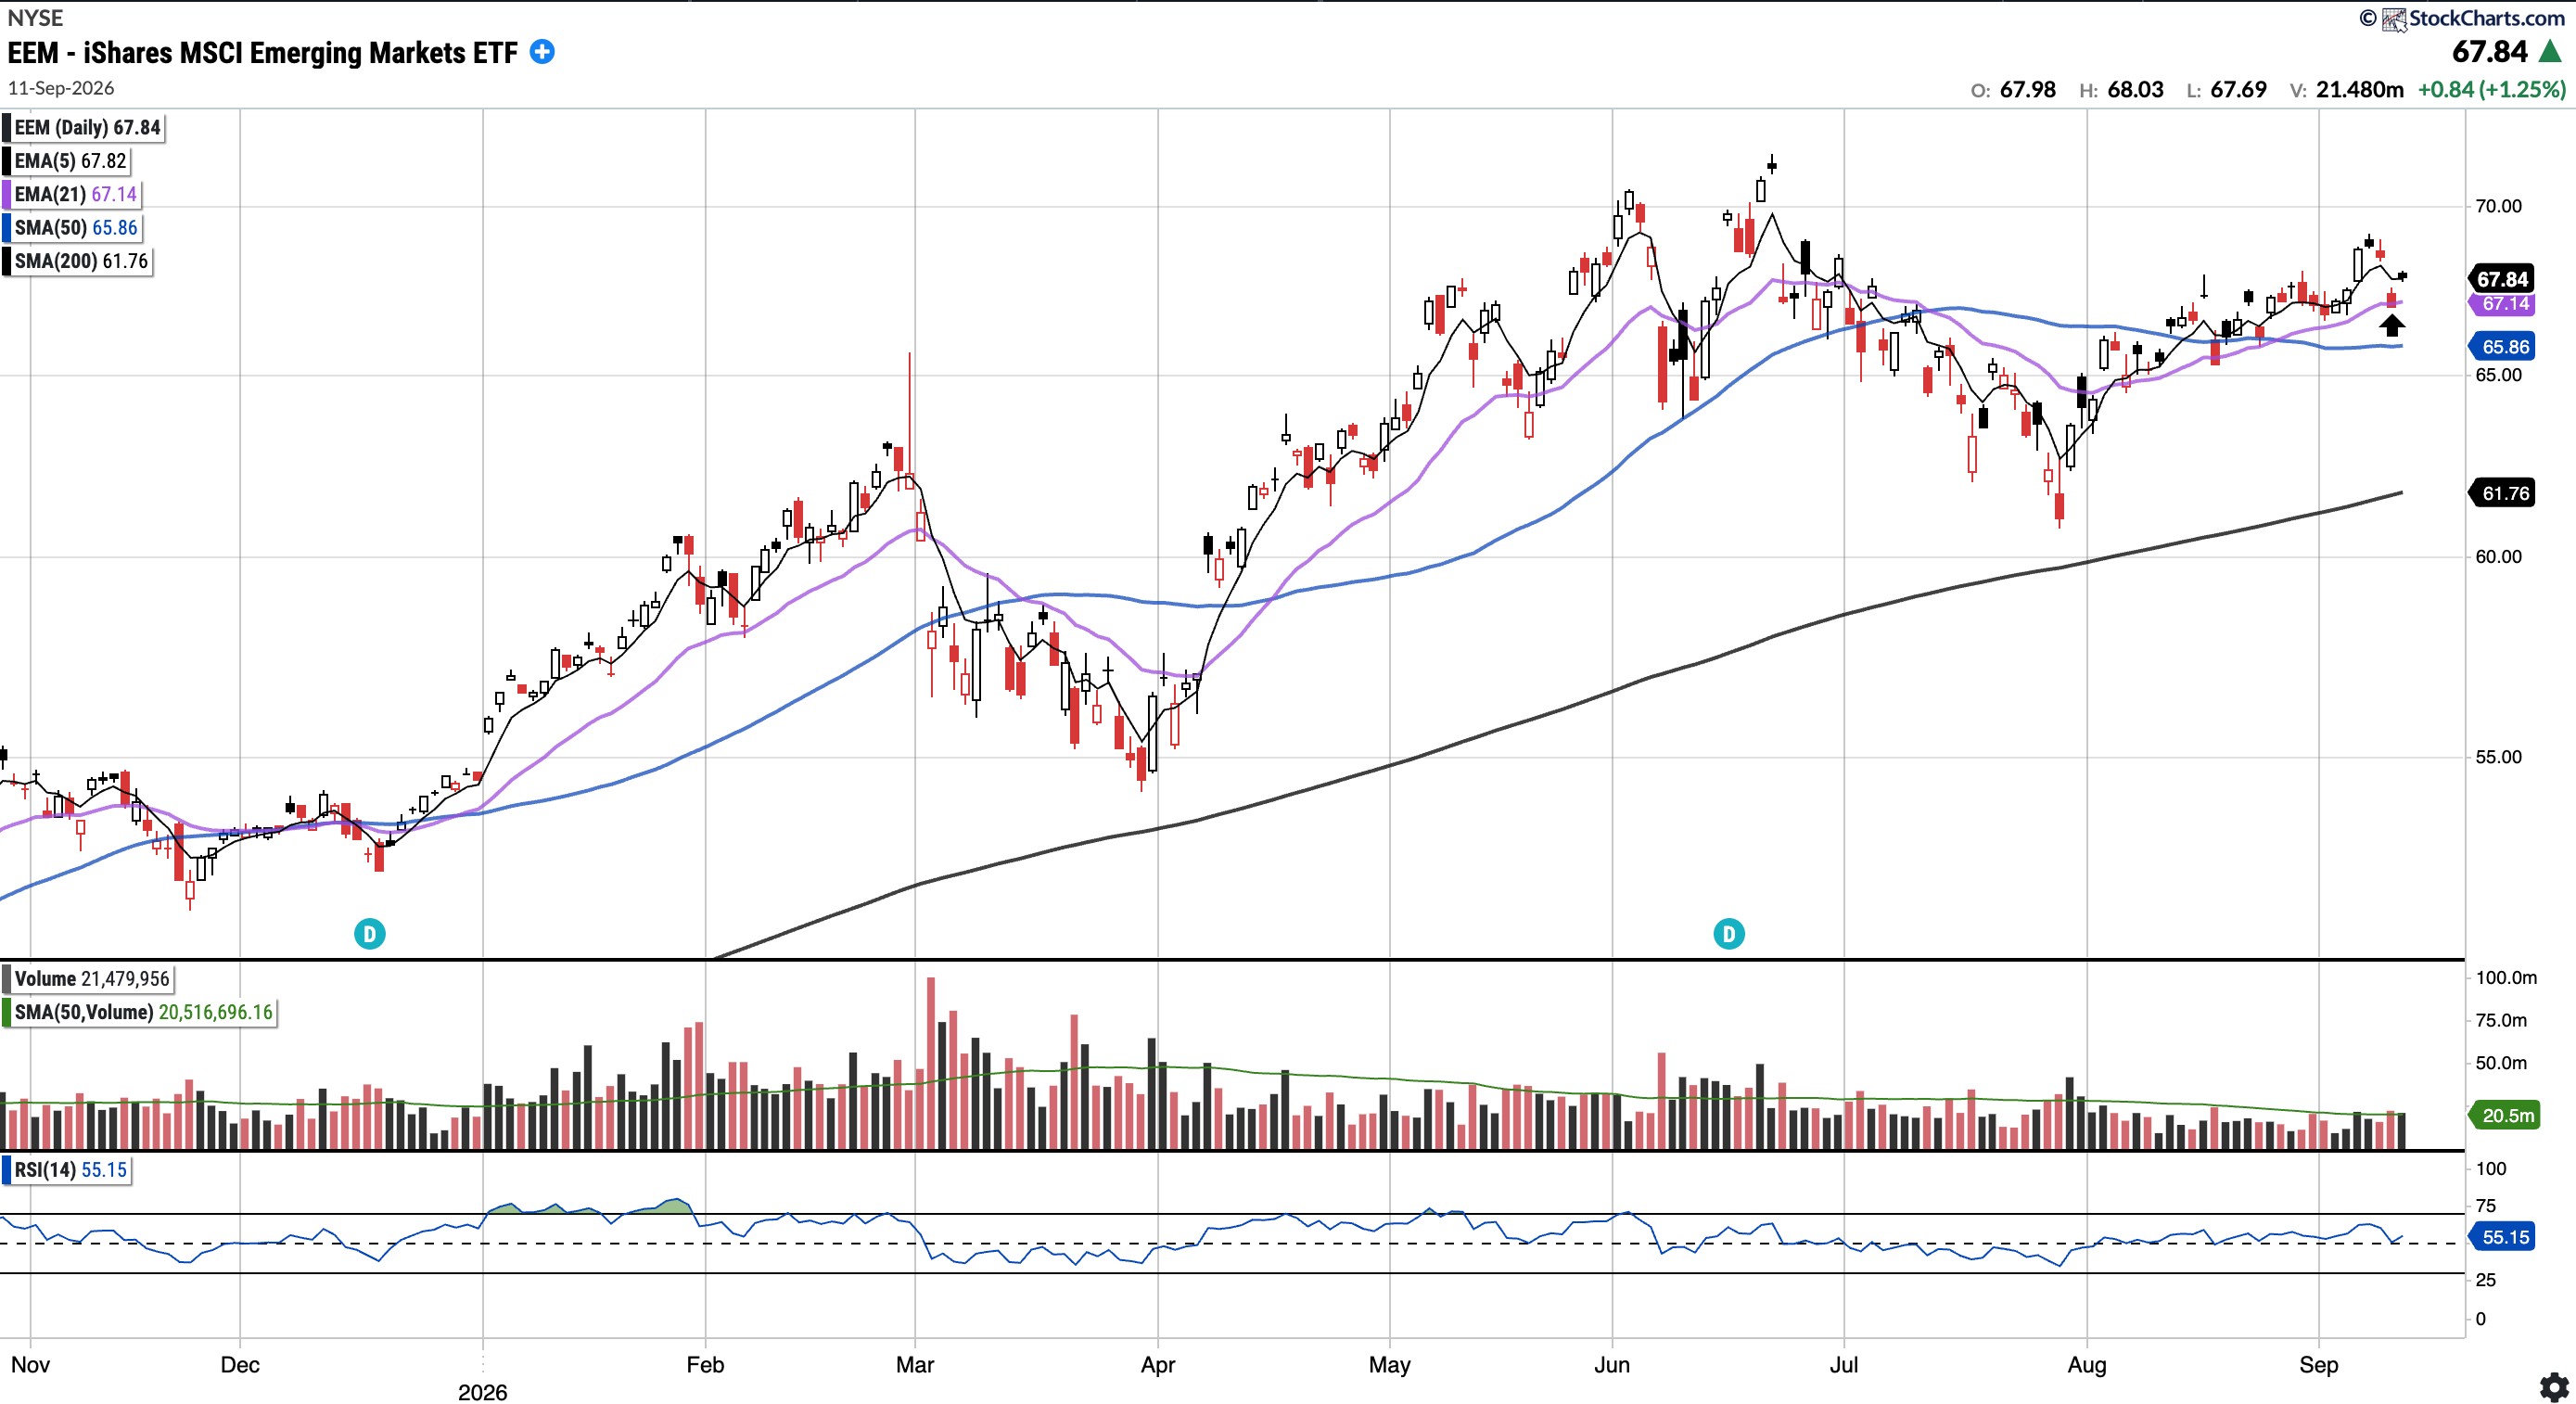
Currently trades at $67.84, 3.01% above the 50SMA and 9.84% above the 200SMA.
RSI 55.15
21.25% YTD
EEM held the 21 EMA as support again (see arrow) and pushed higher past the 5 EMA. Price is still comfortably sitting in an uptrend after the 21/50 MA cross I highlighted two weeks ago. Bulls will want to see the 21EMA level hold to see the uptrend continue.
GOLD (Long Physical)
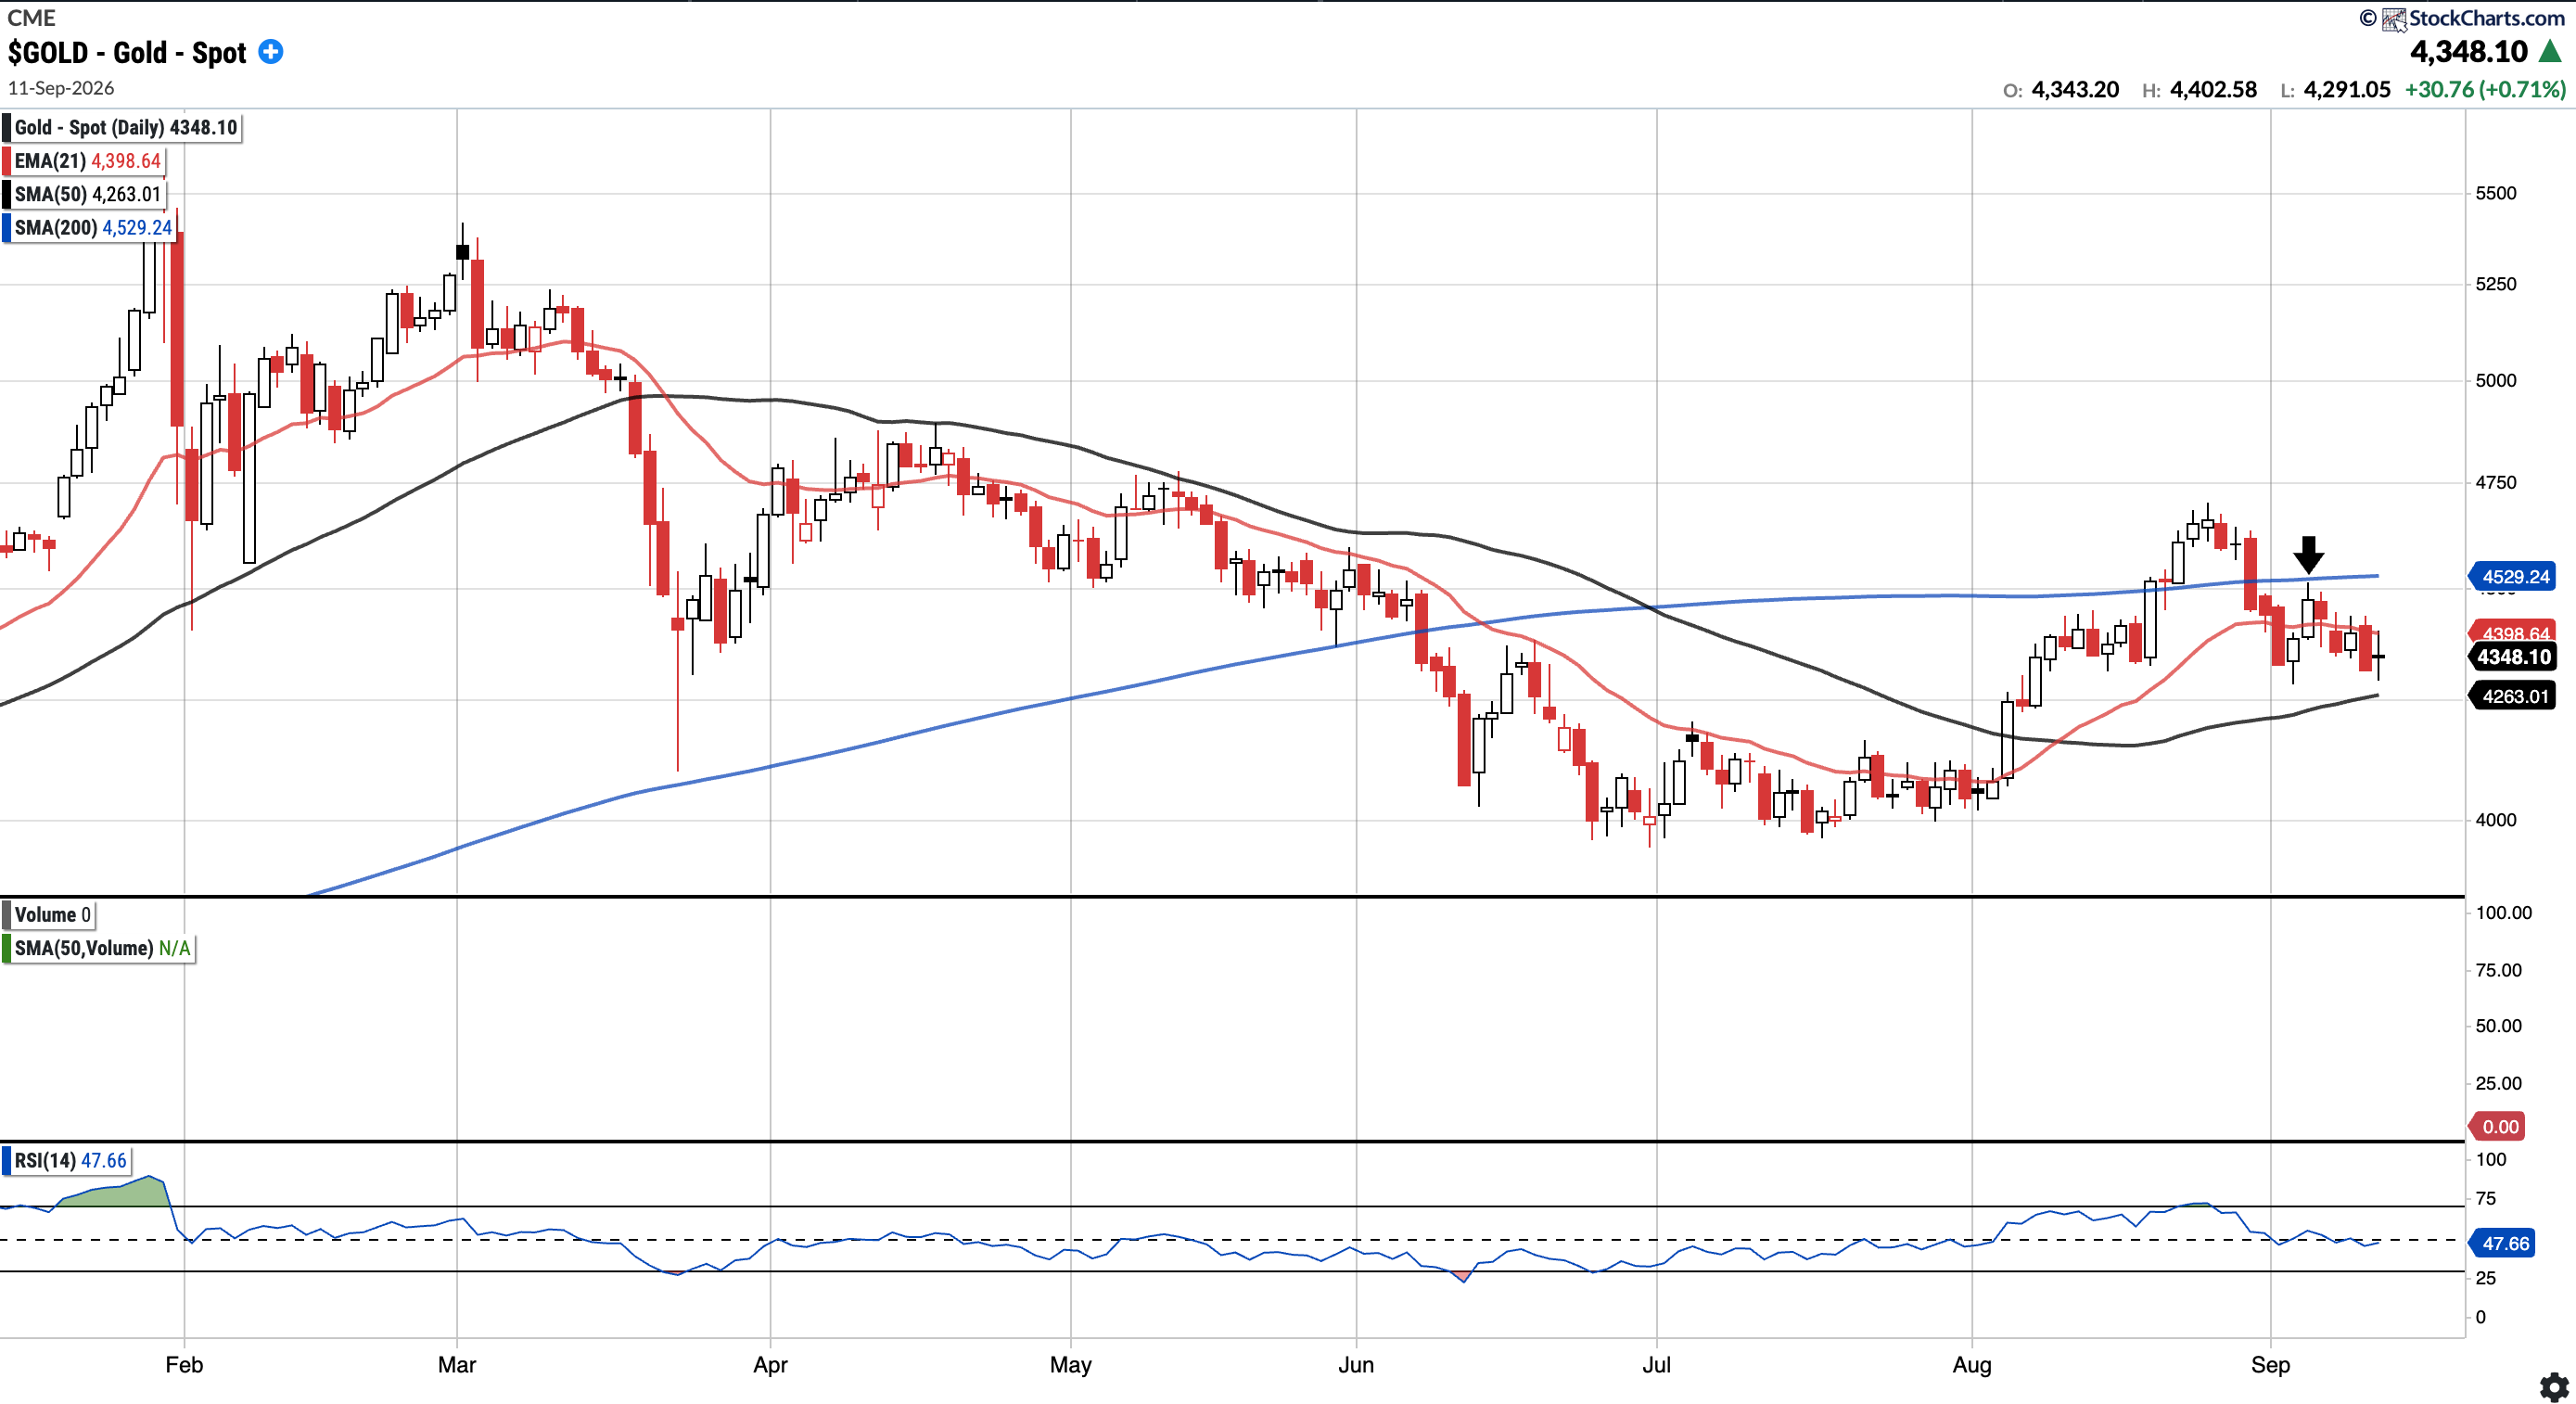
Currently trades at $4348.10, 2.00% above the 50SMA and 4.00% below the 200SMA.
RSI 47.66
YTD +0.04%
Gold struggled to break above the 21 EMA this week after it was rejected at the underside of it’s 200 SMA last week (see arrow). Price continues to remain above the 50 SMA, but bulls will want to see price clear the 200SMA soon.
SOXX
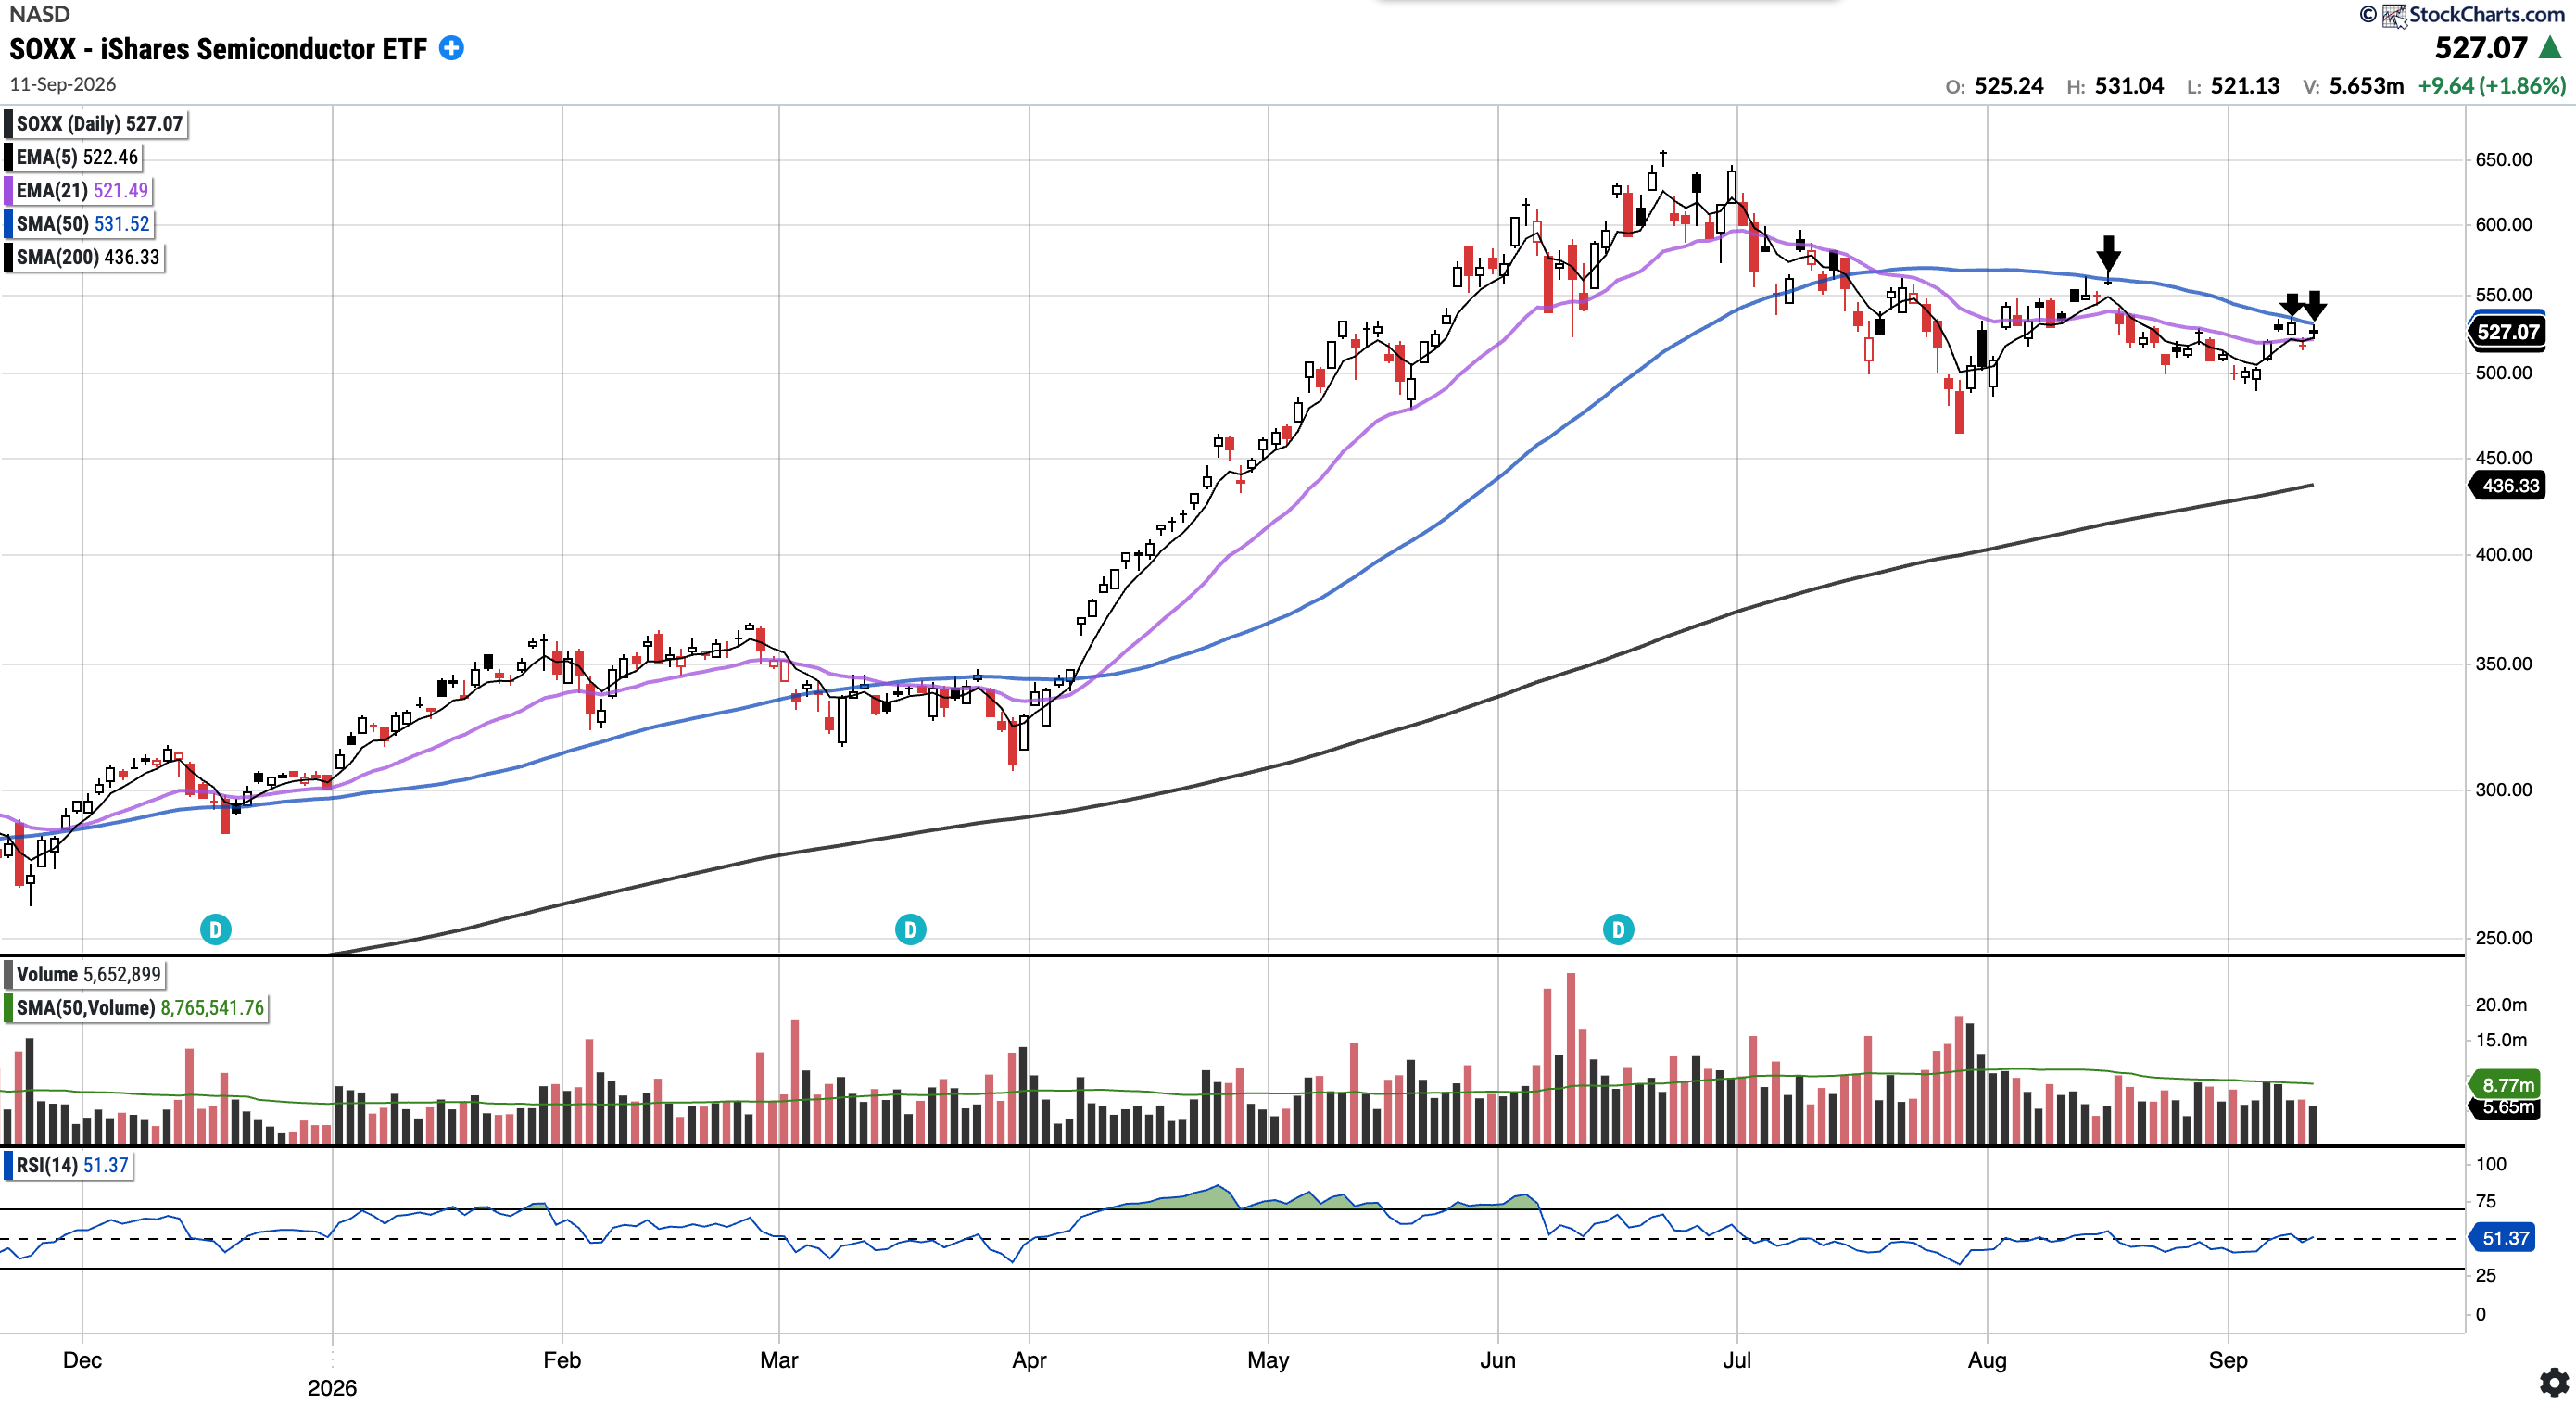
Currently trades at $527.07, 0.84% below the 50SMA and 20.80% above the 200SMA.
RSI 51.37
68.21% YTD
SOXX continues to trade below its 50 SMA, which is acting as resistance, though it managed to close just above the 21 EMA. As I noted last week: “Bulls will want to see both the 21 EMA and the 50 SMA reclaimed to restore longer-term momentum.” Clearing the 21 EMA and securing a 5/21 EMA cross are constructive signs, but bulls will now want to see a decisive reclaim of the 50 SMA.
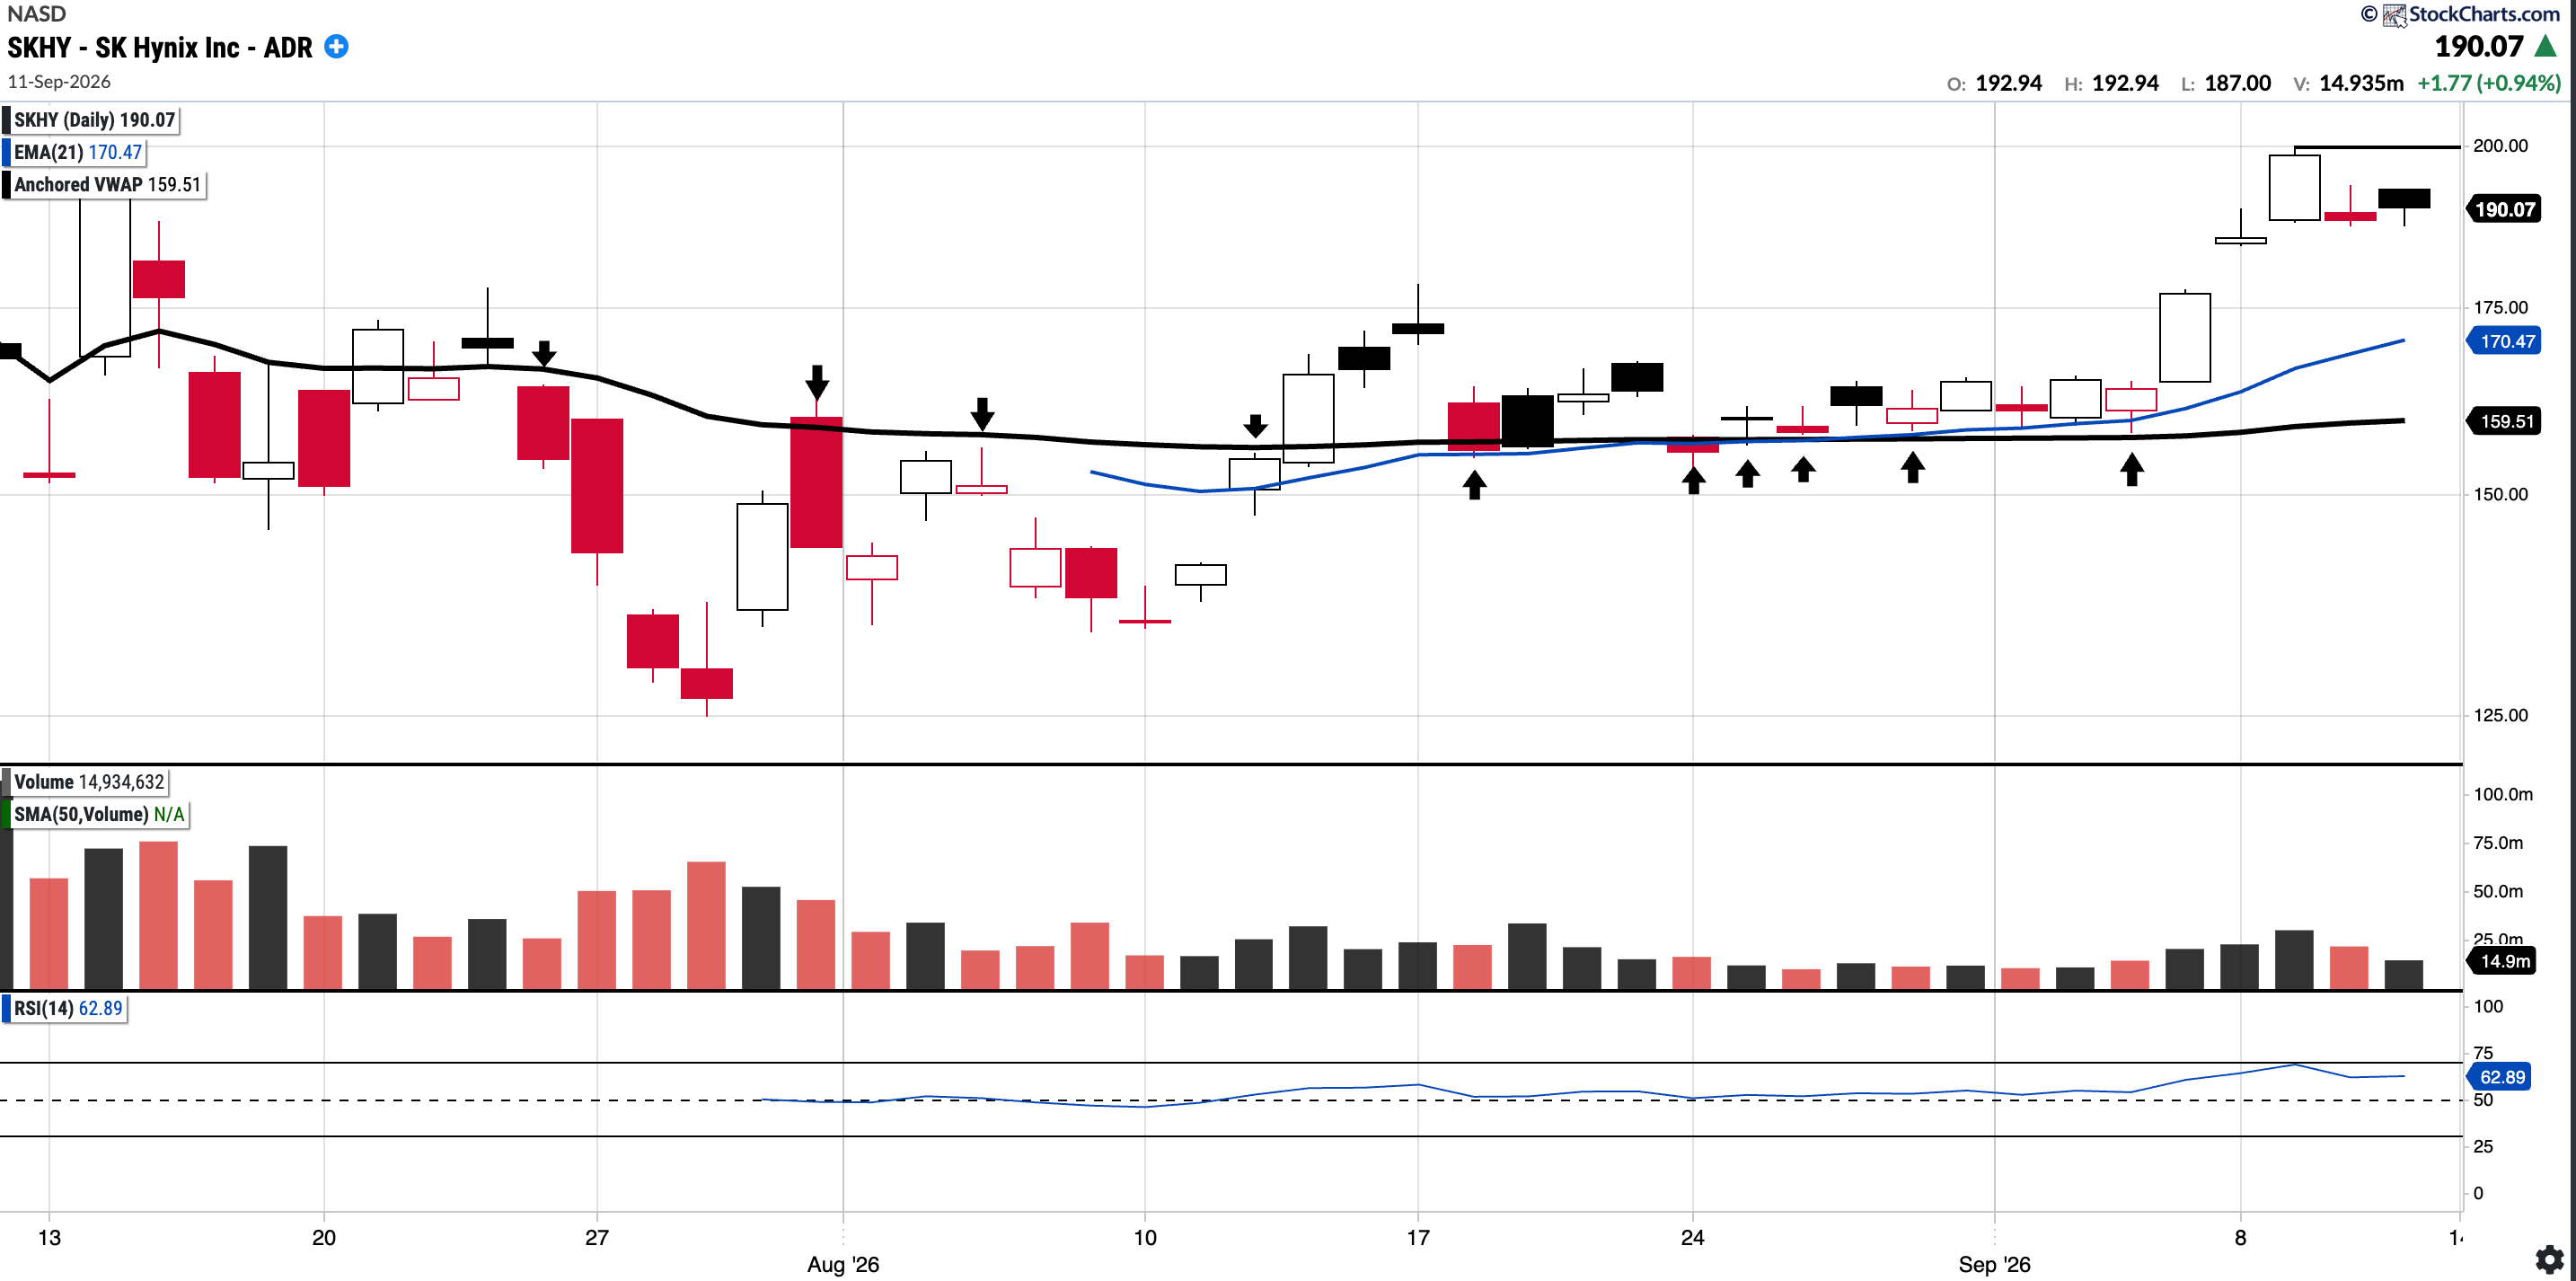
SKHY (Currently Long)
Currently trades at $190.07
RSI 62.89
13.13% YTD
As we noted last week: “Bulls will want to see IPO AVWAP continue to hold, the 178 resistance breached, and then a new ATH.” SKHY delivered exactly that this week, hitting a new ATH and running up to test 200, where it met resistance. We trimmed our position at 197 and 199, sending the alerts to all free and paid subscribers as it happened.
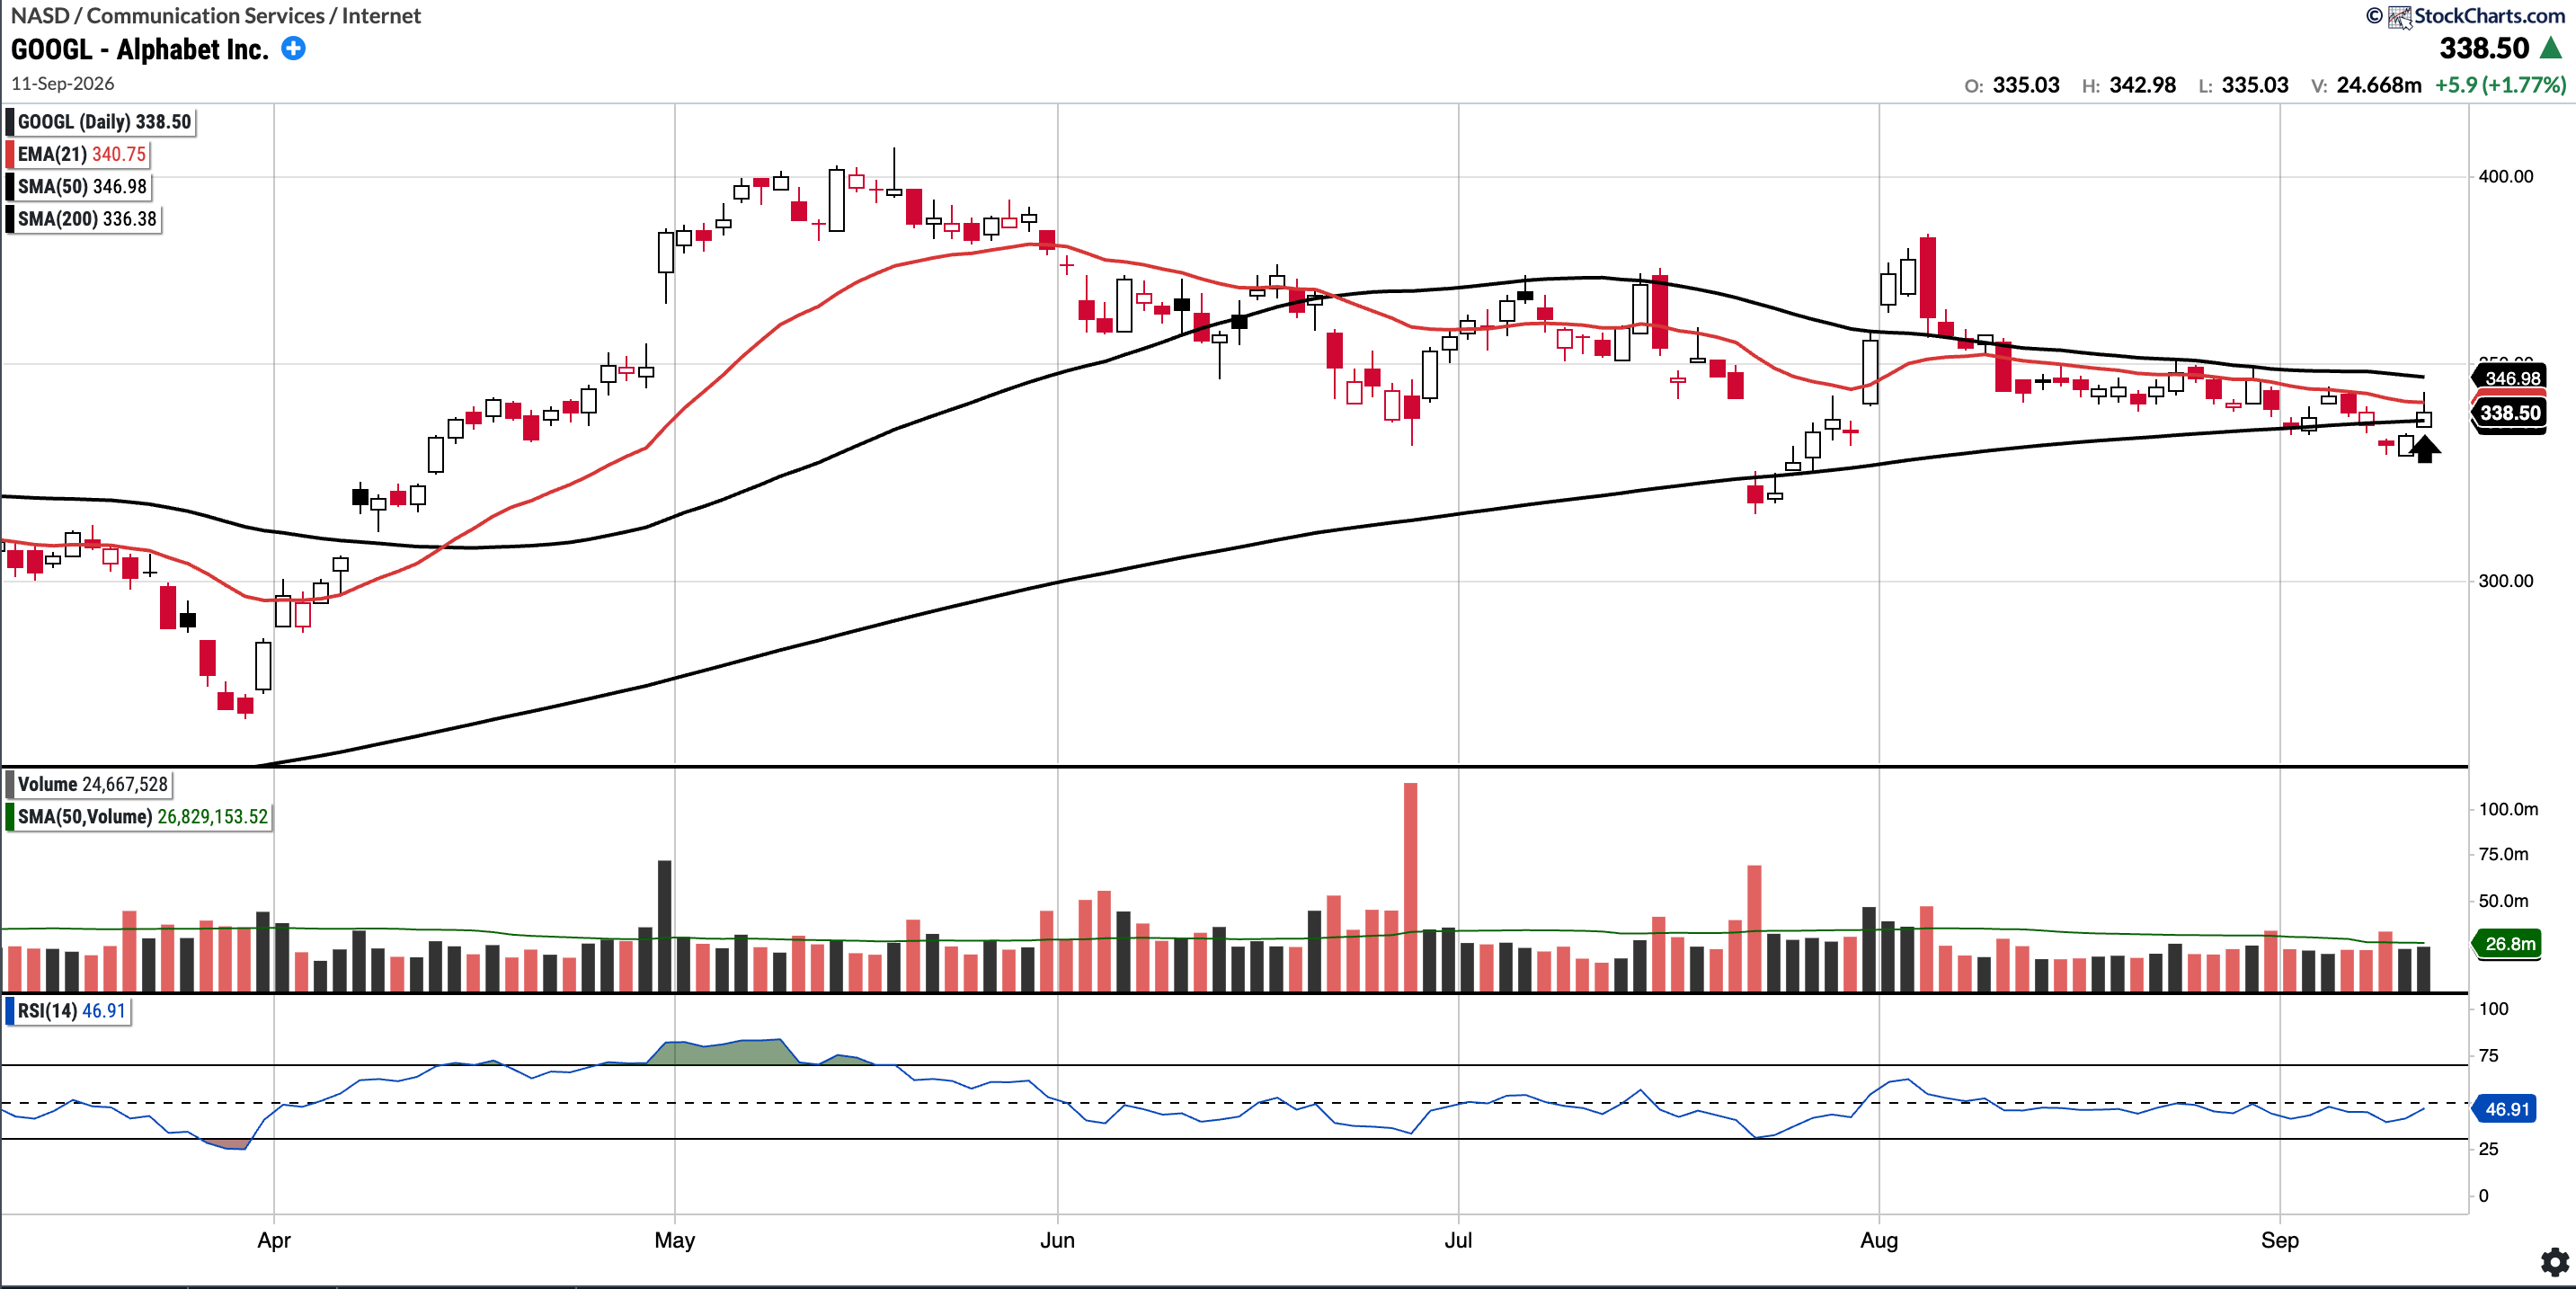
GOOGL (Currently Long)
Currently trades at $338.50, 2.44% below the 50SMA and 0.63% above the 200SMA.
RSI 46.91
7.62% YTD
Over the last 15 years, buying GOOGL on a reclaim of the 200-day simple moving average has produced an average 12-month forward return of roughly 32–35% (Source: Grok). It’s worth noting that Google closed the week back above the 200 SMA, and bulls will want to see that hold. The 50 SMA, currently at 346, is the next level to reclaim.
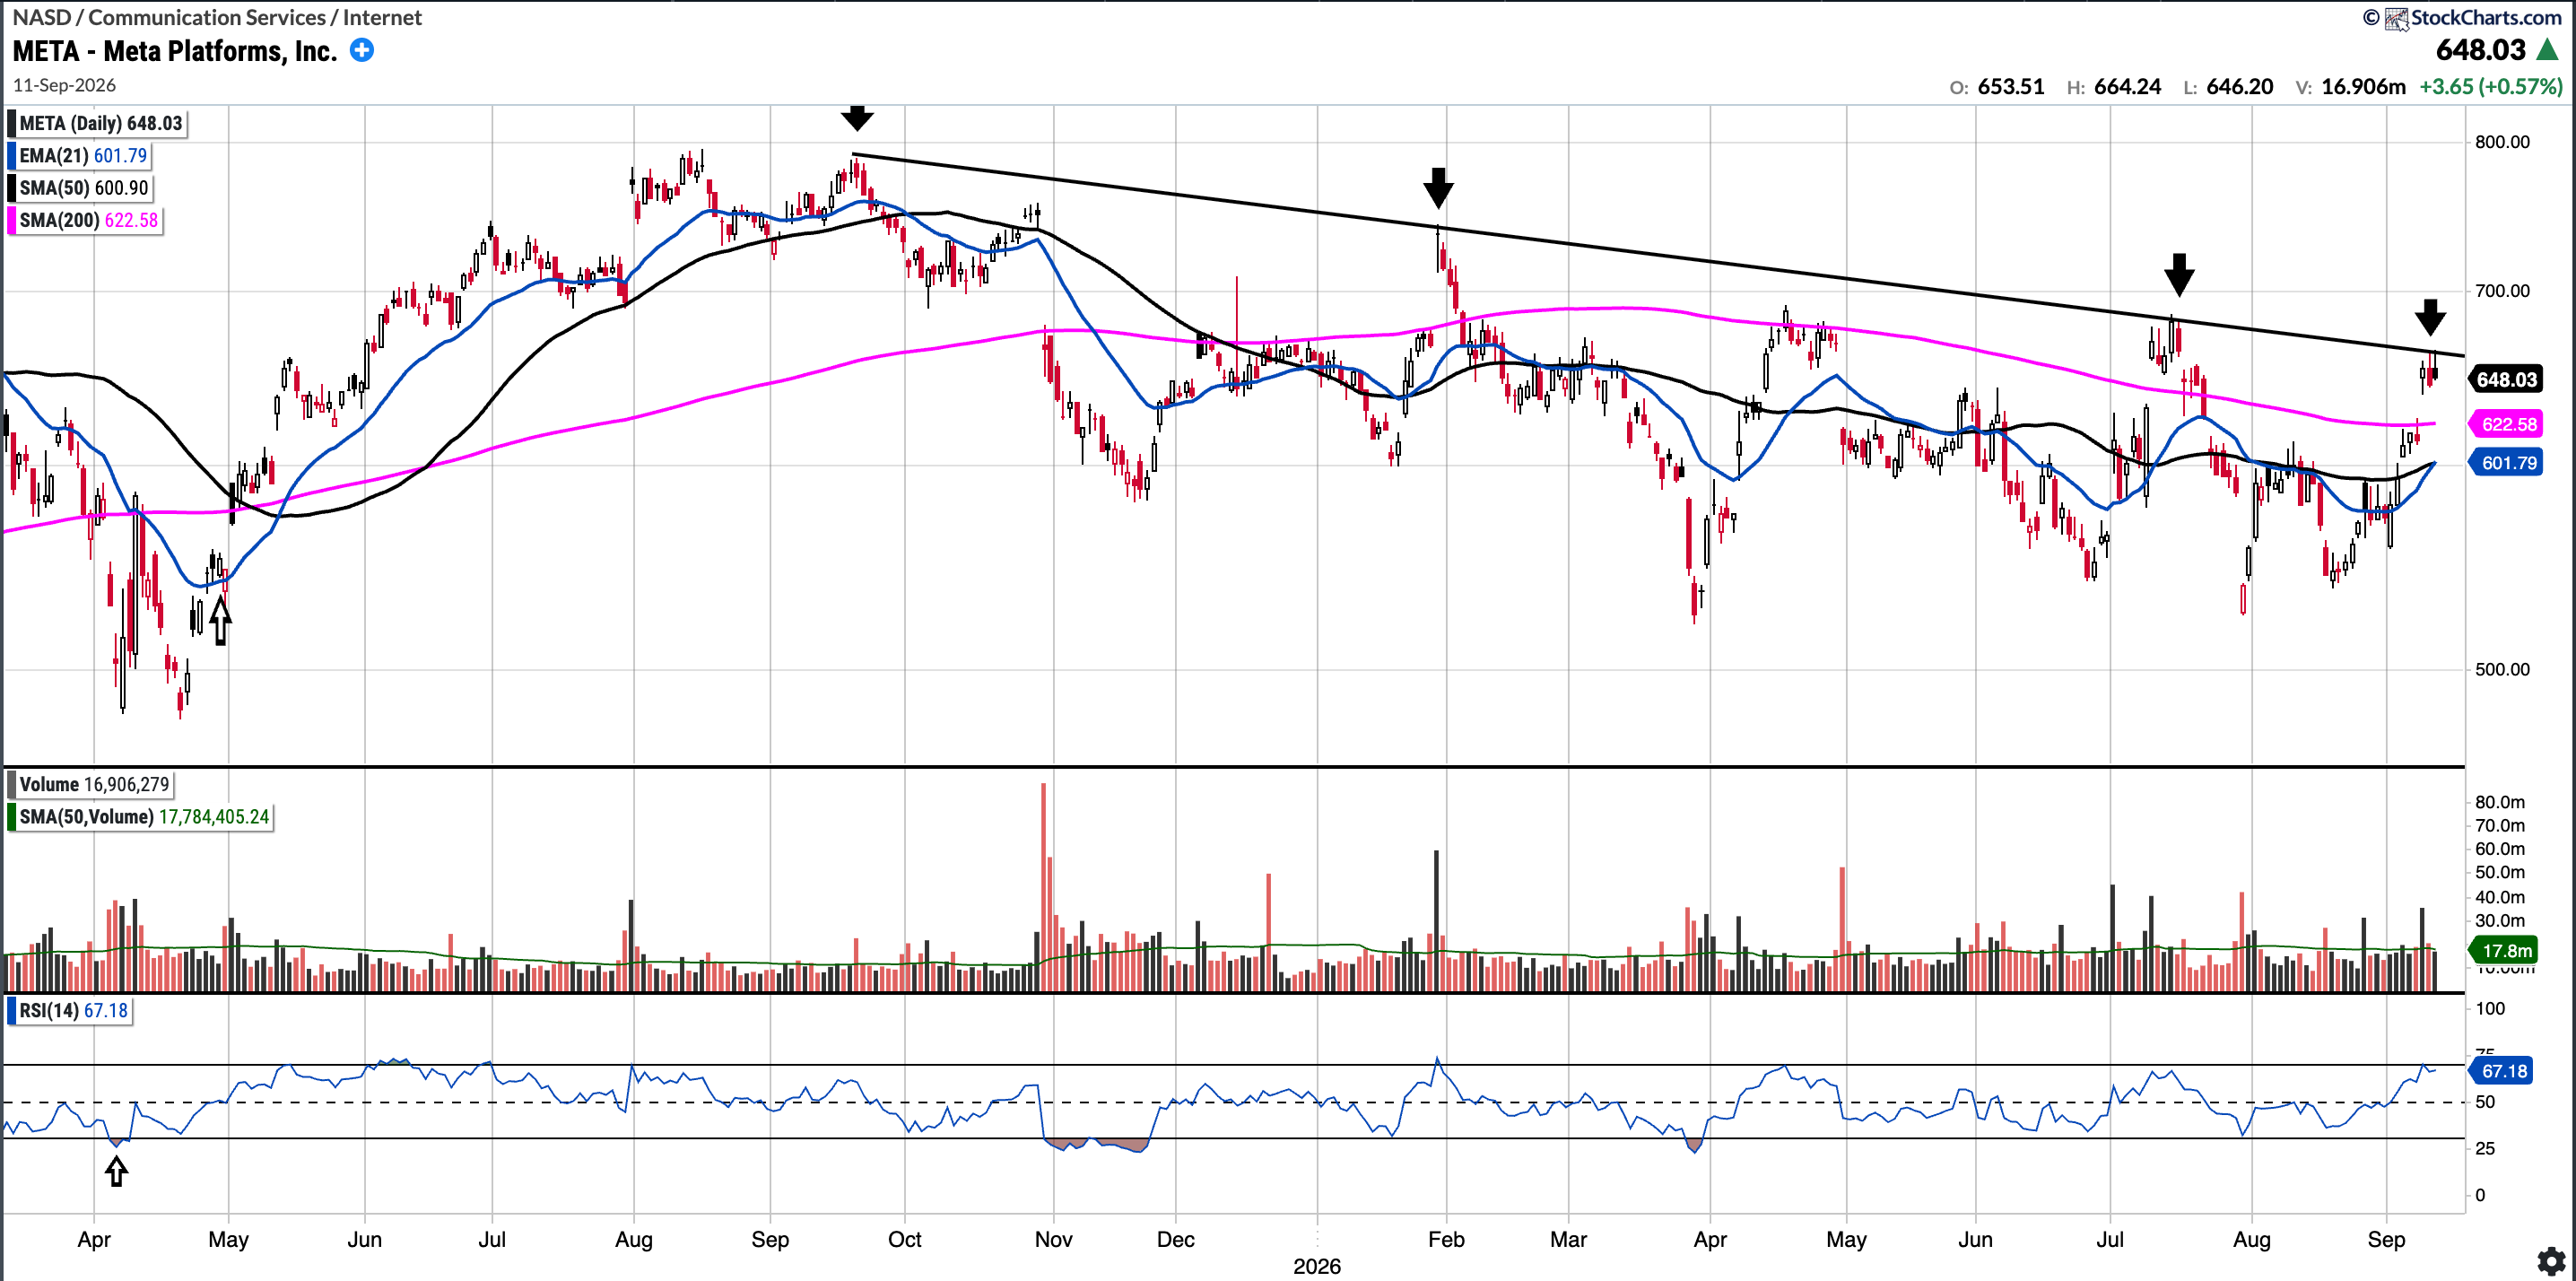
META (Currently Long)
Currently trades at $648.03, 7.84% above the 50SMA and 4.09% above the 200SMA.
RSI 67.18
-0.19% YTD
META reclaimed the 200 SMA this week on the back of releasing Muse, its new AI agent. The stock rallied into the mid-$660s before somewhat predictably finding resistance at the diagonal trendline that has served as resistance for many months now (see arrow). Bulls will want to see a breakout of that trendline and a close above it soon.
Conversely, some may prefer to trade short versus that level with a tight stop.
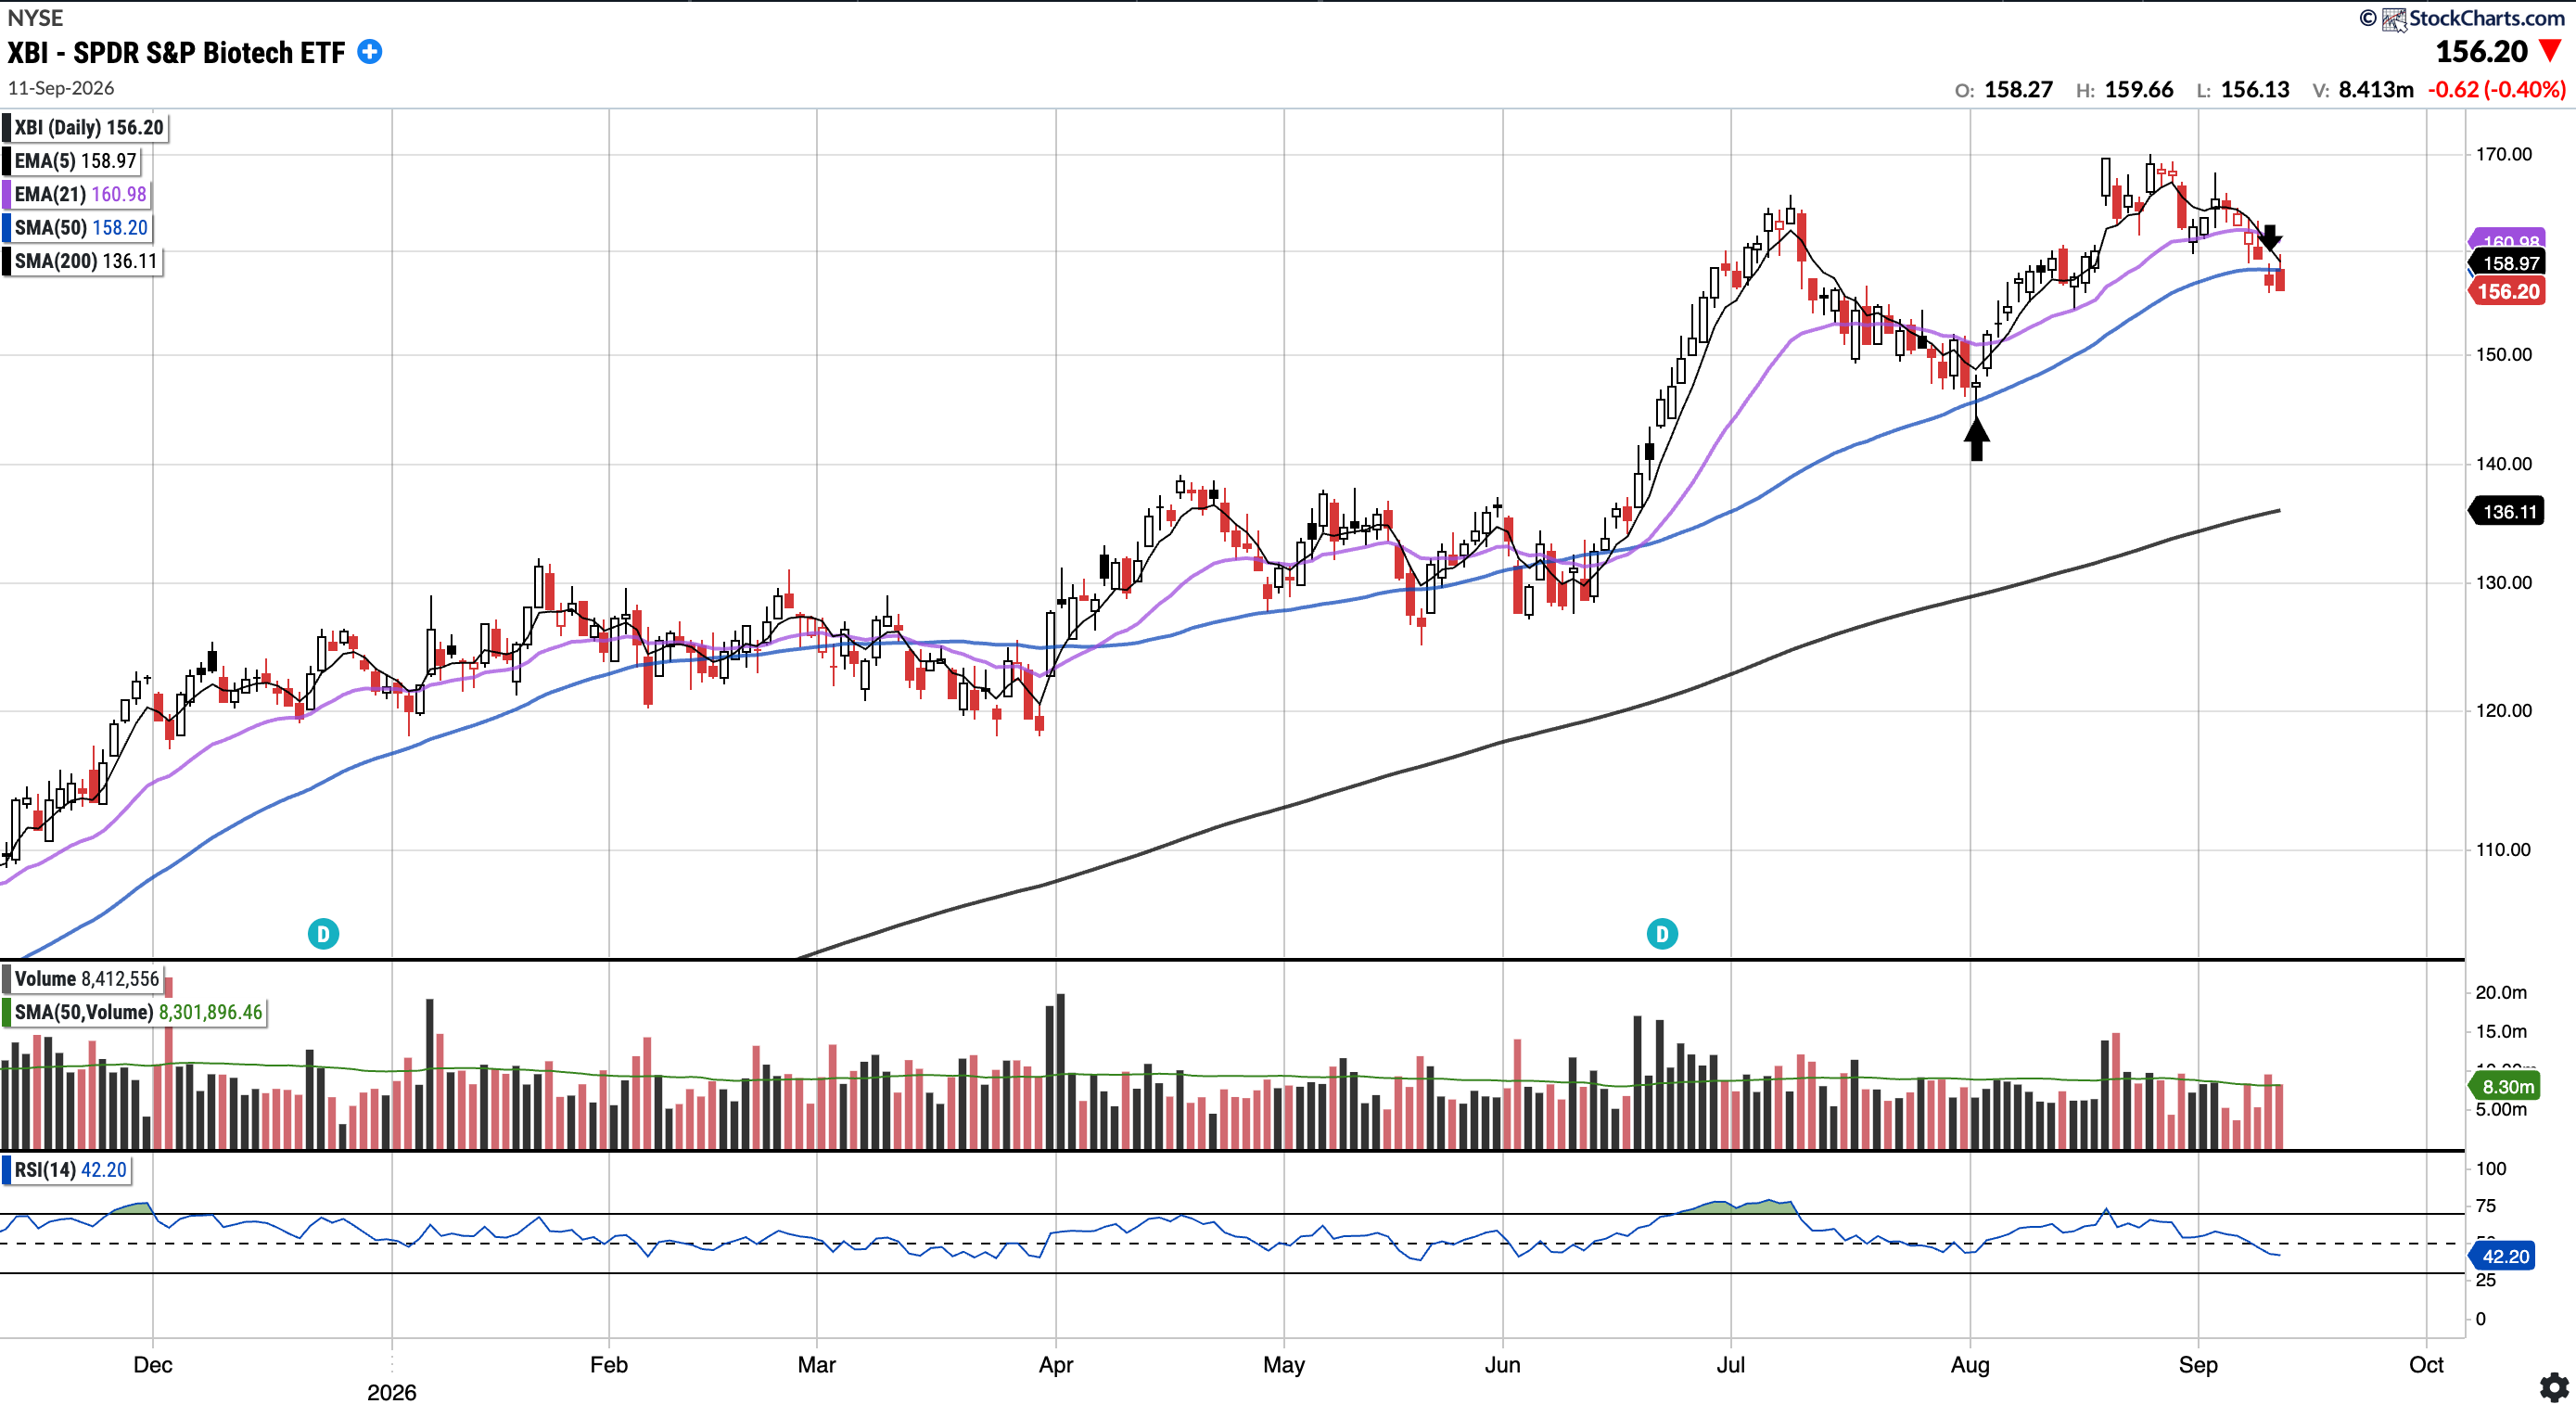
XBI
Currently trades at $156.20, 1.26% below the 50SMA and 14.76% above the 200SMA.
RSI 31.22
28.66% YTD
Last week I highlighted: “If price can stay above the 21 EMA, we can see a continuation of the rally. Otherwise, a selloff to the $158 support (50 SMA) is not out of the question.” . This week, we saw that play out as price fell below the 21 EMA and sold off beyond the $158 support level. Price closed the week below the 50 SMA, which is not constructive.
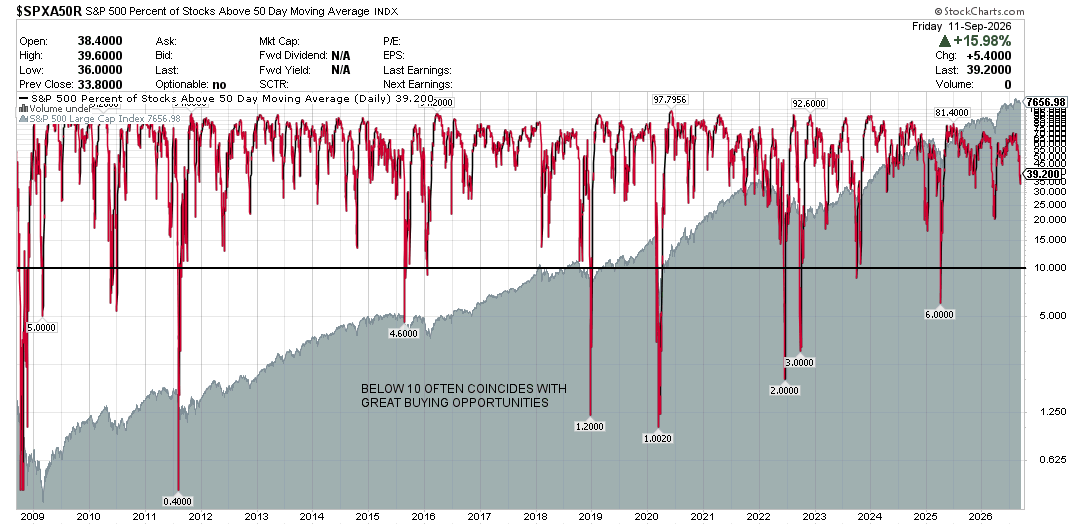
S&P 500 Percentage of Stocks Above the 50 Day Moving Average: Currently 39.2%
Breadth decreased significantly this week, with the percentage of stocks above the 50-day moving average now at 39.20% compared to 47.8% last week.
Notable portfolio changes in previous week (all updated live in subscriber channels):
NOW — Removed cost basis at 148 for the +60% gain.
CIFR — Exited cost basis at $19.23 for +28% gain, on round 6 trading this stock each time profitably.
IMPORTANT: To familiarise yourself with the notification process, please read the following post regarding the notification system.
I have also included the link to the Live Updates thread on the Substack chat below, which is where I post all moves related to my investment account. Turn the notifications on and access via following link: Live Updates Thread
Note that these updates are posted simultaneously on Discord as well.
Current Positions in Size Order with Cost Basis (Investment Account) as of September 14, 2026:
