

Hope you all are having a good weekend. Below, we will be previewing the upcoming week’s events and providing a portfolio update as usual.
Format for what is covered in this weekly preview:
A Look at the Indices
Key Upcoming Economic Events
Upcoming Earnings
Charts
Current Portfolio Holdings:
Sizing | Cost Basis | Timeframe | Planned Moves
Closing Thoughts (Scroll to here for my Market Commentary)
I recommend checking out the most recent Monthly Portfolio and Performance Update below:

For all readers a reminder that a premium subscription includes:
Live Portfolio updates (All Buys and Sells) in Subscriber only Channels
Favourite set-up Ideas, Market Memos plus Full archive
Monthly in depth portfolio & performance updates
Annual Tier: Discord access for live trading account updates and AMAs.
Indices
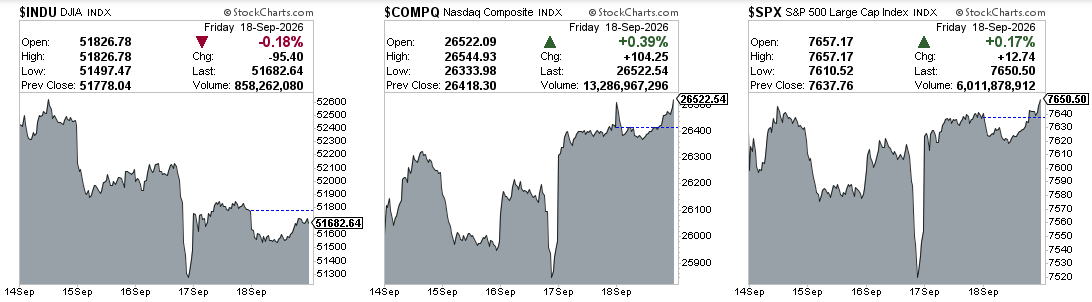
Dow Jones Industrial Average declined -1.69% in the last week
S&P 500 declined -0.08% in the last week
Nasdaq Composite advanced +0.72% in the last week
IWM declined -1.40% in the last week
Key upcoming economic events
Monday, September 21
Chicago Fed National Activity Index (August)
Fed Speaker: Chicago Fed President Austan Goolsbee
Tuesday, September 22
Richmond Fed Manufacturing Index (September)
ICSC Weekly Retail Sales
U.S. Treasury 2-Year Note Auction ($78B)
API Weekly Crude Oil Inventory Report
Wednesday, September 23
MBA Mortgage Applications
S&P Global Manufacturing PMI, Flash (September)
S&P Global Services PMI, Flash (September)
Existing Home Sales (August)
U.S. Treasury 5-Year Note Auction
EIA Weekly Petroleum Status Report
Thursday, September 24
Initial Weekly Jobless Claims
New Home Sales (August)
U.S. Treasury 7-Year Note Auction
EIA Weekly Natural Gas Storage Report
Friday, September 25
Durable Goods Orders, Advance (August)
University of Michigan Consumer Sentiment, Final (September)
Upcoming Earnings
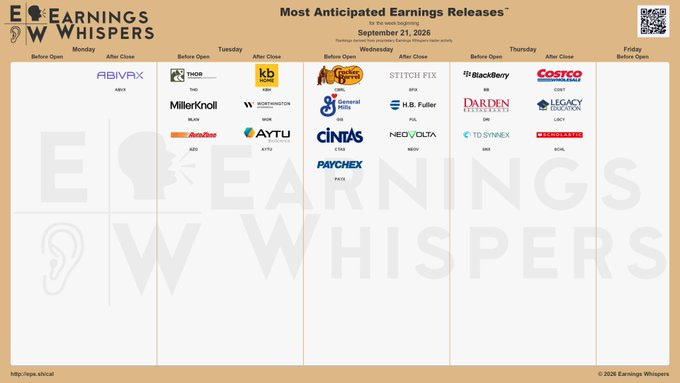
Below is the infographic by Earnings Whispers highlighting the schedule for this week:
Charts
SPX
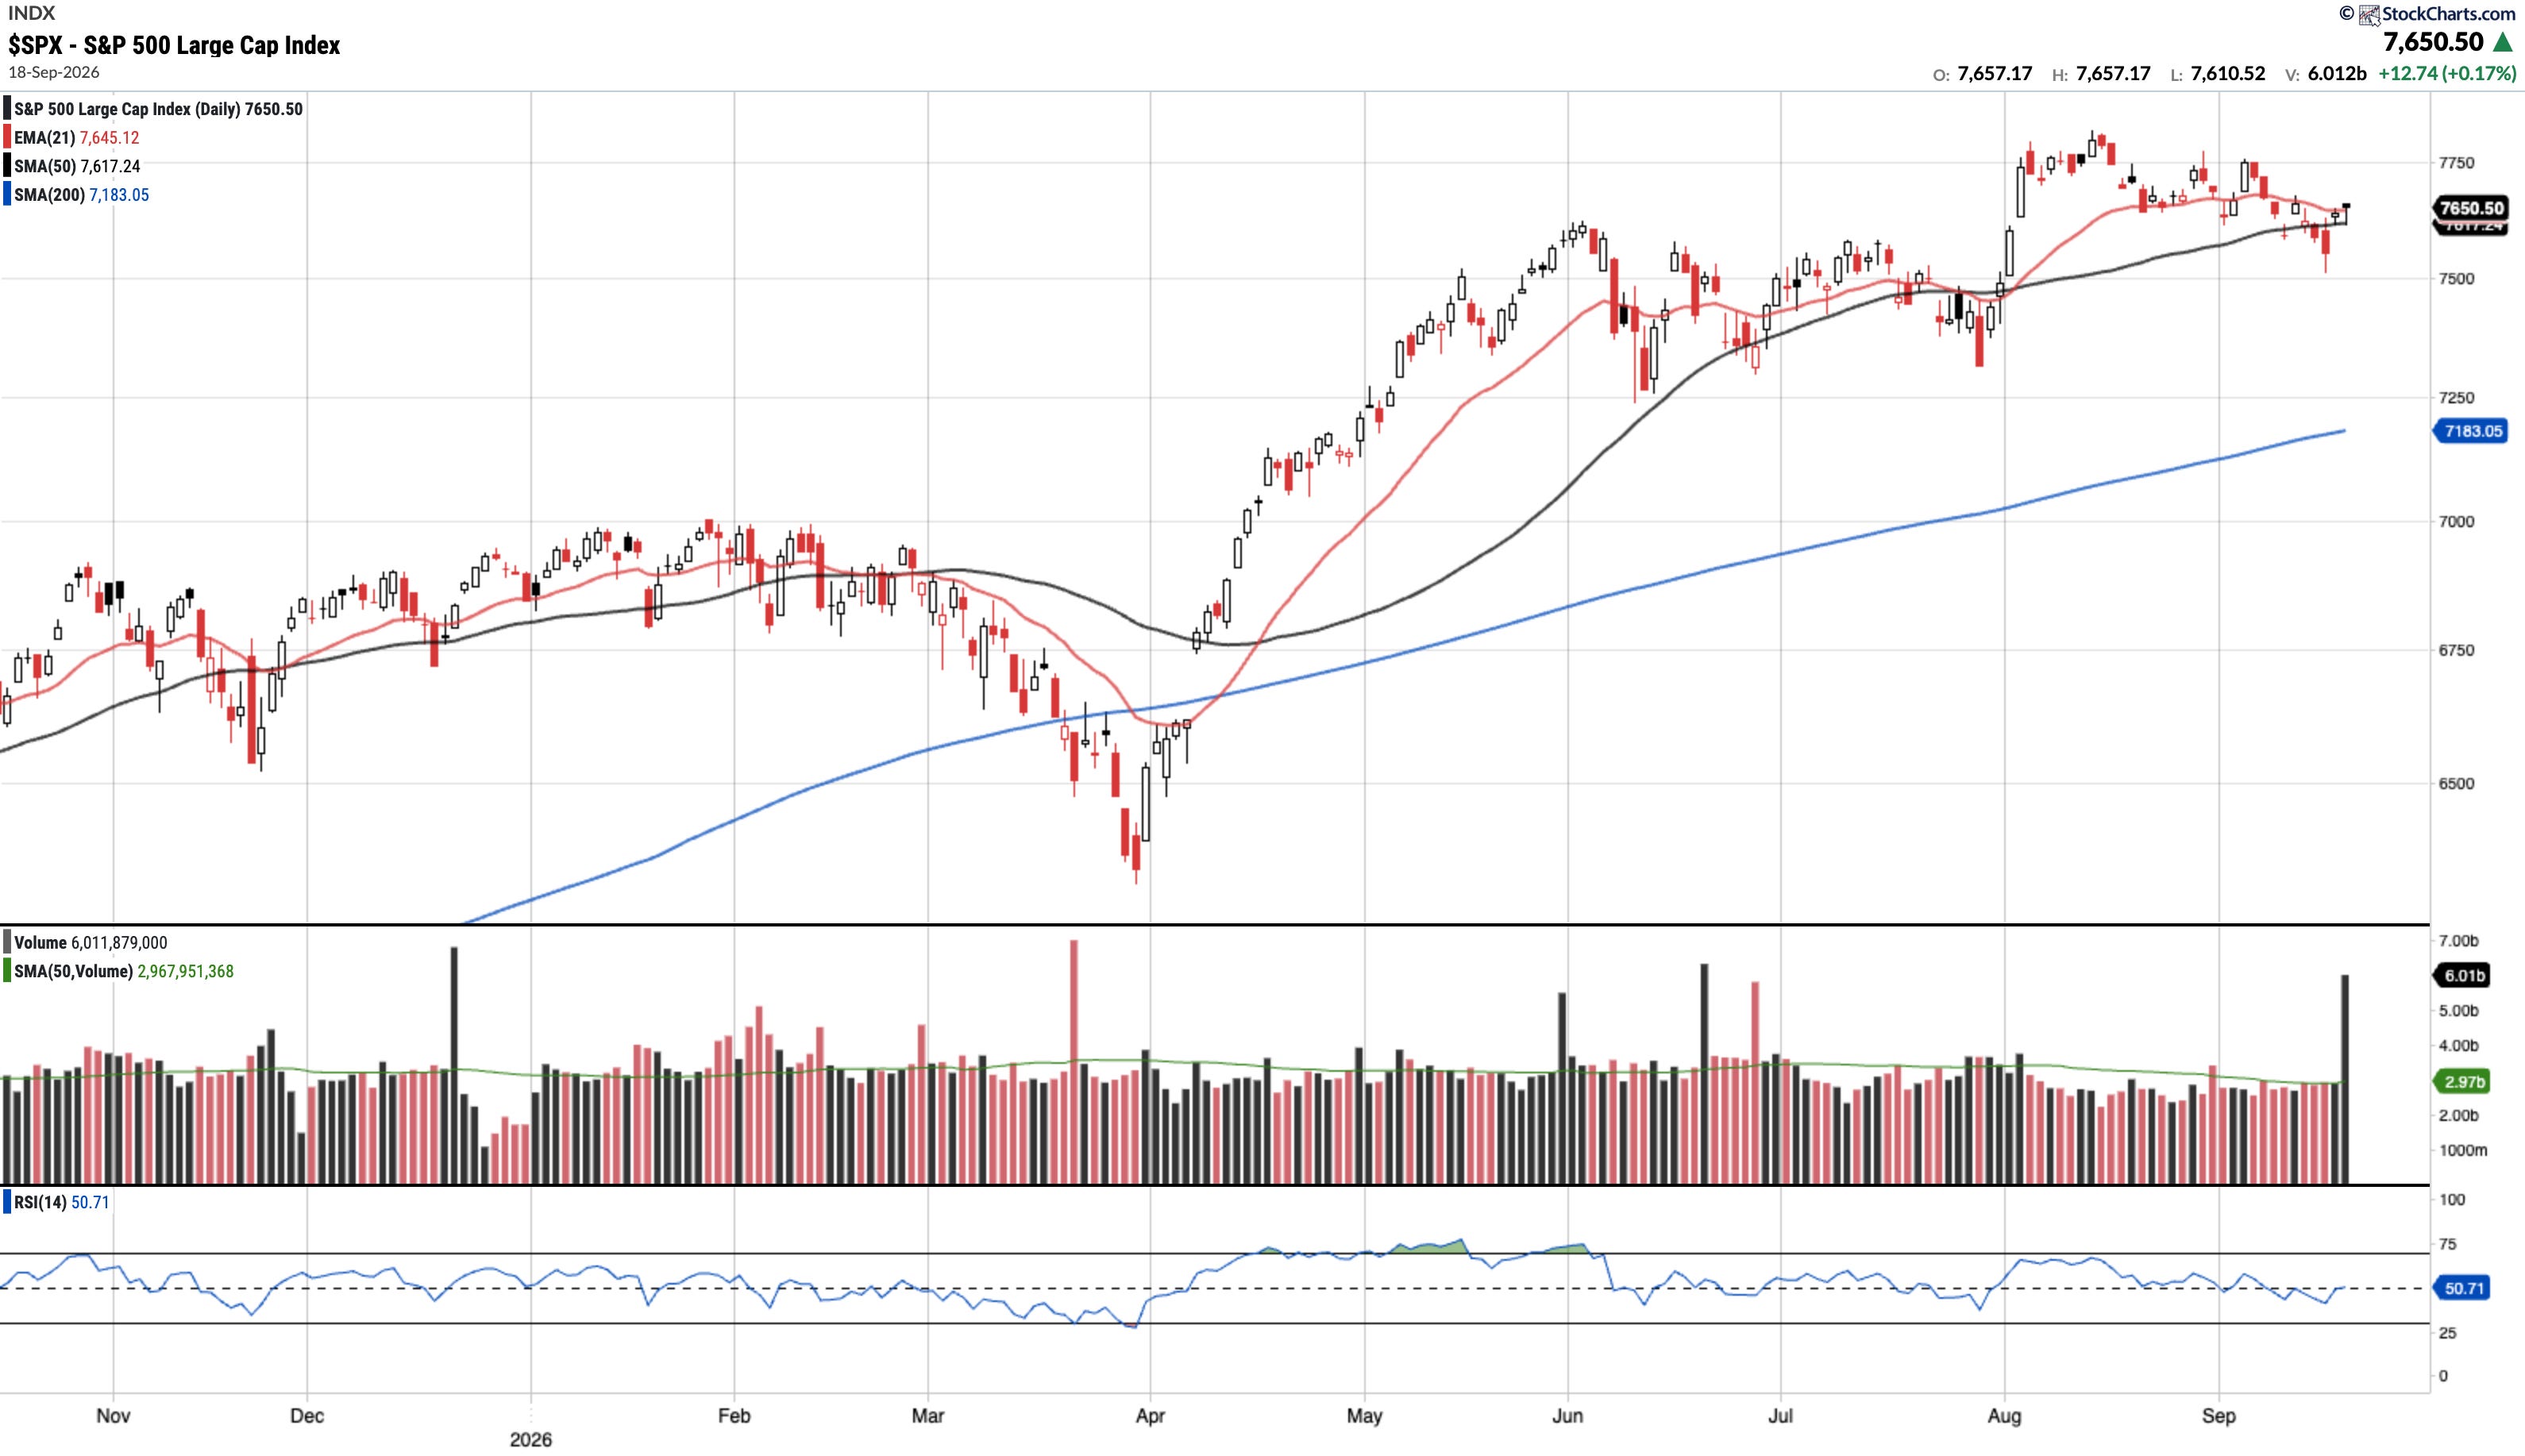
Currently trades at $7650.50, 0.44% above the 50SMA and 6.51% above the 200SMA.
RSI 50.71
11.55% YTD
Distribution days in the last week: 1
The S&P 500 dipped below its 50-day SMA mid-week but recovered to close above both the 50-day SMA and 21-day EMA. The market's reaction to the rate hike was overall muted, with the index dropping just 0.08% from last week to finish above all of its key moving averages.
COMPQ
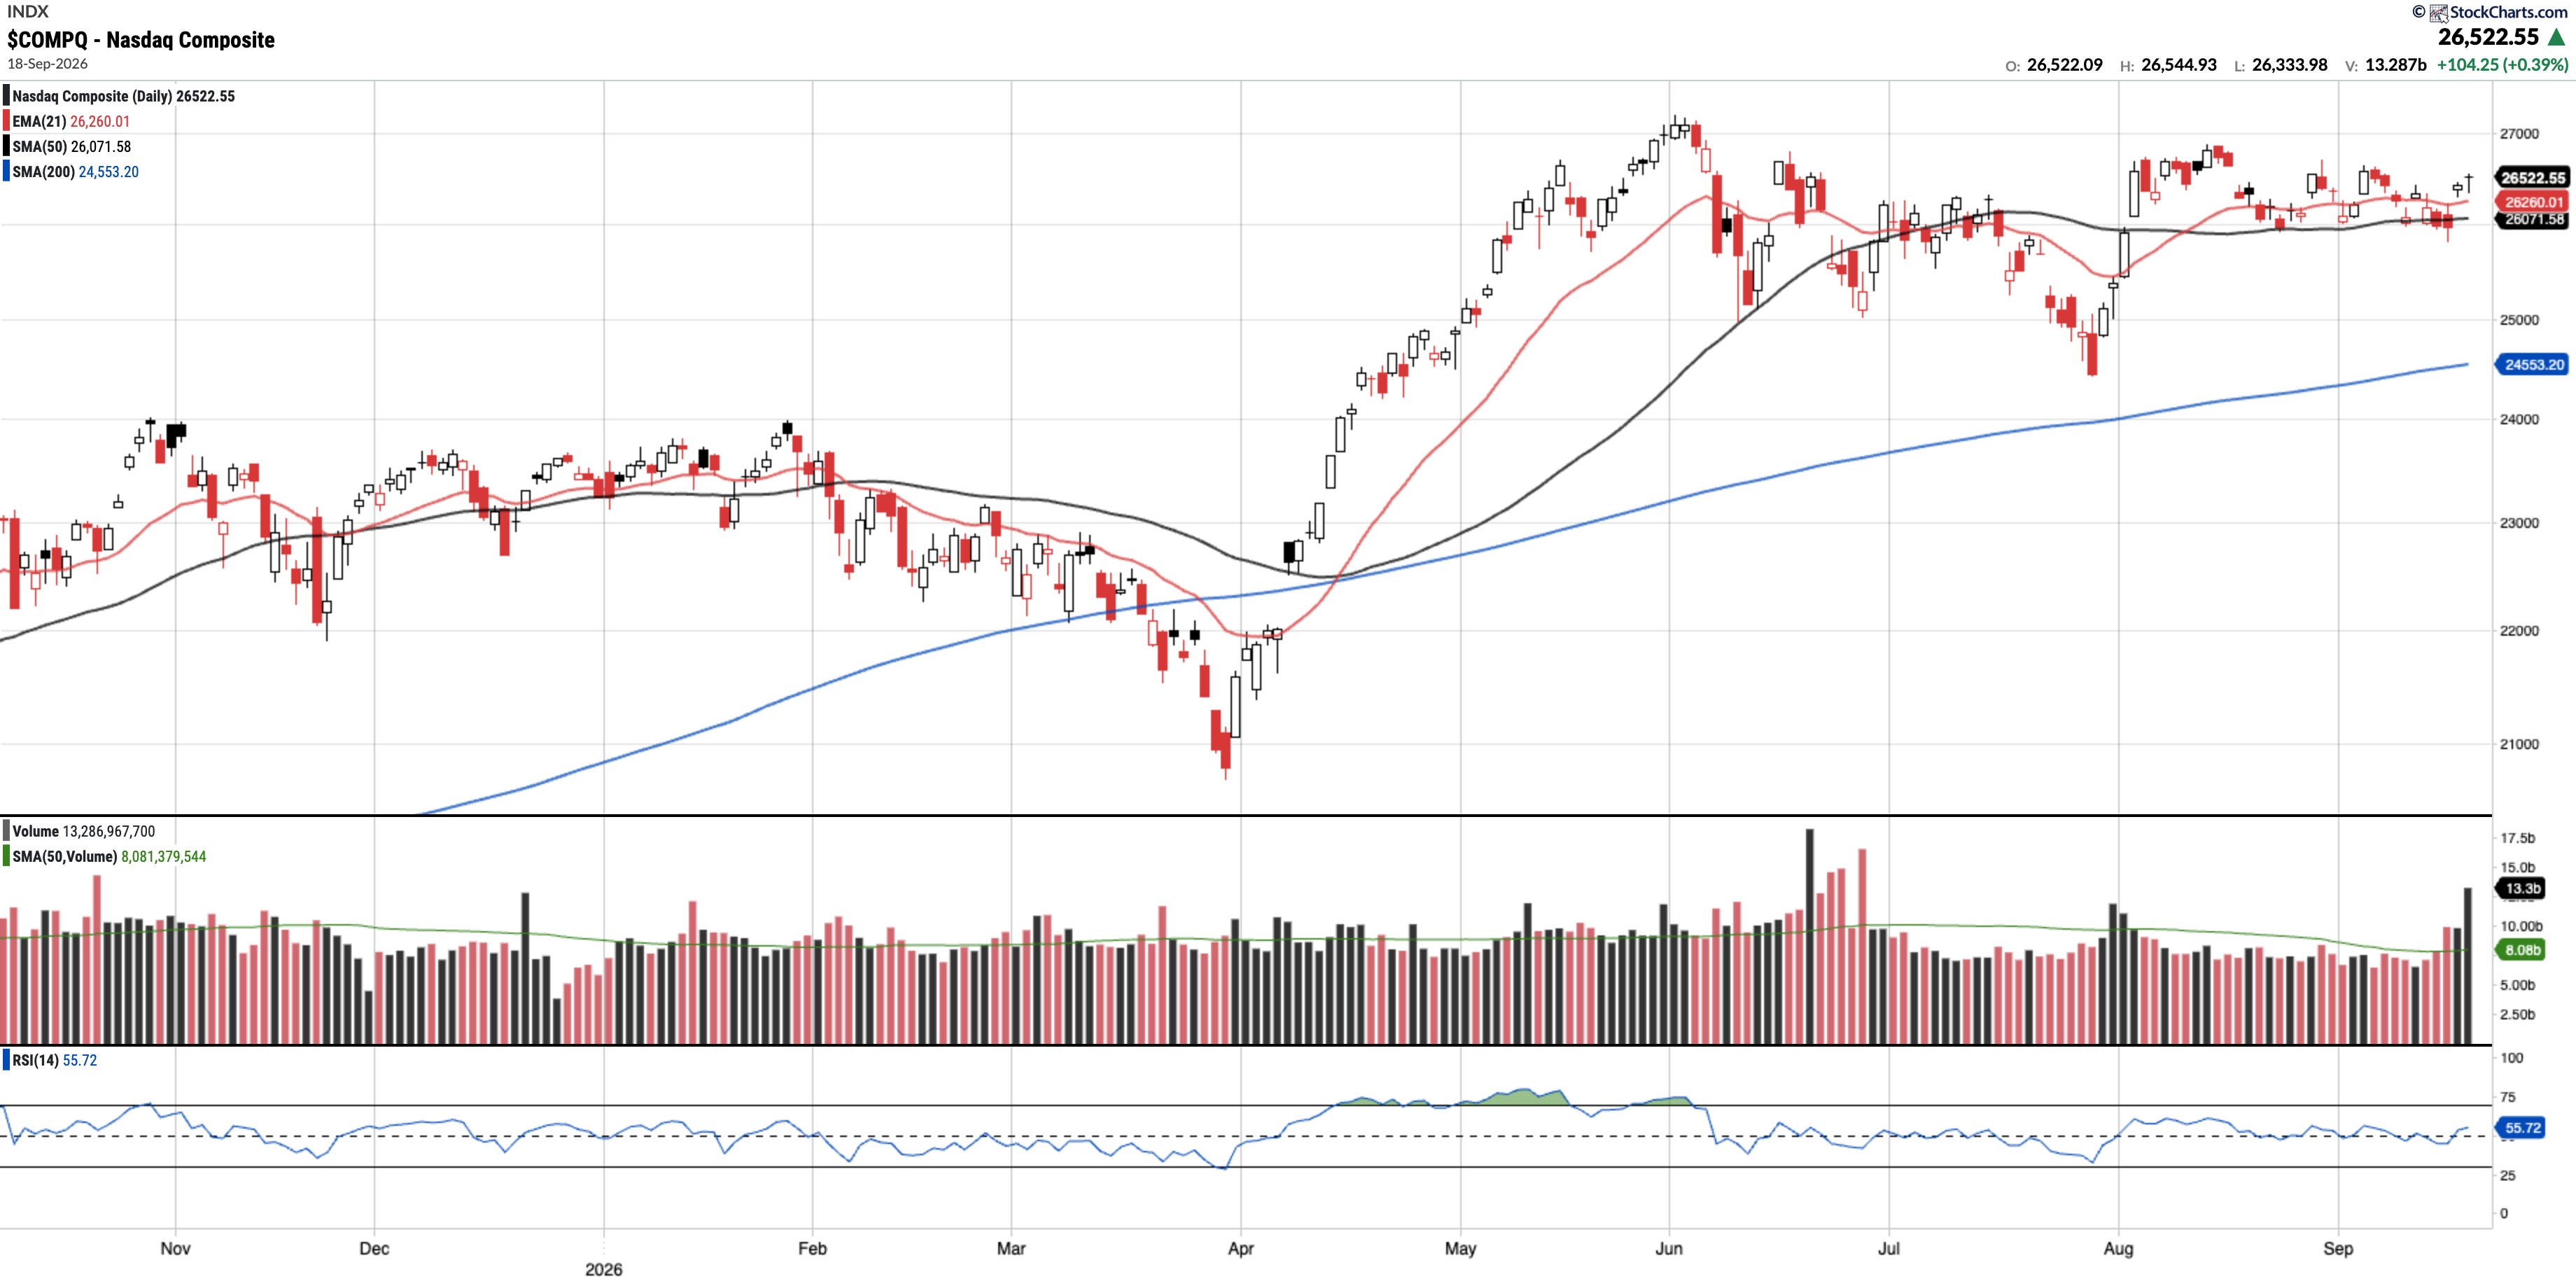
Currently trades at $26522.54, 1.73% above the 50SMA and 8.02% above the 200SMA.
RSI 55.72
14.15% YTD
Distribution days in the last week: 0
The Nasdaq remains above its key moving averages, including the 21 EMA, despite losing the 50 SMA following the rate hike. It closed higher both Thursday and Friday, continuing to consolidate in a longer term sideways range.
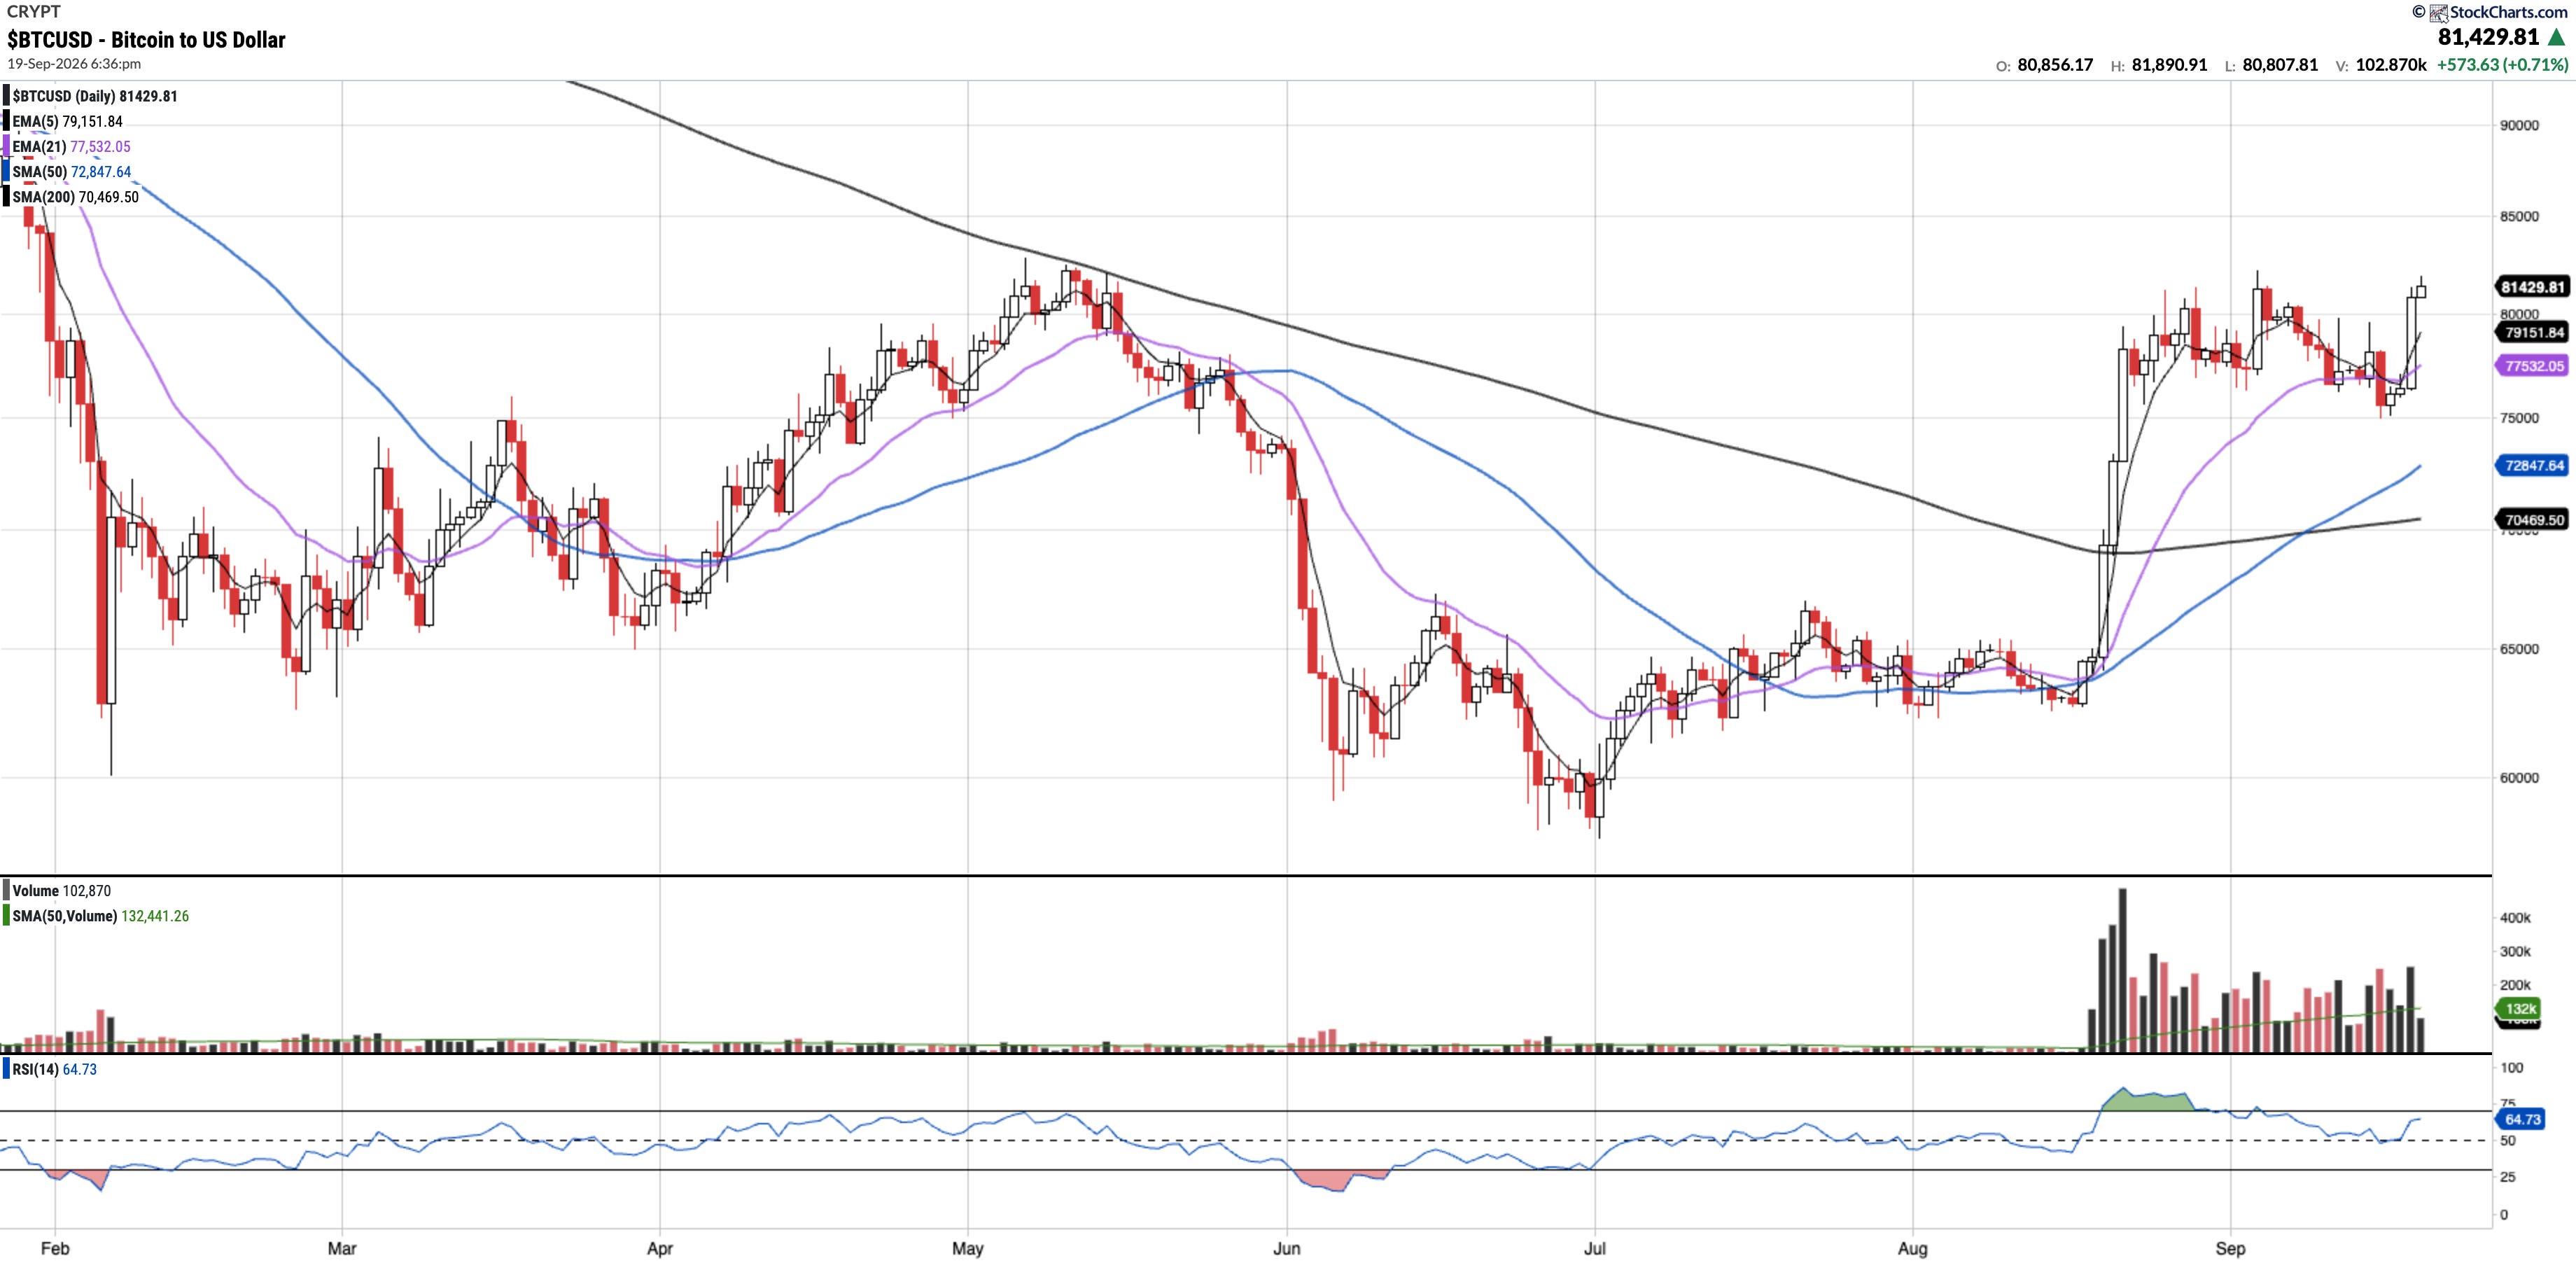
BTC (currently Long)
Currently trades at $81395.98, 11.74% above the 50SMA and 15.52% above the 200SMA.
RSI 64.73
-8.27% YTD
Bitcoin saw a strong rally off the 21-day EMA, returning to the $80K–$82K resistance level flagged in last week’s write-up. While bulls will want to see the price break above that level, closing above all key moving averages remains a positive sign.
EEM
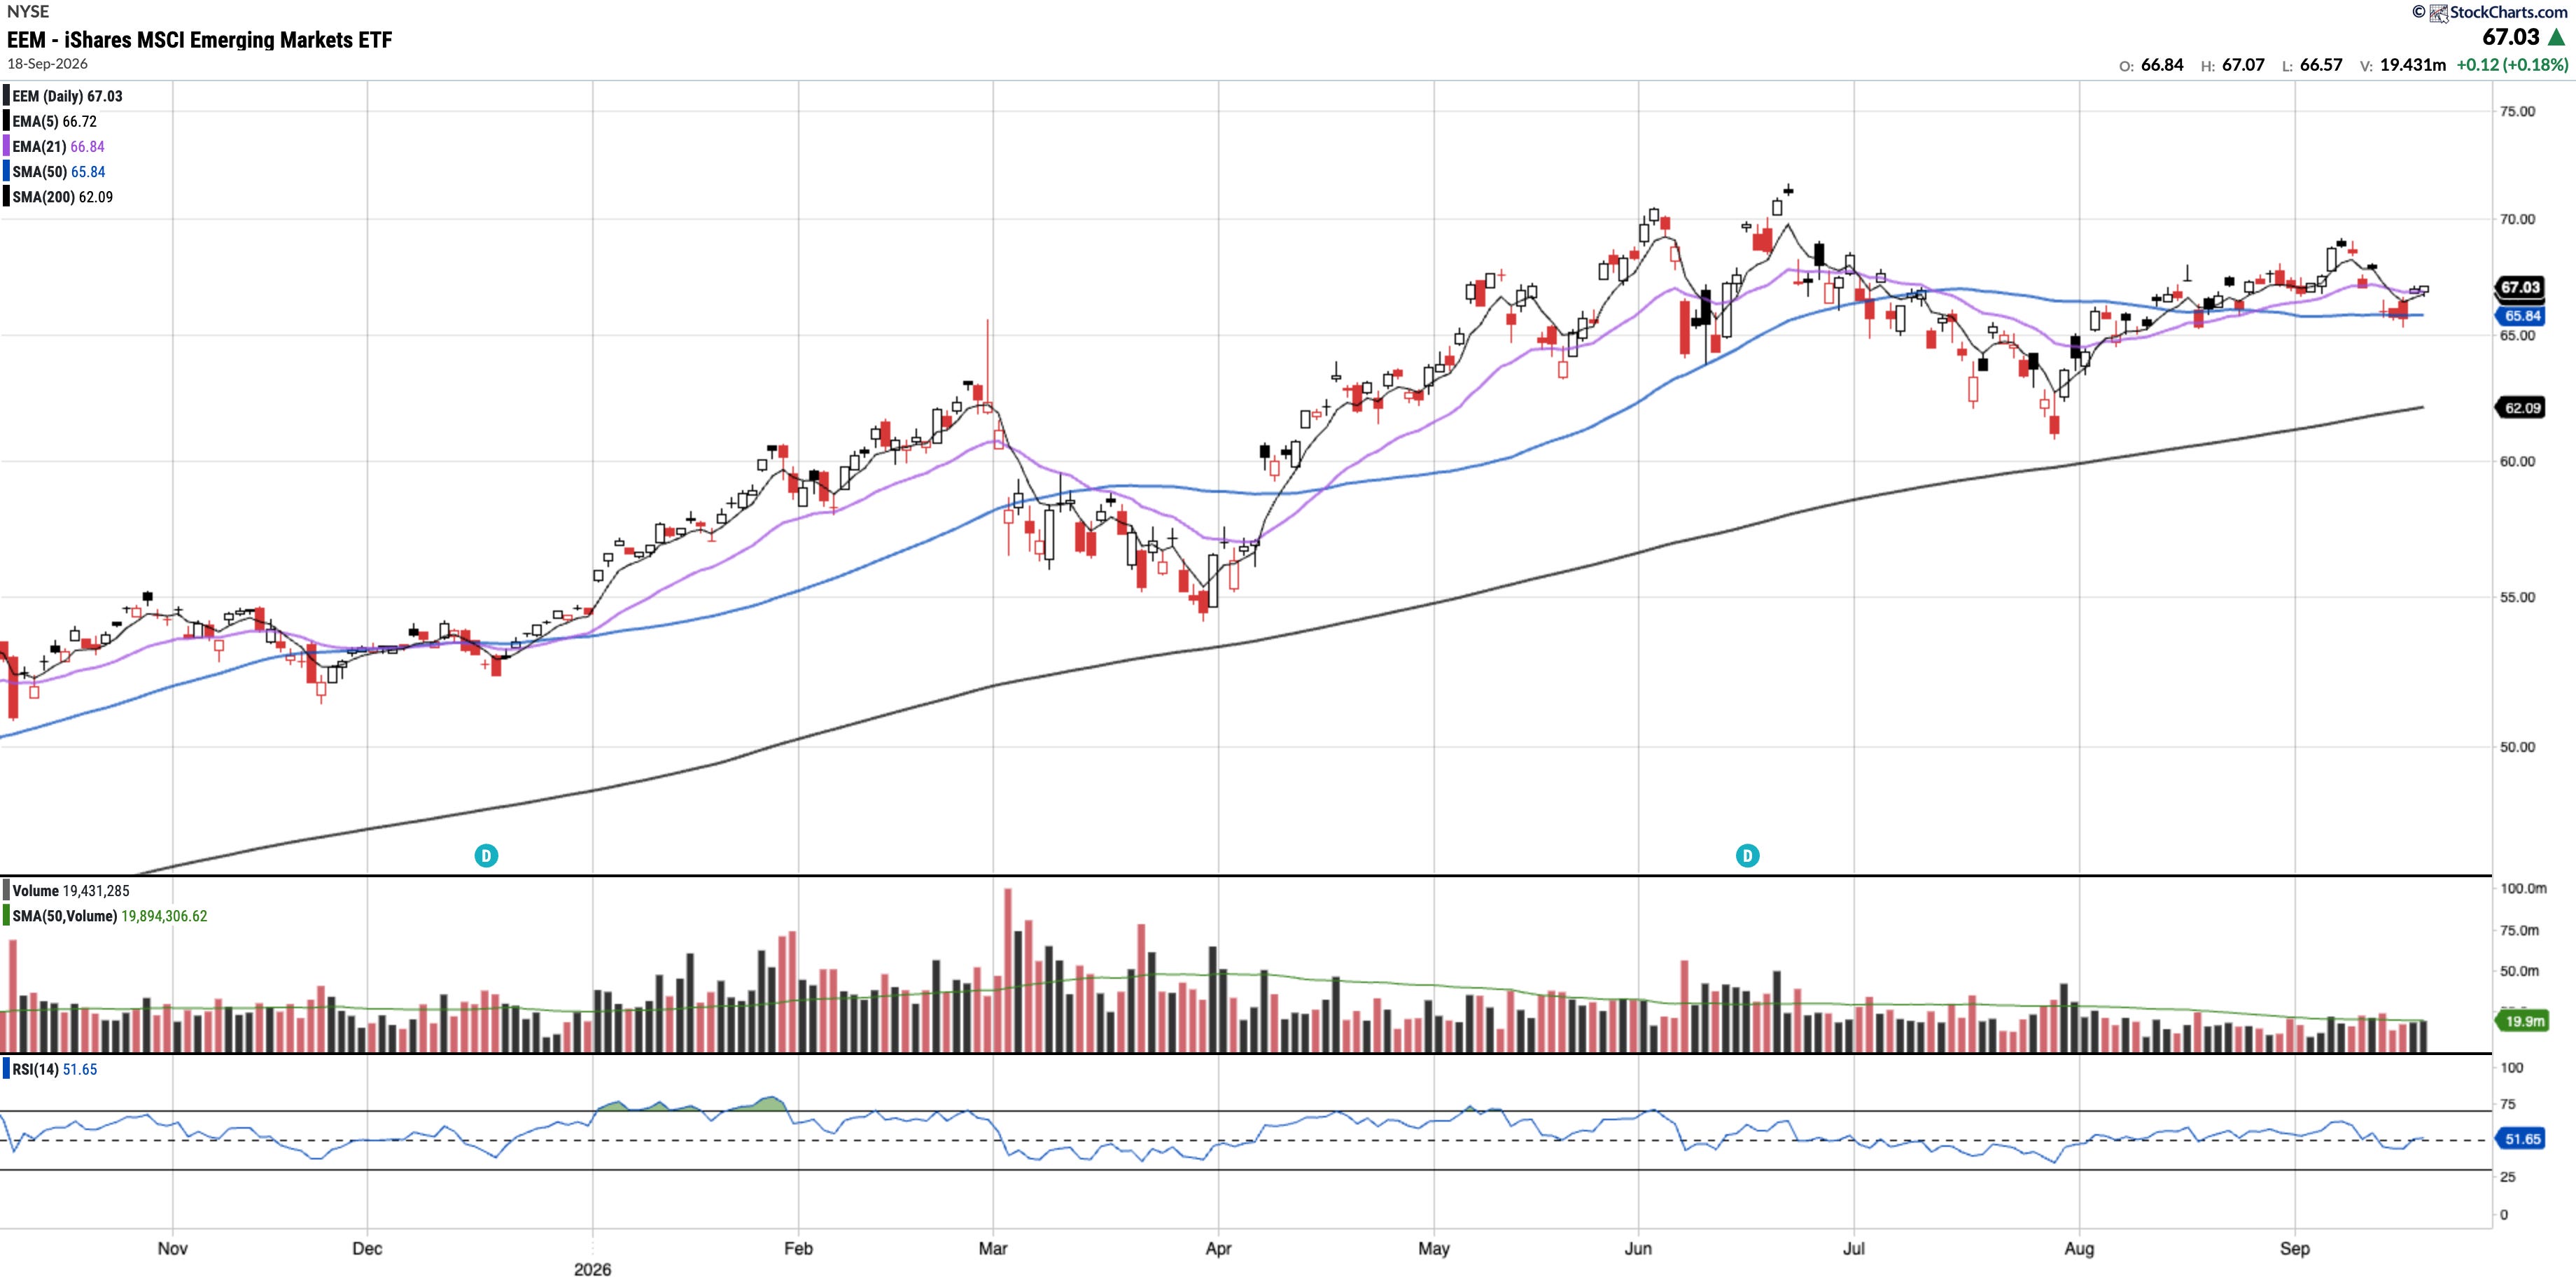
Currently trades at $67.03, 1.80% above the 50SMA and 7.95% above the 200SMA.
RSI 51.65
19.81% YTD
EEM remains in an uptrend and continues to outperform the SPX YTD, currently by around 800bps.
EEM tested and held its 50-day SMA this week, finishing above all its key moving averages. Notably, there was a 5/21 EMA cross to the downside on Wednesday.
GOLD (Long Physical)
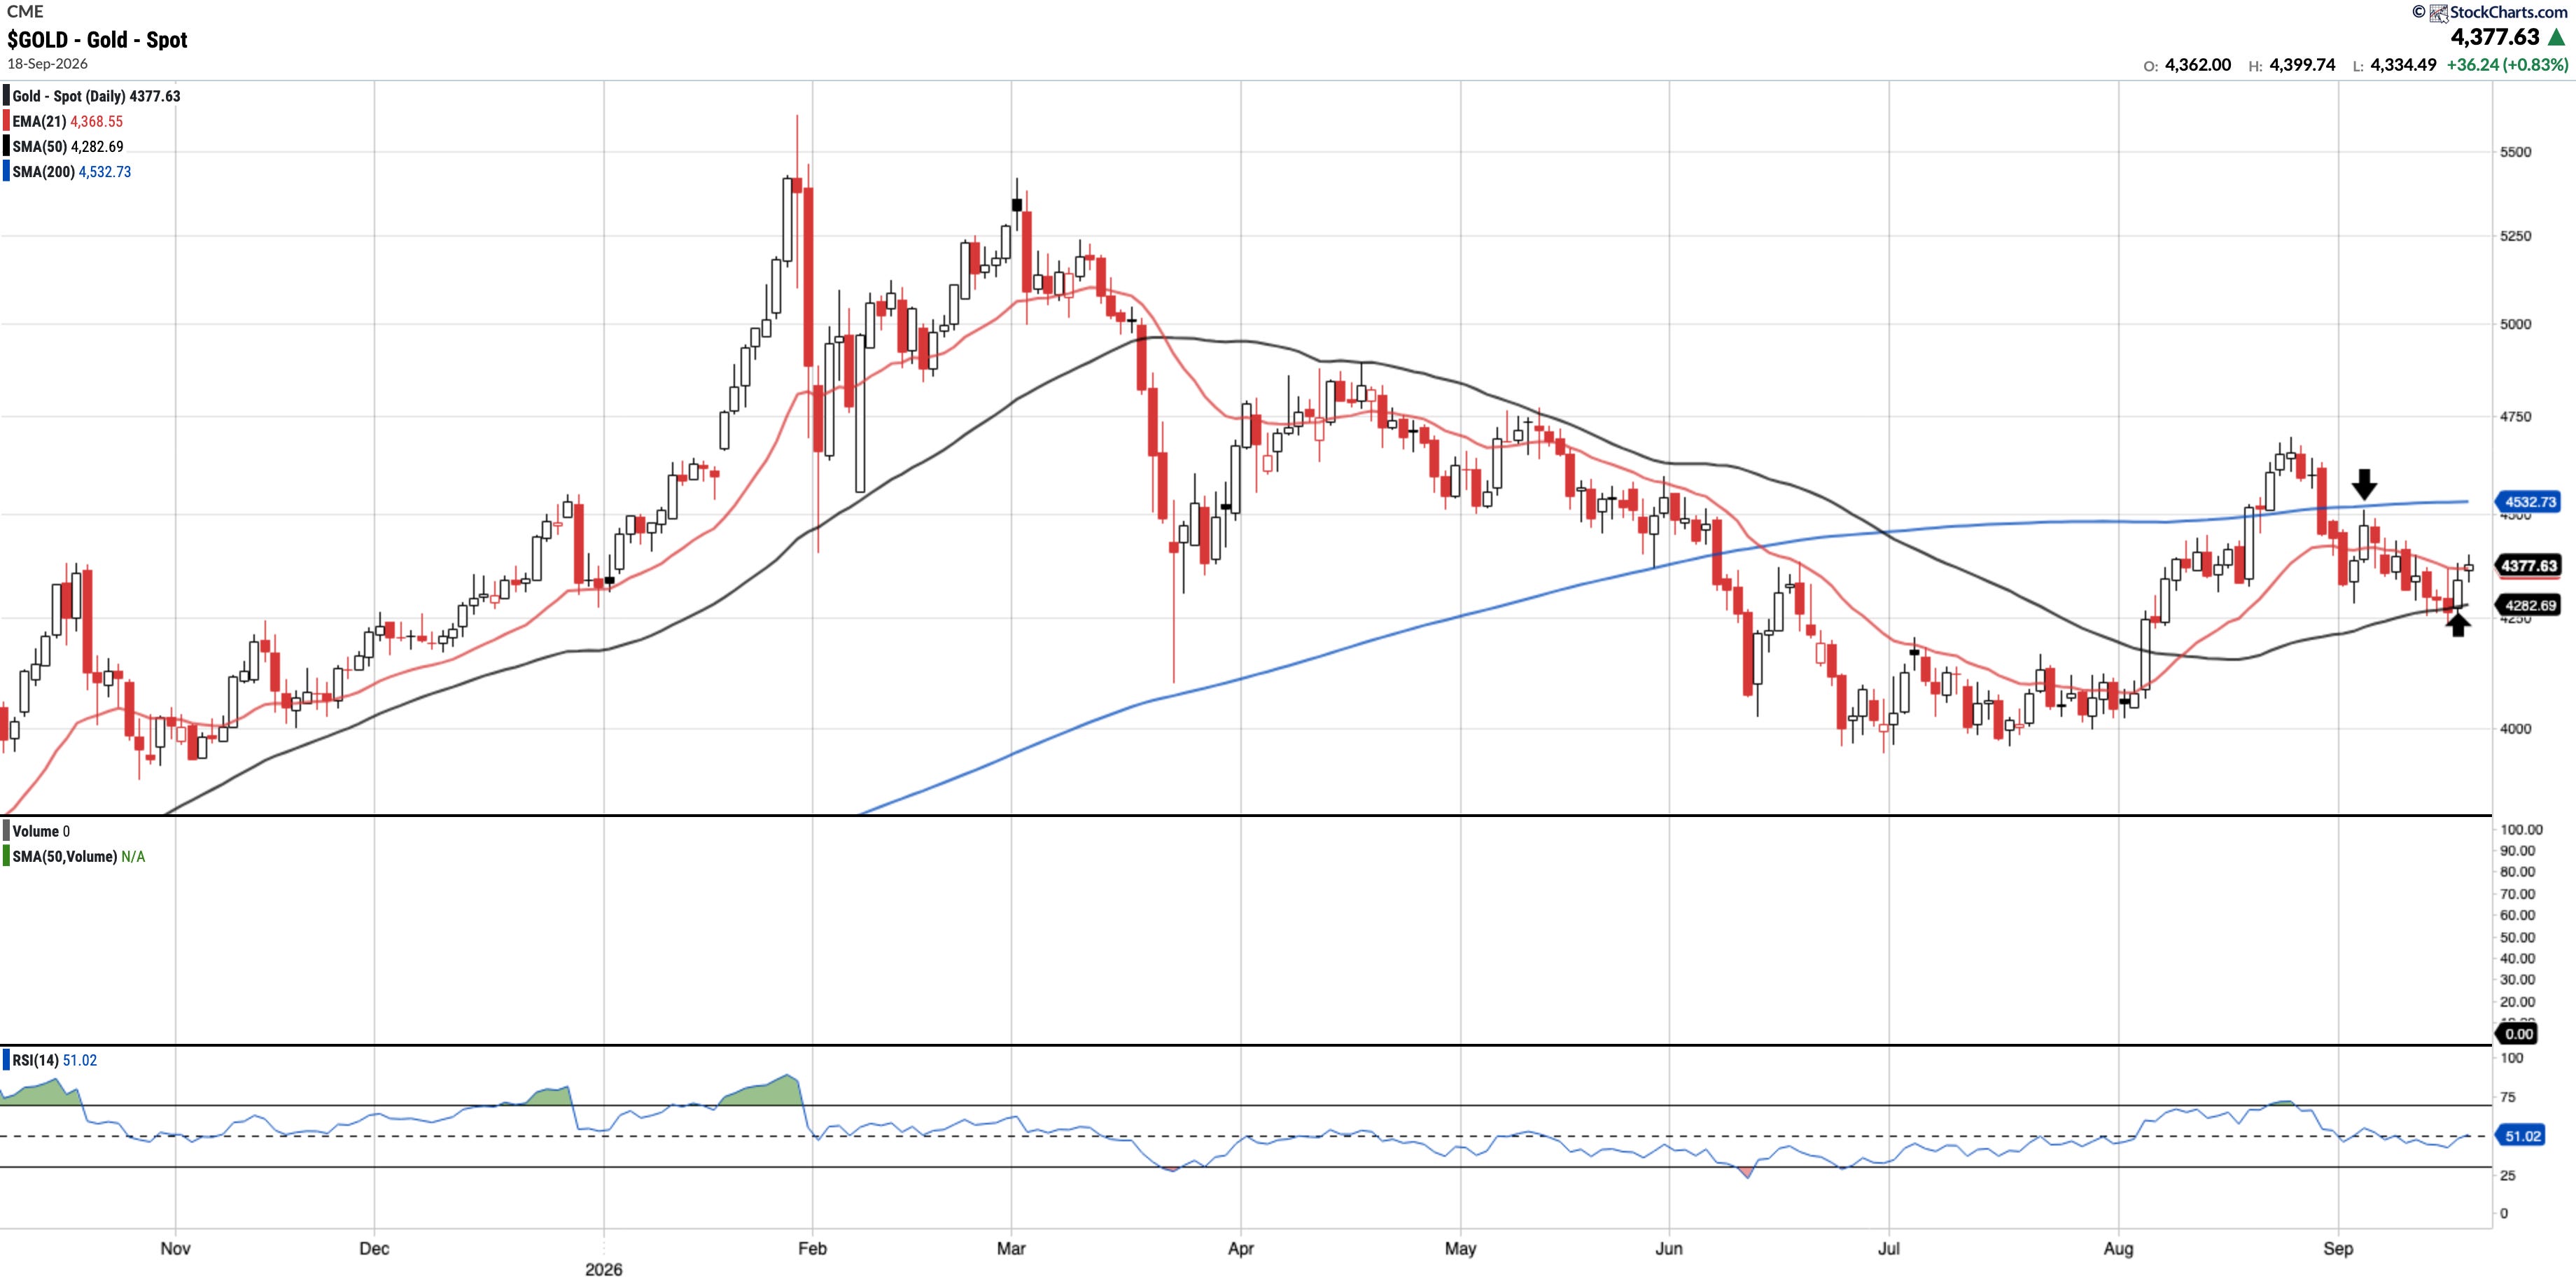
Currently trades at $4,377.63, 2.22% above the 50SMA and 3.42% below the 200SMA.
RSI 51.02
+0.88% YTD
Gold bounced off its 50-day SMA for the first time since breaking above it in August. Overhead resistance remains at the 200-day SMA, which bulls will want to see cleared. Currently, the price continues to consolidate between these two key moving averages.
SOXX
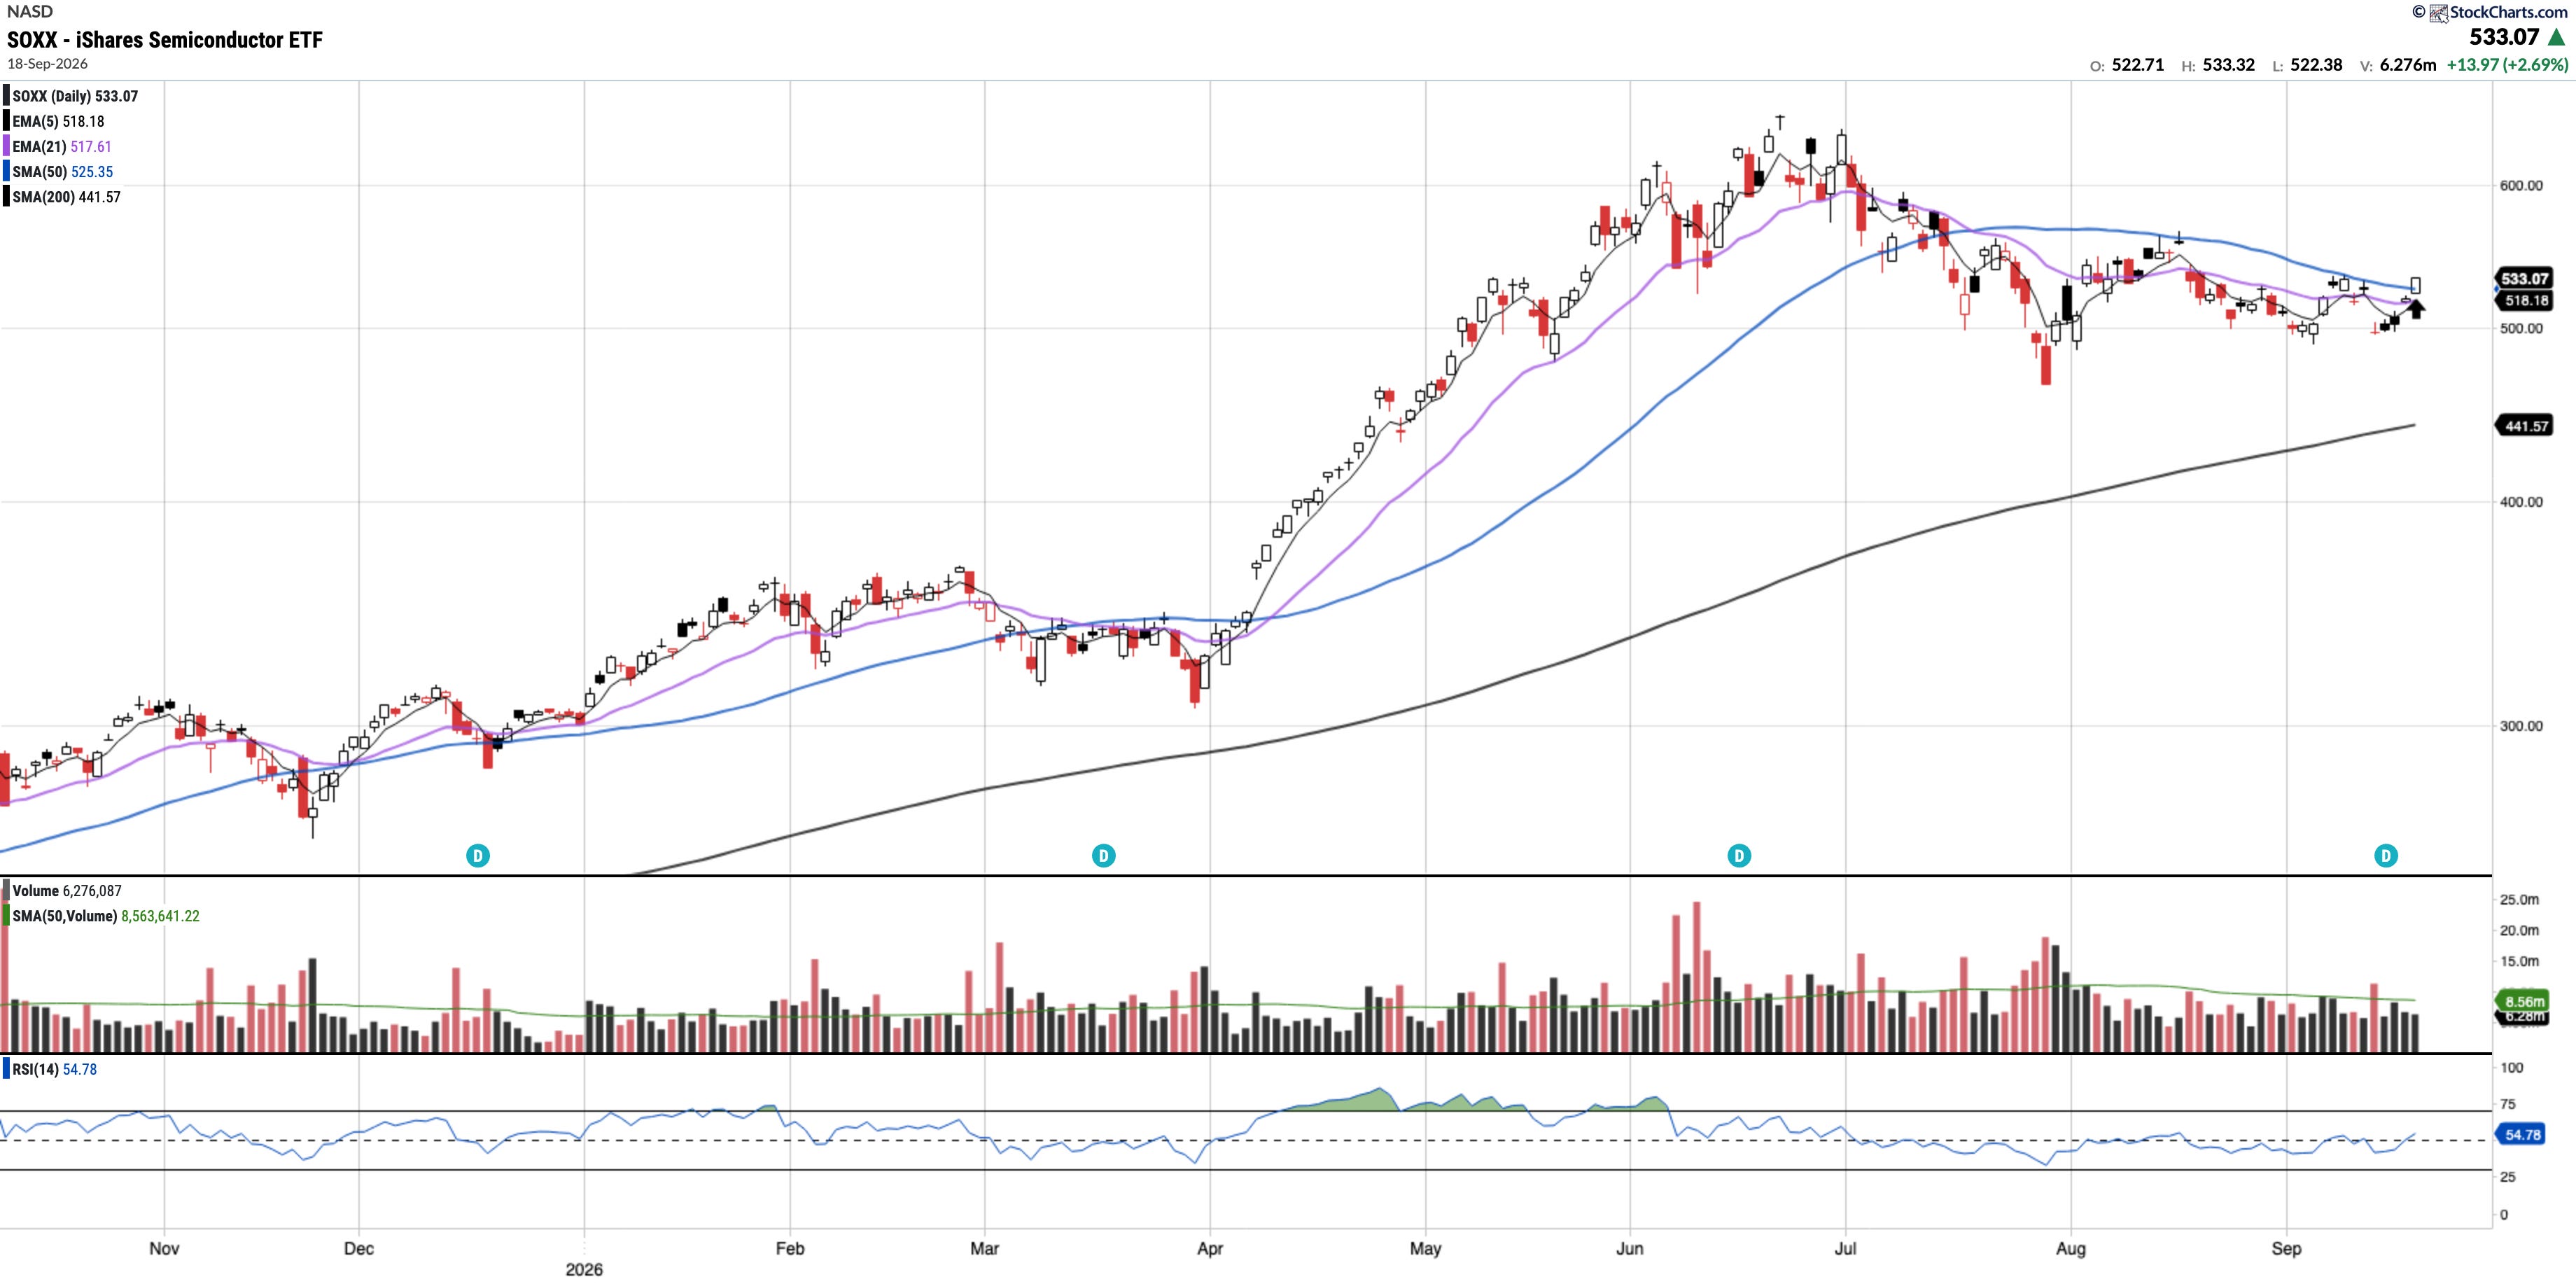
Currently trades at $533.07, 1.47% above the 50SMA and 20.72% above the 200SMA.
RSI 54.78
70.23% YTD
SOXX closed above its 50-day SMA for the first time since July. As I noted two weeks ago, "bulls will want to see both the 21 EMA and the 50 SMA reclaimed to restore longer-term momentum", a milestone achieved this week. Additionally, we saw a 5/21 EMA cross to the upside on Friday, which could mark the start of a new uptrend if the price remains constructive.
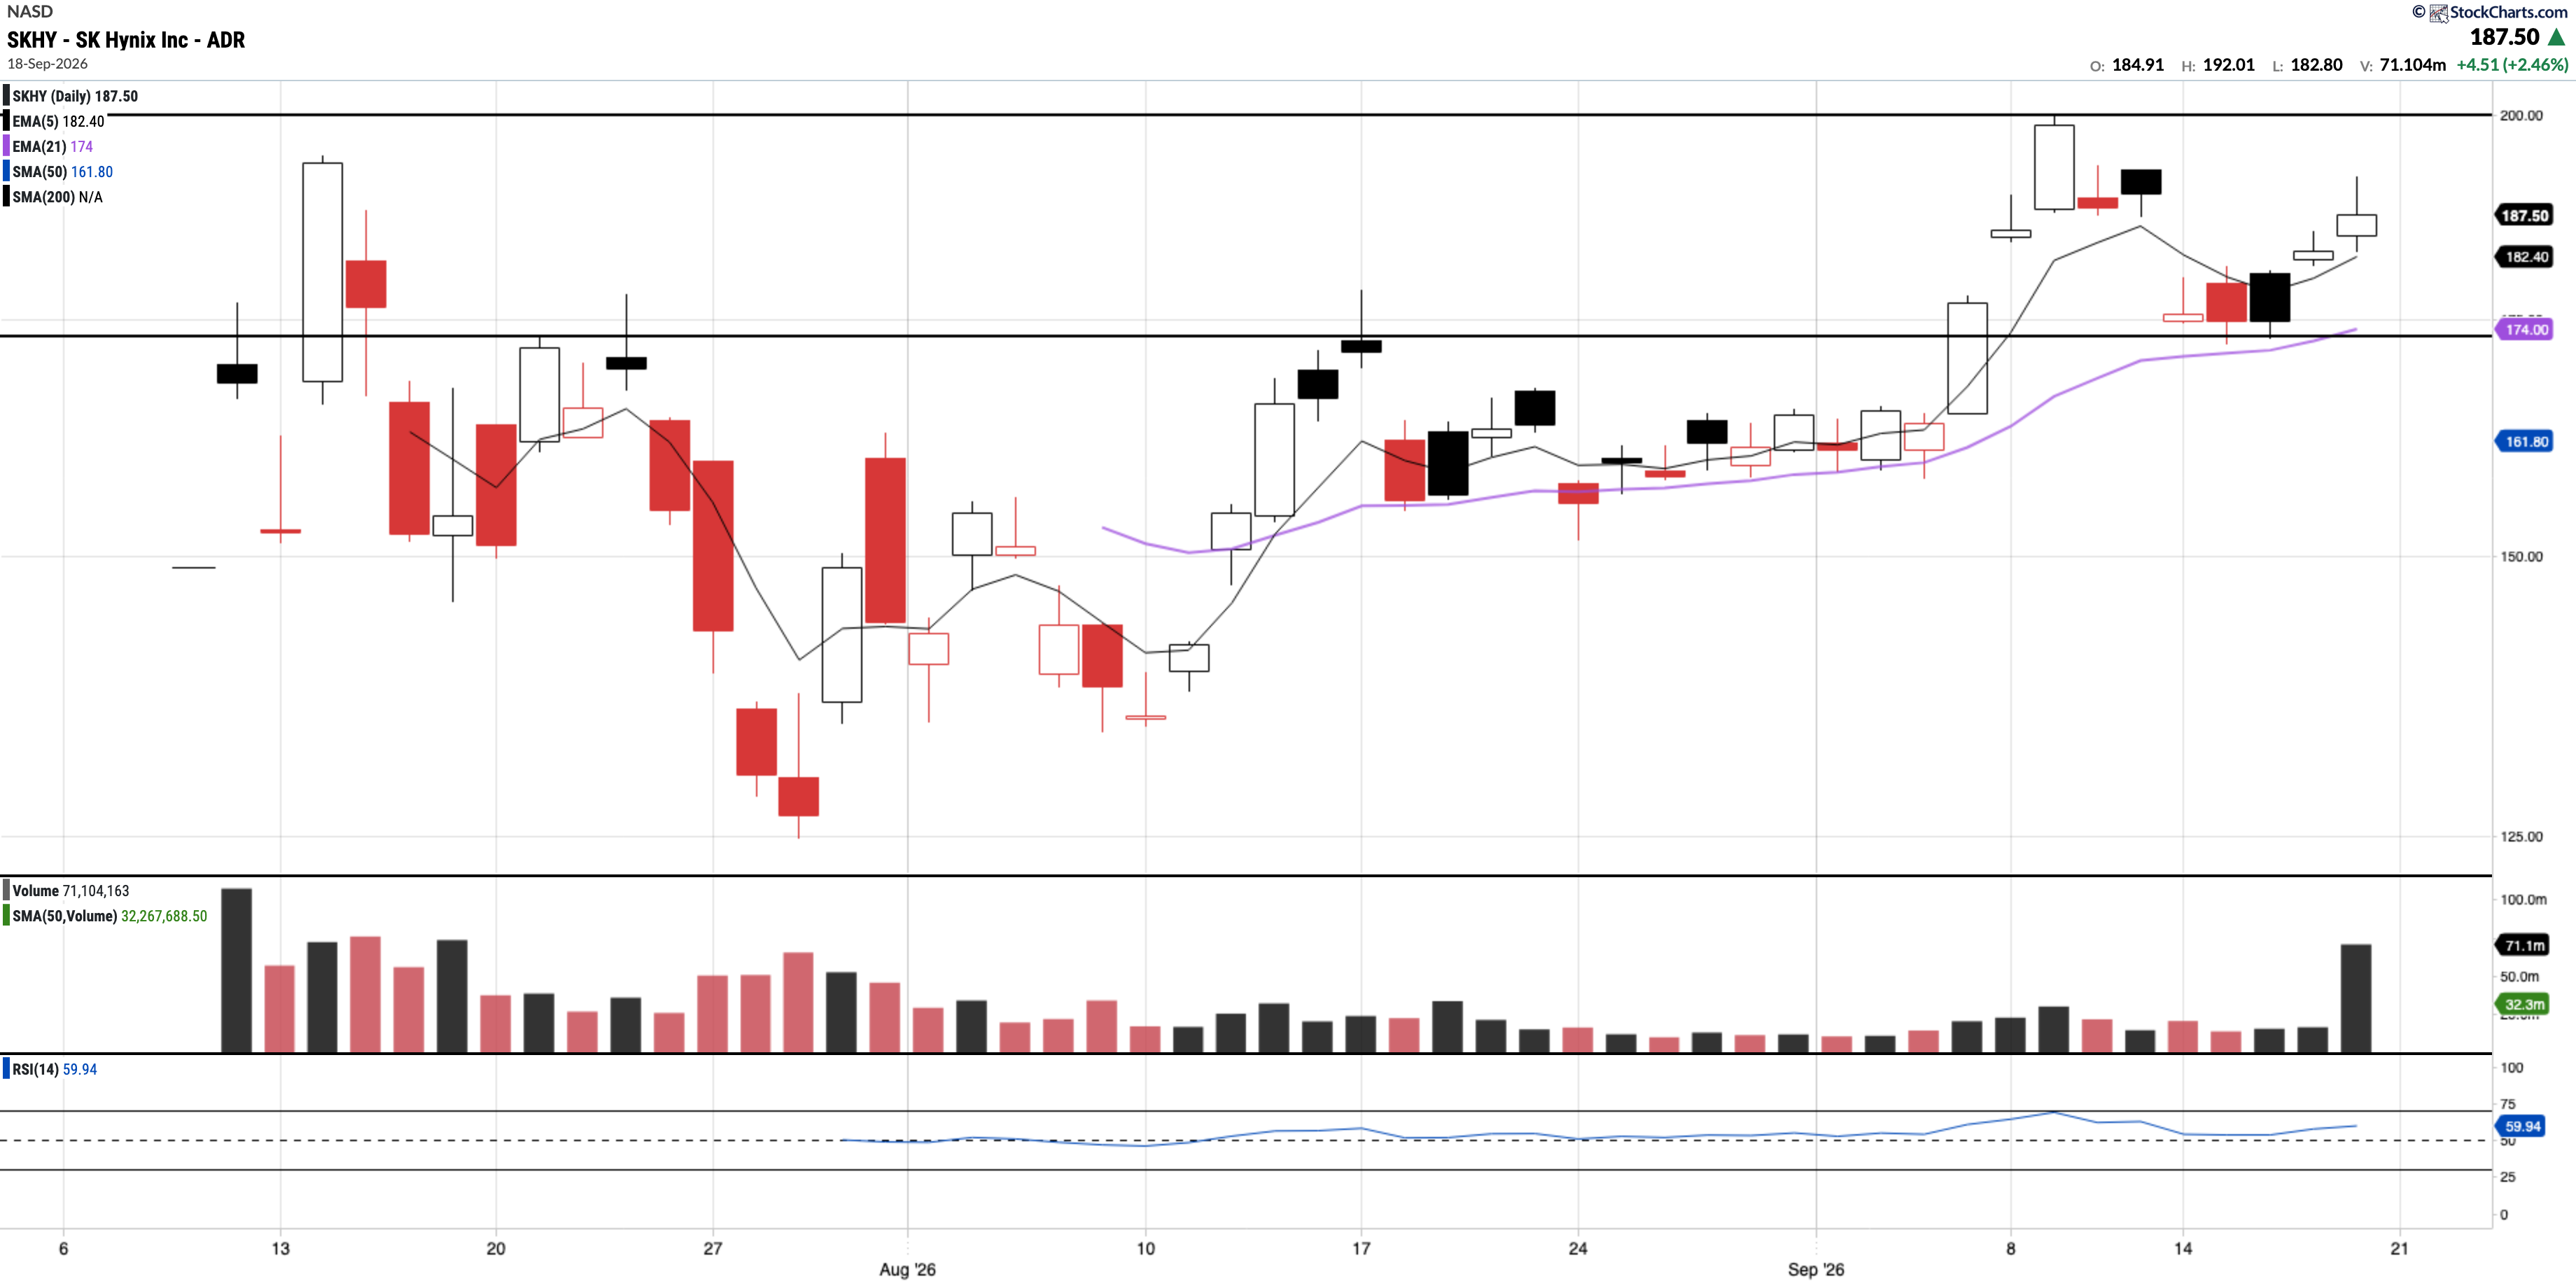
SKHY (Currently Long)
Currently trades at $187.50
RSI 59.94
11.60% YTD
SKHY closed at $187.50, with $198-199 the resistance to watch to the upside. To the downside, we have support at the mid-$170s zone, near the 21-day EMA. The rally on Friday was potentially driven by rebalancing (based on the heavy volume), so some consolidation (sideways price action) next week within that range wouldn't be surprising.
GOOGL (Currently Long)
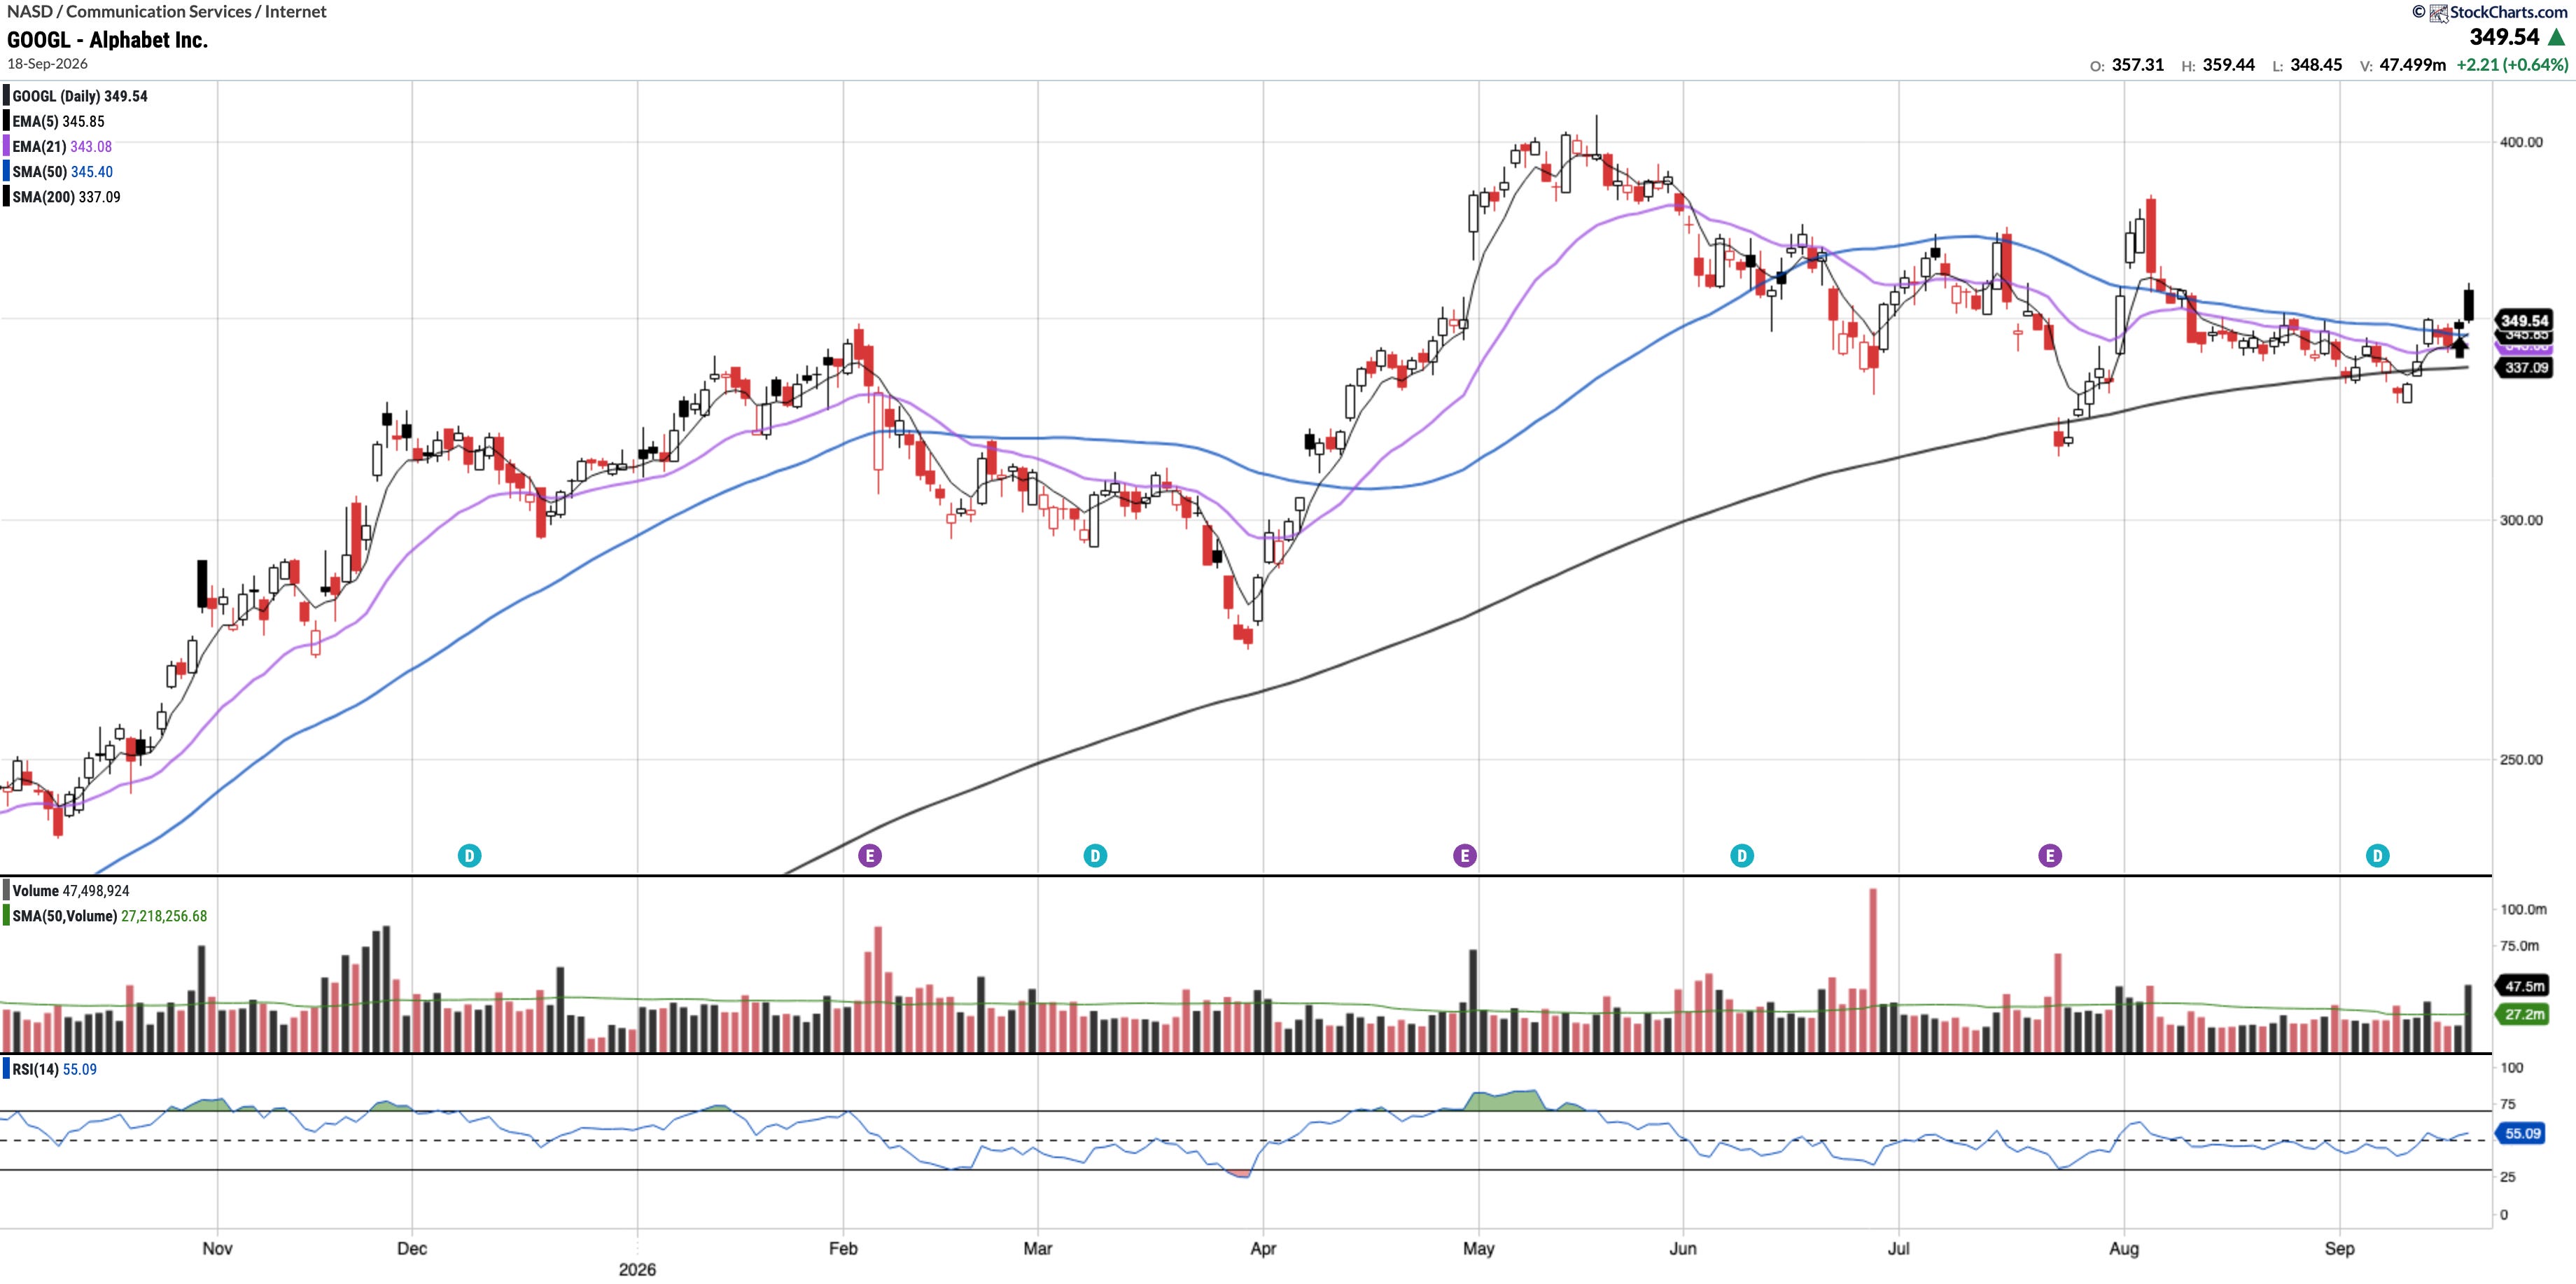
Currently trades at $349.54, 1.20% above the 50SMA and 3.69% above the 200SMA.
RSI 55.09
11.13% YTD
In last week’s writeup I mentioned:
Over the last 15 years, buying GOOGL on a reclaim of the 200-day simple moving average has produced an average 12-month forward return of roughly 32–35% (Source: Grok). It’s worth noting that Google closed the week back above the 200 SMA, and bulls will want to see that hold. The 50 SMA, currently at 346, is the next level to reclaim.
GOOGL built on last week’s reclaim of the 200-day, closing this week above all of its key moving averages, including the $345.40 50 SMA I flagged as the next level to watch. This is the confirmation bulls want to see to keep last week’s base case intact.
META (Currently Long)
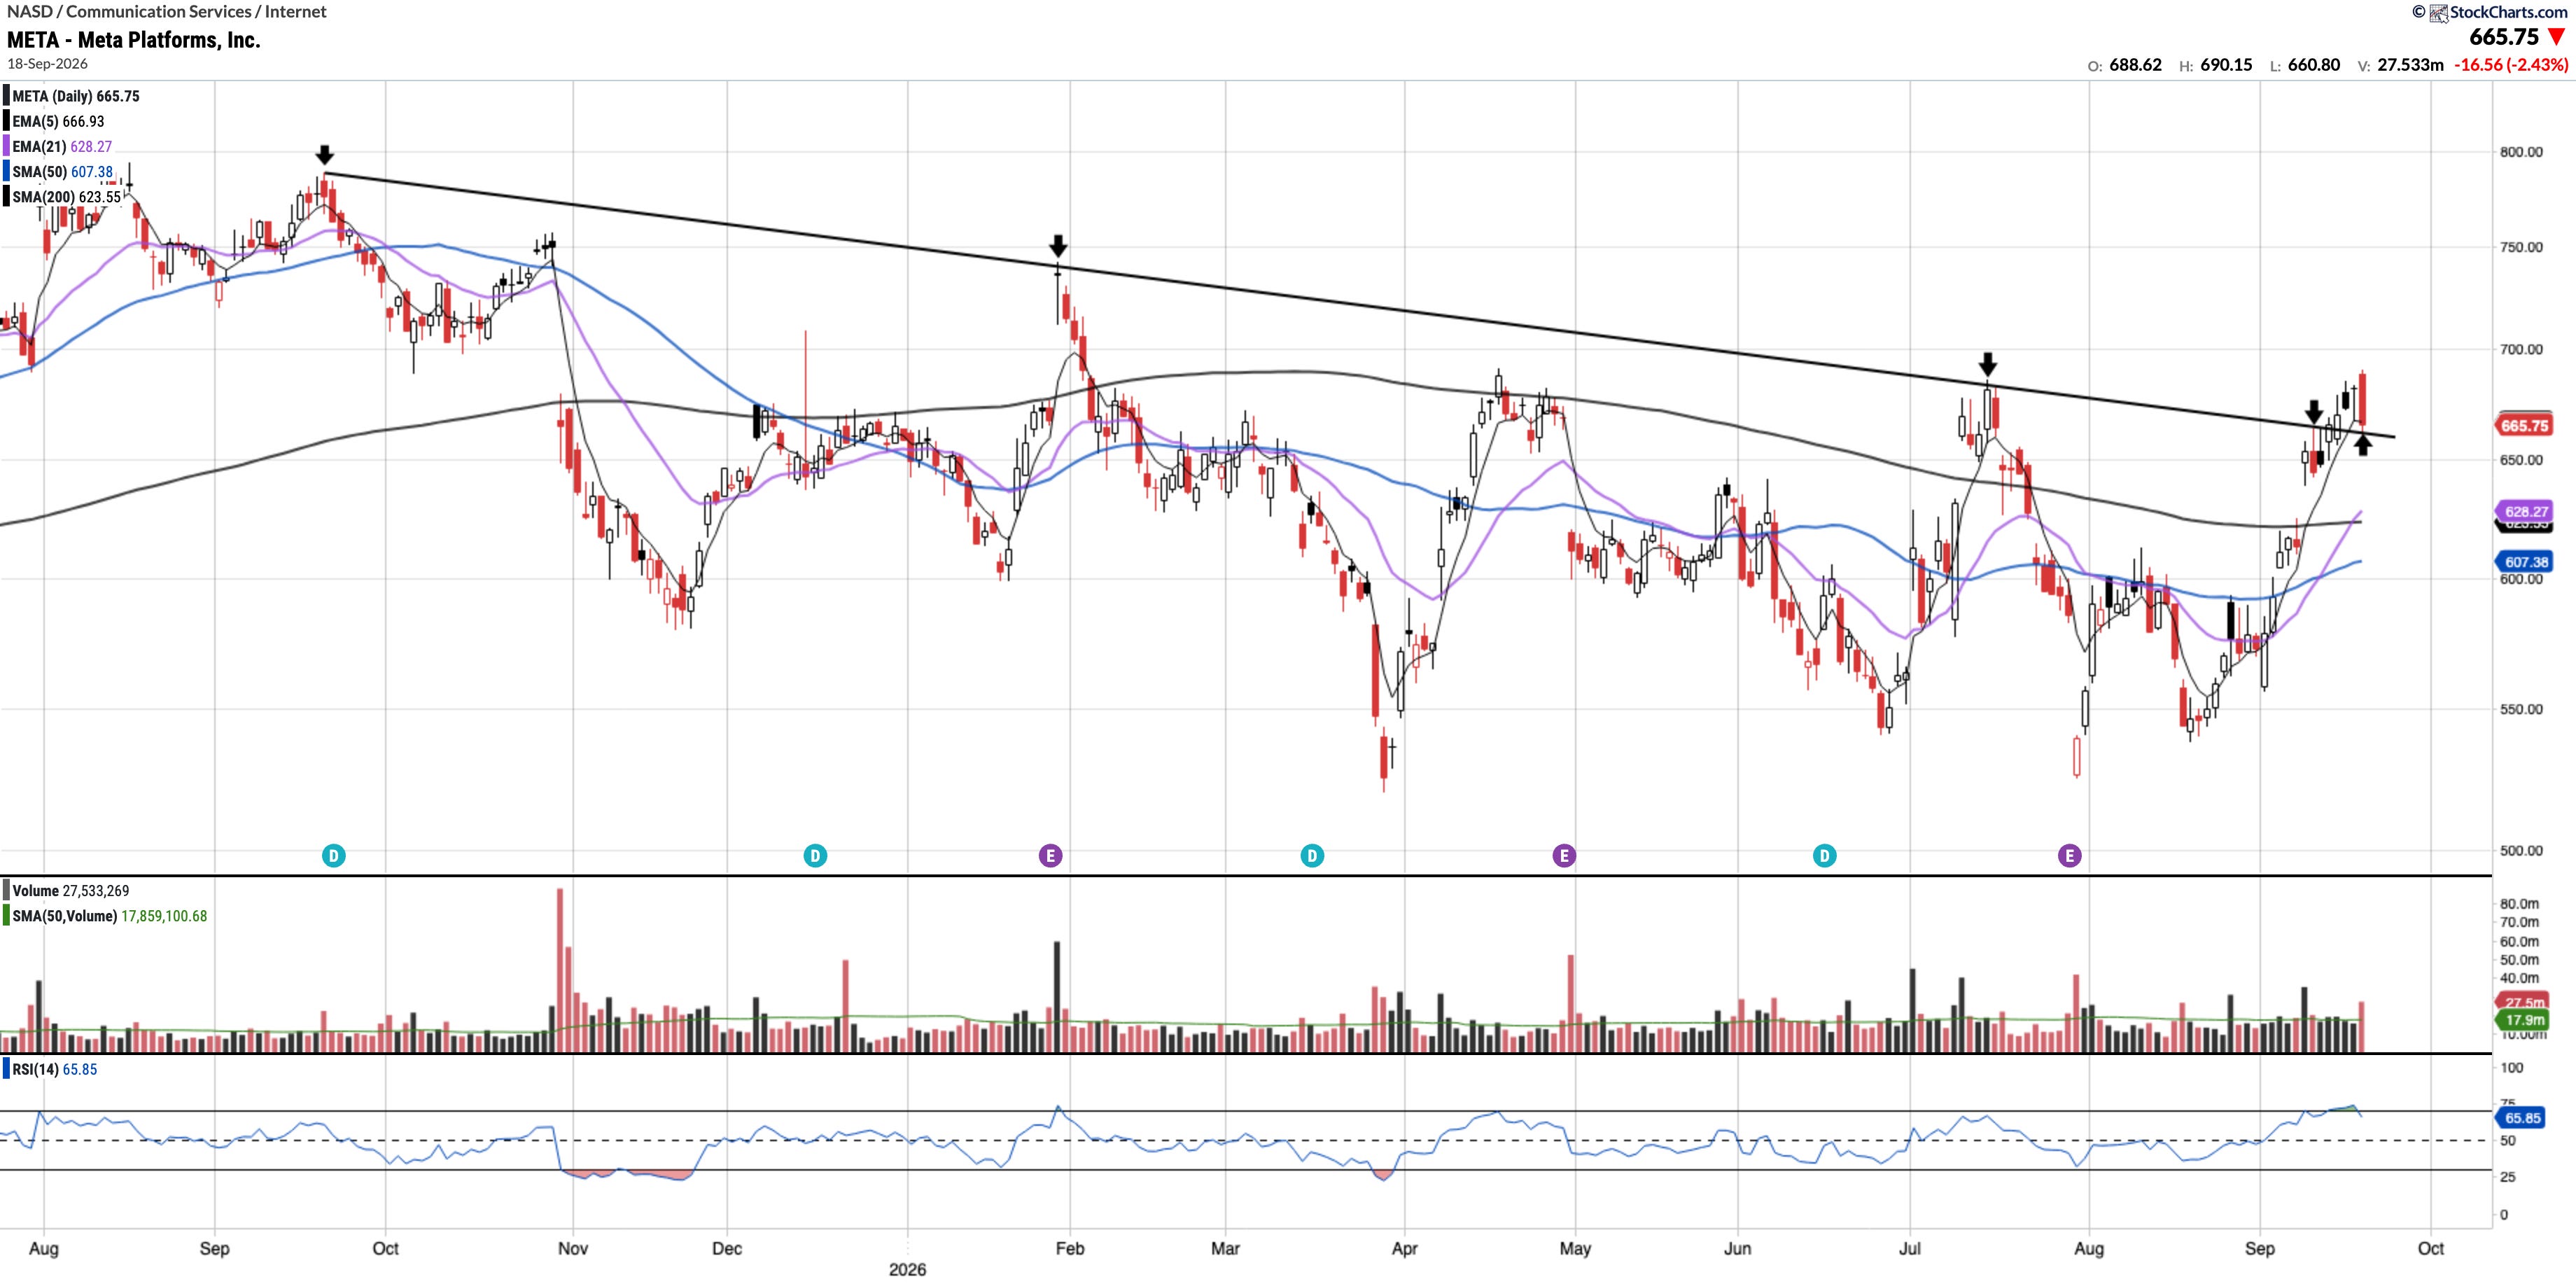
Currently trades at $665.75, 9.61% above the 50SMA and 6.77% above the 200SMA.
RSI 65.85
2.54% YTD
In last week’s writeup I mentioned:
META reclaimed the 200 SMA this week on the back of releasing Muse, its new AI agent. The stock rallied into the mid-$660s before somewhat predictably finding resistance at the diagonal trendline that has served as resistance for many months now (see arrow). Bulls will want to see a breakout of that trendline and a close above it soon.
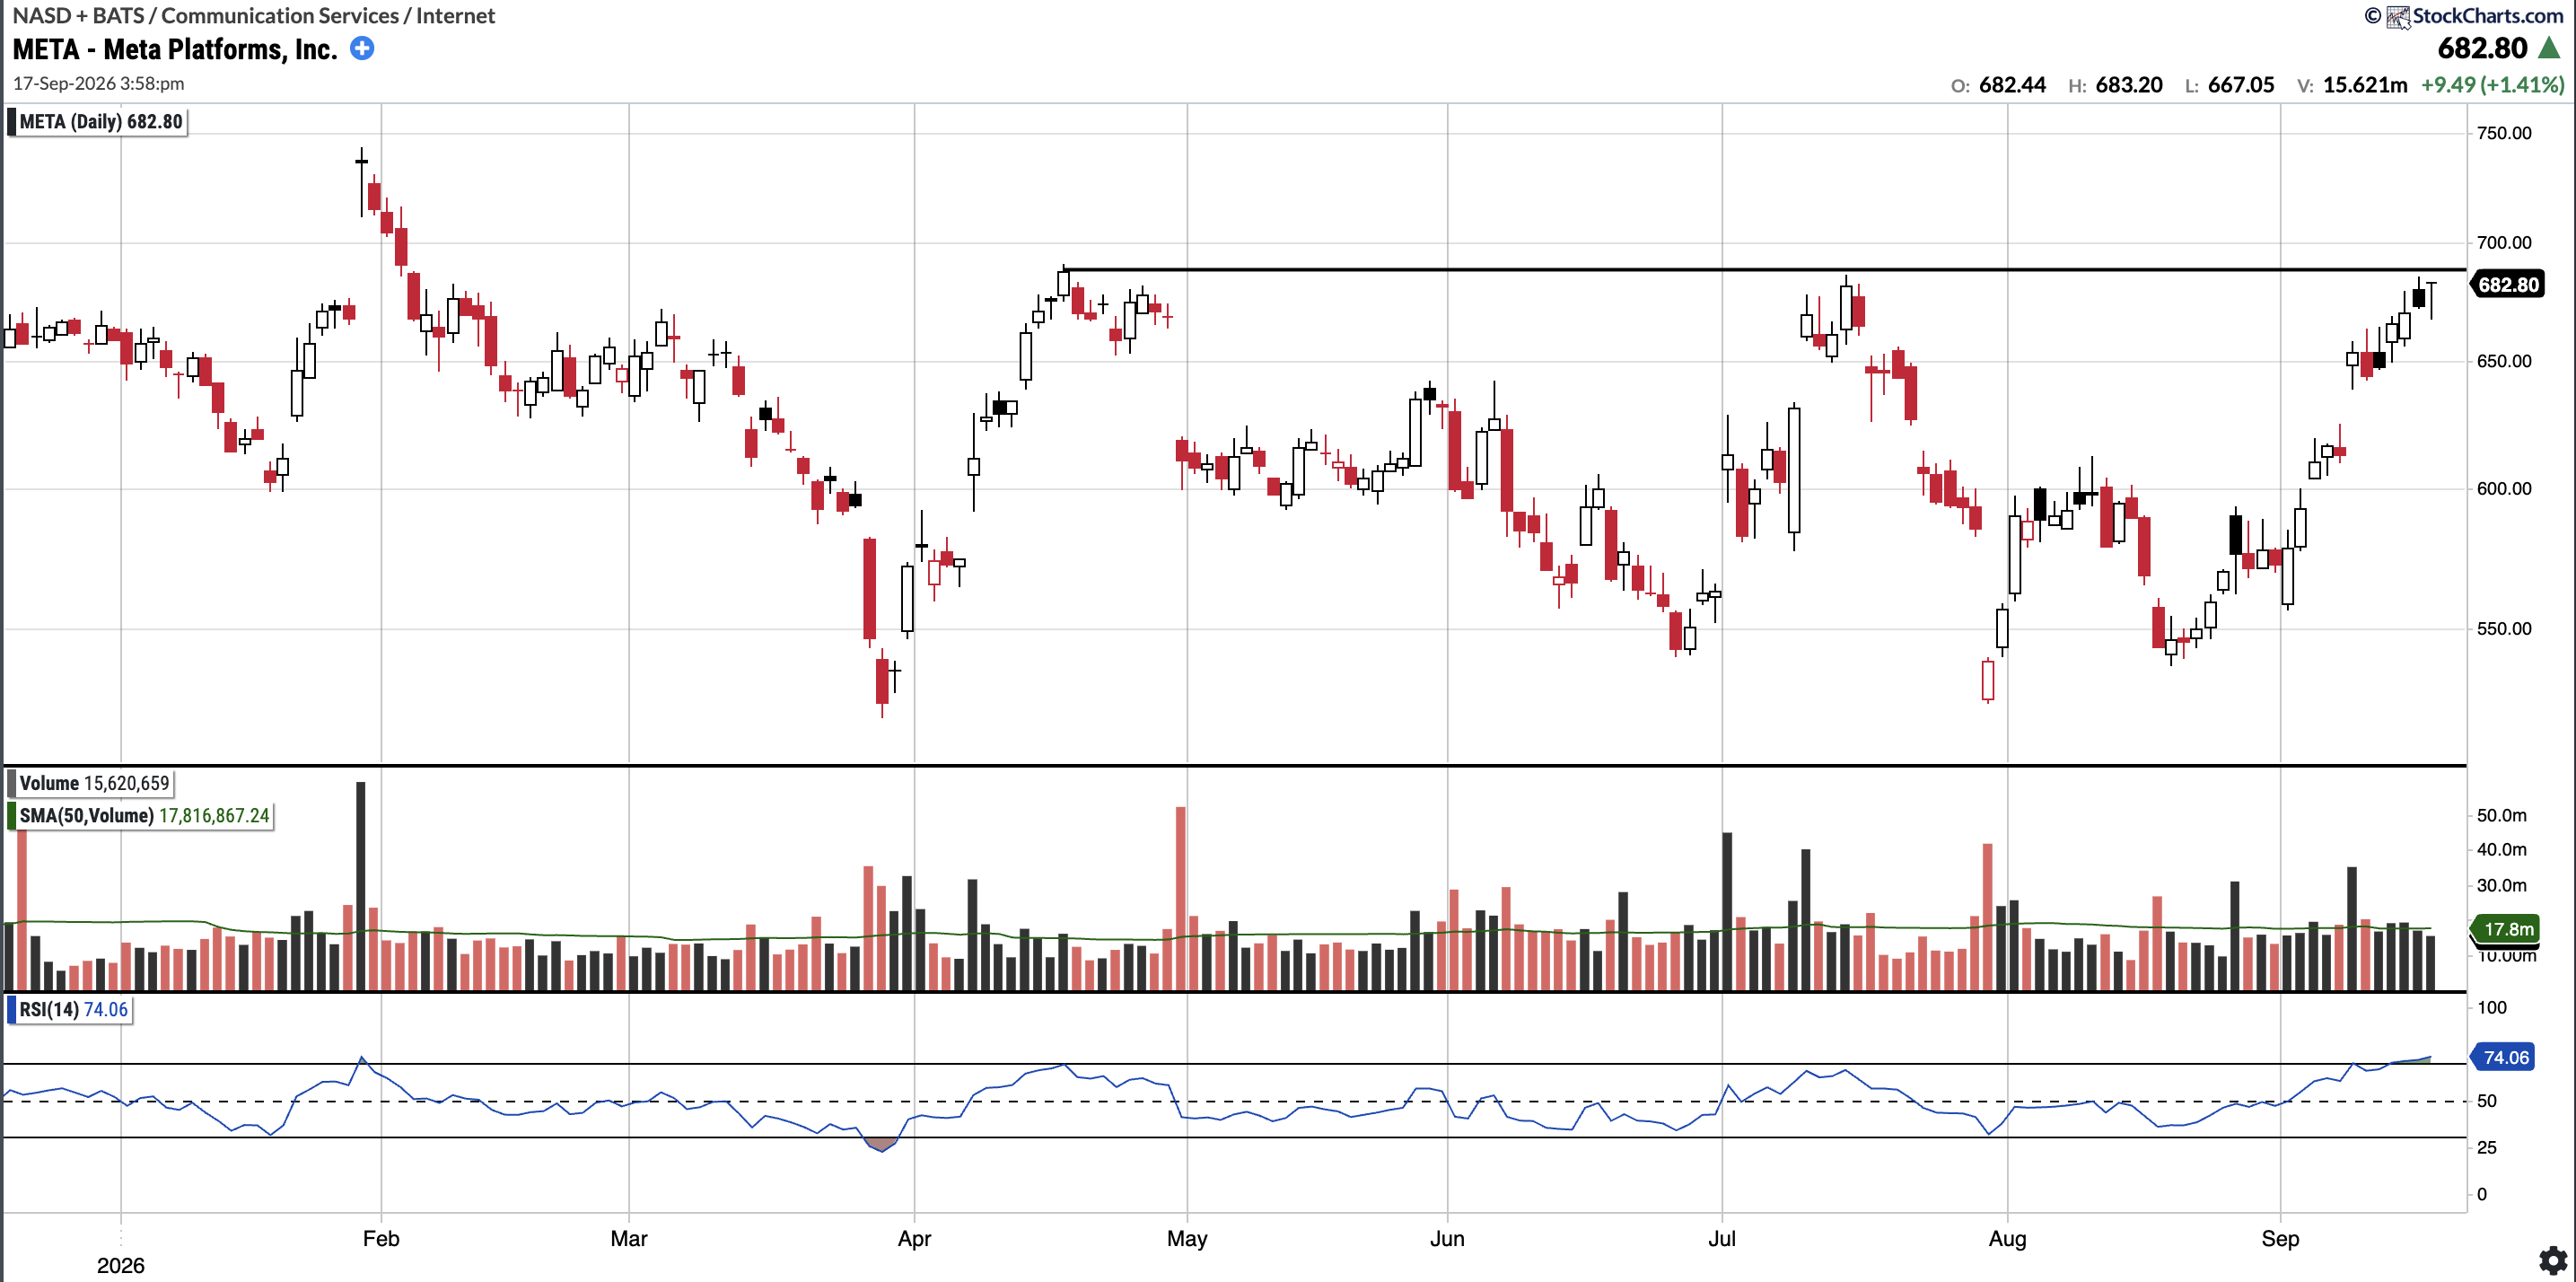
META closed the week green after rallying past the trendline flagged last week, but it found resistance right at the $689–$690 horizontal level (see second chart below). Muse remains the story behind the move as it reached #1 in the App Store, but bulls will want to see the price actually clear and hold above that $689–$690 zone and the long-term trendline.
XBI
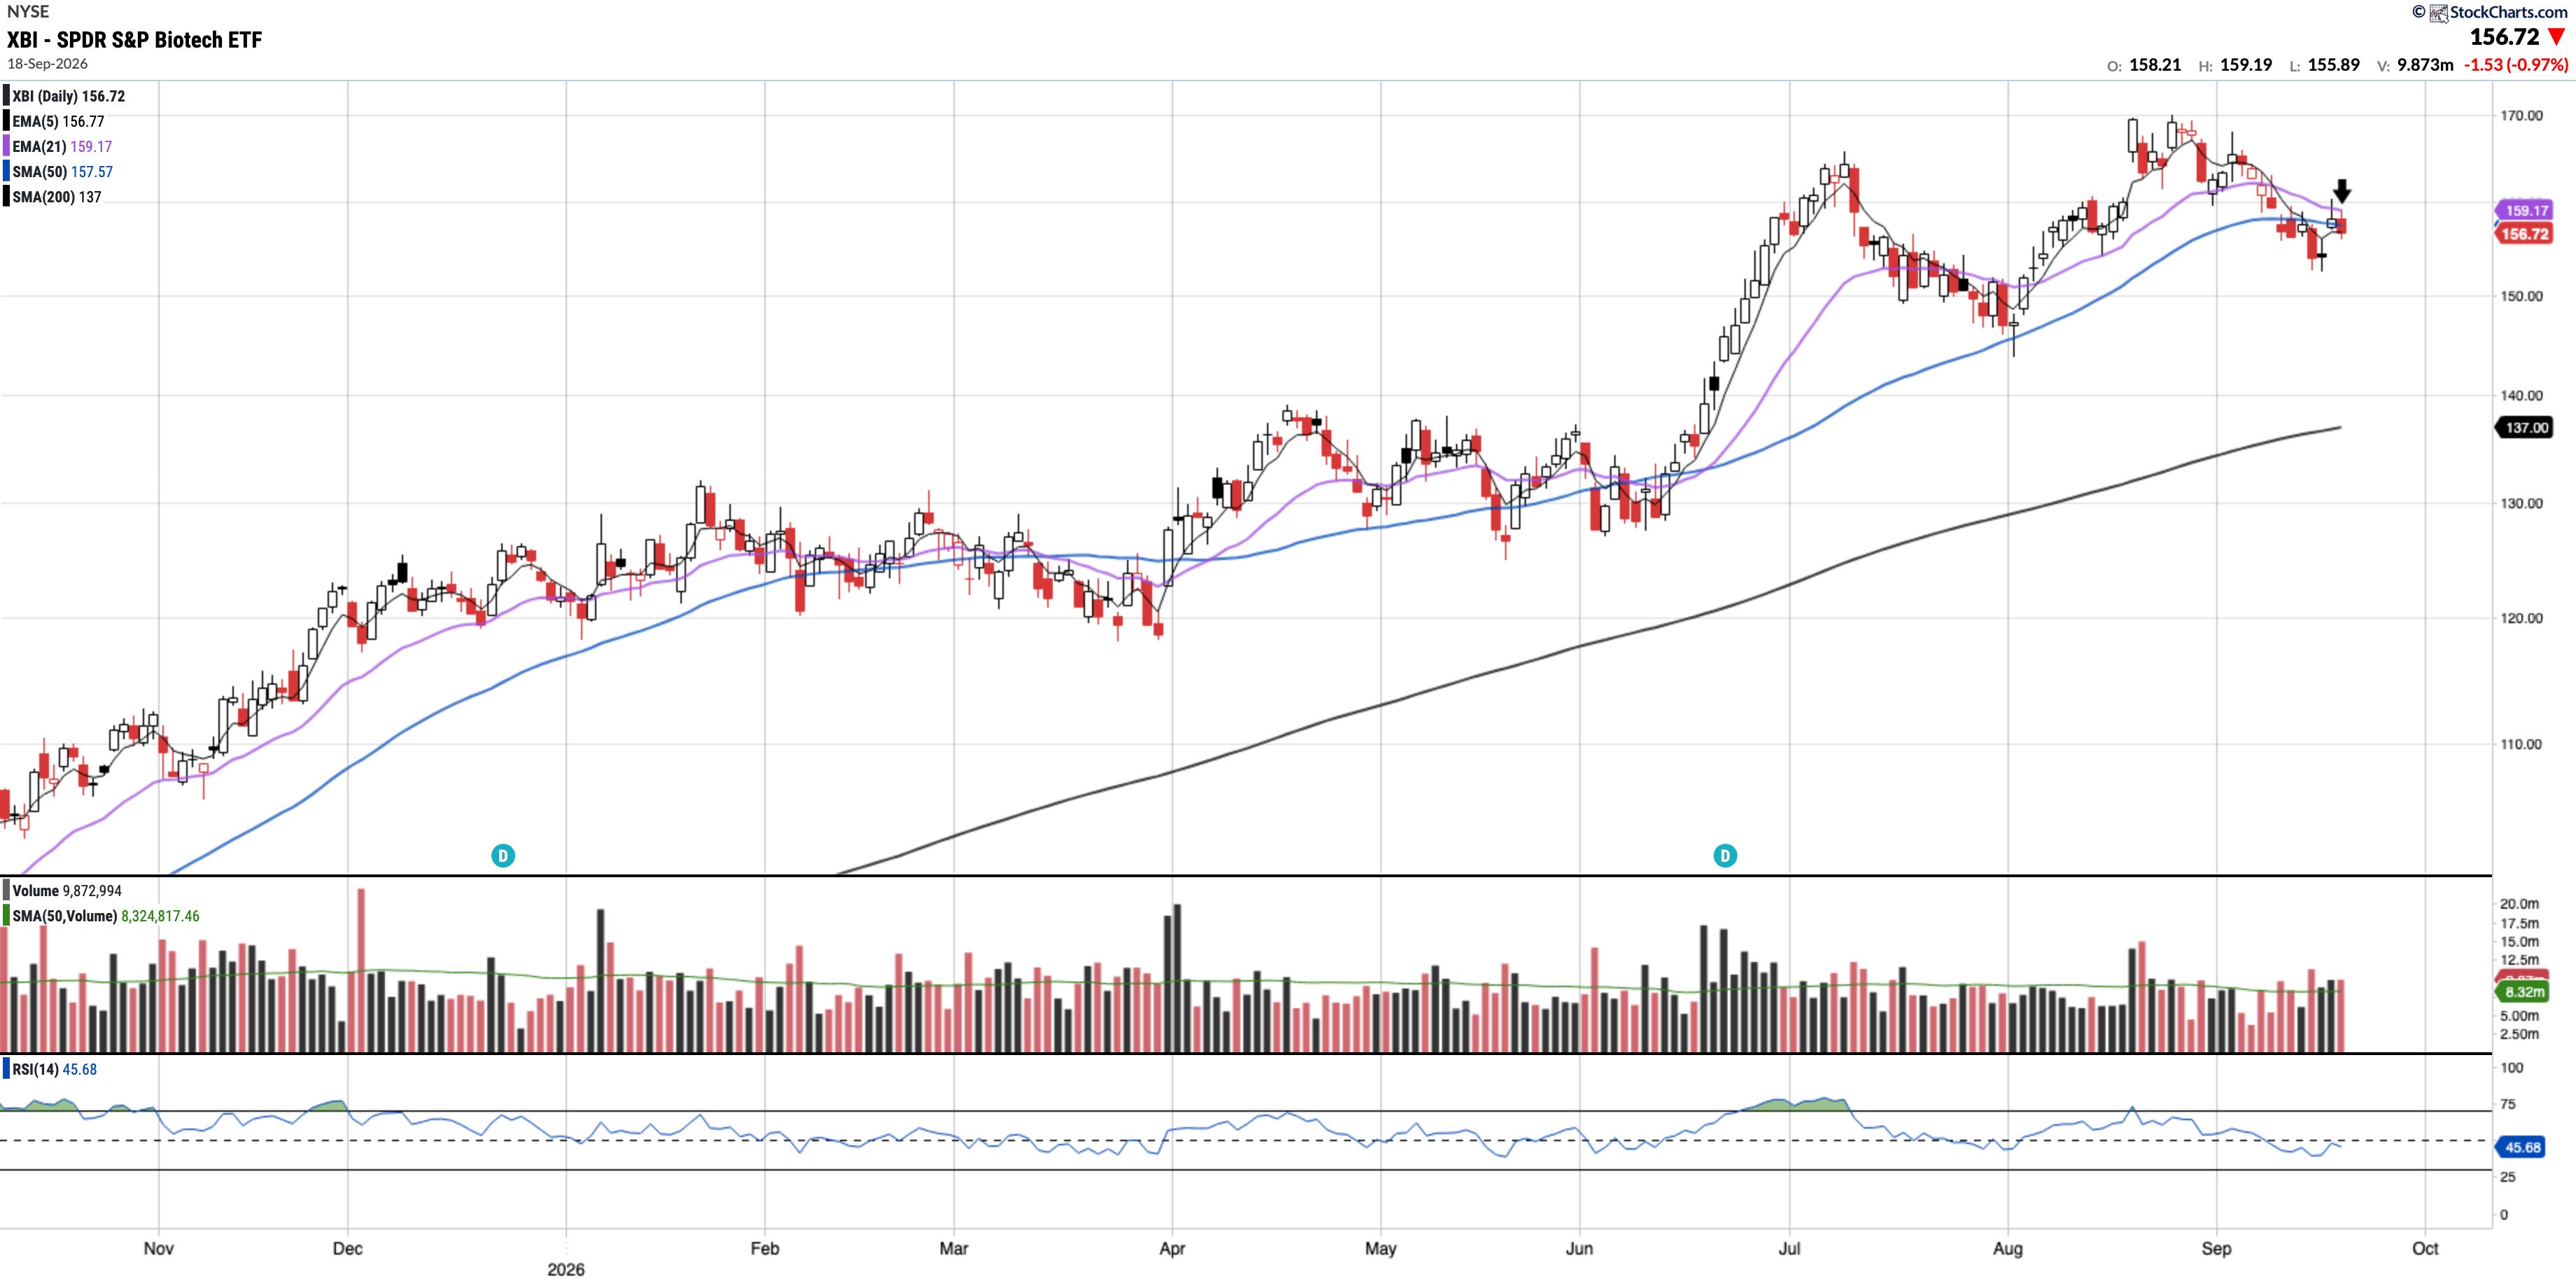
Currently trades at $156.72, 0.54% below the 50SMA and 14.40% above the 200SMA.
RSI 45.68
29.09% YTD
Price remains below the 50SMA despite an attempt to break above it. It’s up 29% YTD and has been trending higher since June. While bulls will want to see a break above the 50SMA, the current price action could simply be a healthy pullback. Seeing how price trades around the 50SMA this week will be crucial.
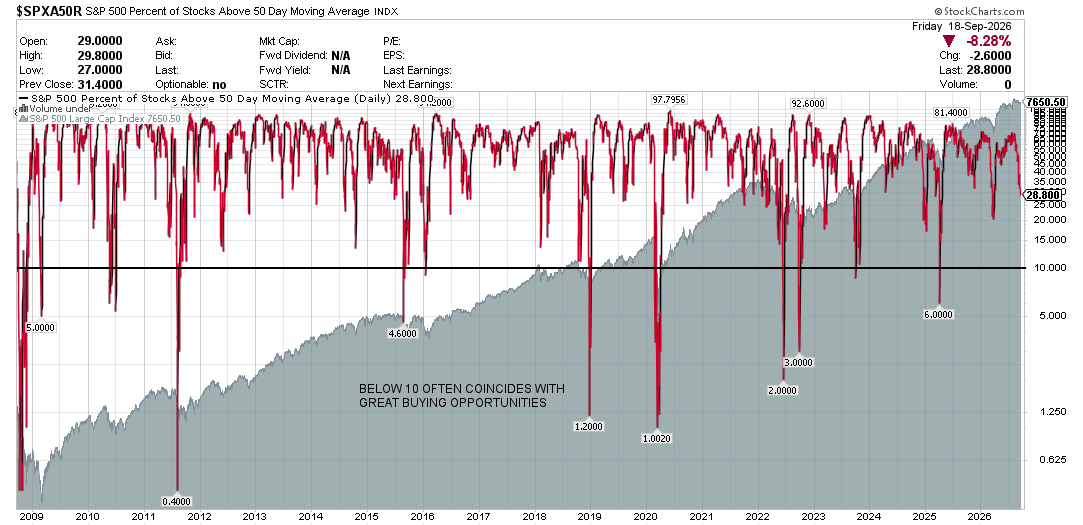
S&P 500 Percentage of Stocks Above the 50 Day Moving Average: Currently 28.80%
Breadth decreased significantly this week also, with the percentage of stocks above the 50-day moving average now at 28.80% compared to 39.20% last week. 28% is poor breadth and shows a narrow market.
Notable portfolio changes in previous week (all updated live in subscriber channels):
