

Hope you all are having a good weekend. Below, we will be previewing the upcoming week’s events and providing a portfolio update as usual.
Format for what is covered in this weekly preview:
A Look at the Indices
Key Upcoming Economic Events
Upcoming Earnings
Charts
Current Portfolio Holdings:
Sizing | Cost Basis | Timeframe | Planned Moves
Closing Thoughts (Scroll to here for my Market Commentary)
I recommend checking out the most recent in depth Monthly Portfolio and Performance Update below:

For all readers a reminder that a premium subscription includes:
Live Portfolio updates (All Buys and Sells) in Subscriber only Channels
Favourite set-up Ideas, Market Memos plus Full archive
Monthly in depth portfolio & performance updates
Annual Tier: Discord access for live trading account updates and AMAs.
Indices
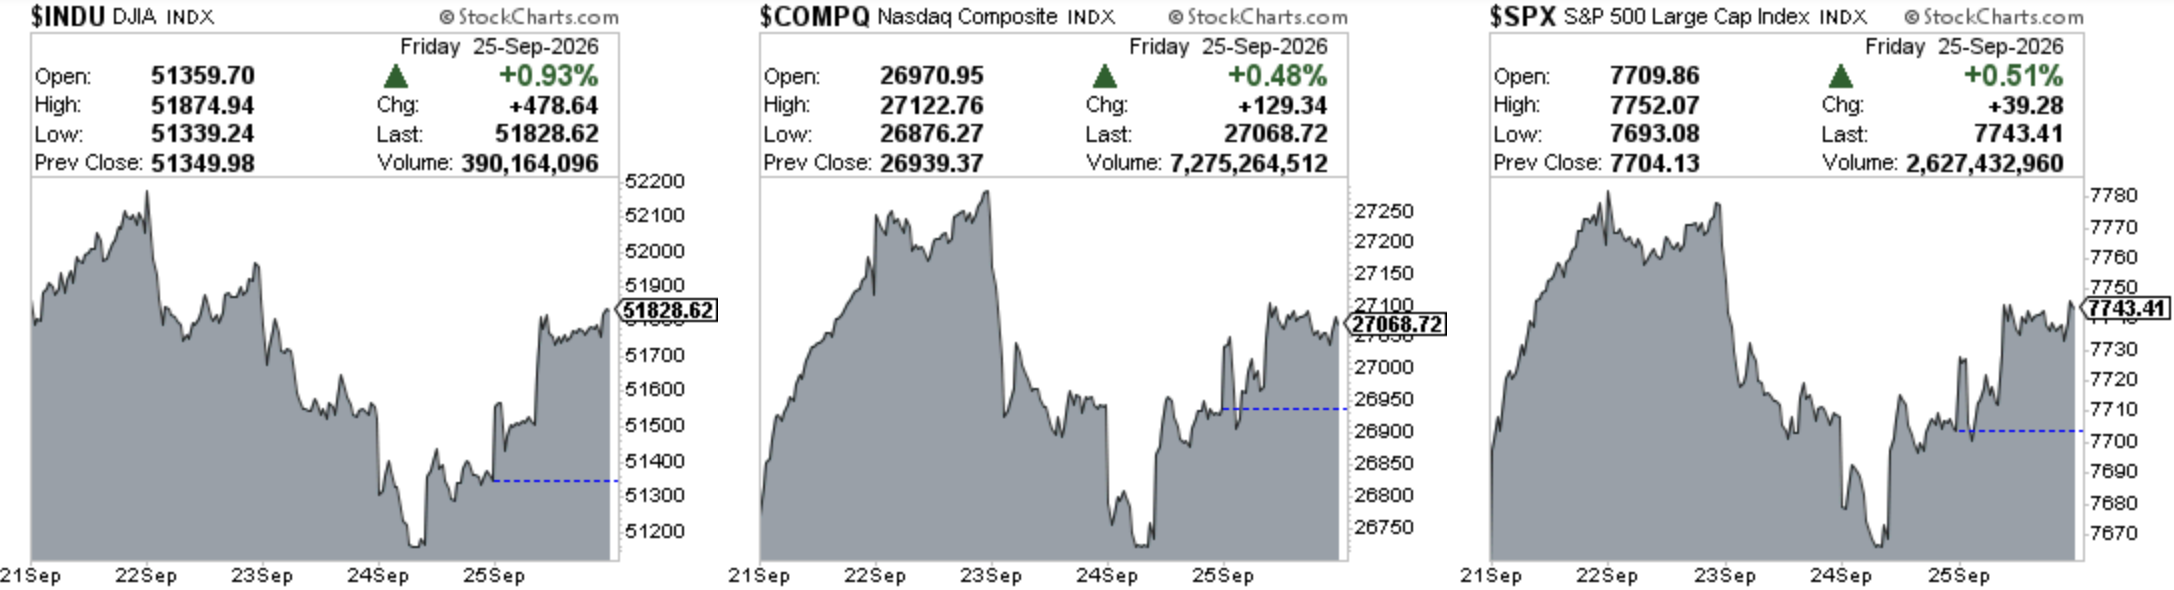
Dow Jones Industrial Average advanced +0.28% in the last week
S&P 500 advanced +1.21% in the last week
Nasdaq Composite advanced +2.06% in the last week
IWM declined -0.75% in the last week
Key upcoming economic events
Monday, September 28
Dallas Fed Manufacturing Survey (September)
Tuesday, September 29
Conference Board Consumer Confidence (September)
JOLTS Job Openings (August)
API Weekly Crude Oil Inventory Report
Wednesday, September 30
ADP National Employment Report (September)
Chicago PMI (September)
Gross Domestic Product, Final Estimate (Q2 2026)
Personal Consumption Expenditures (PCE) Price Index (Aug)
EIA Weekly Petroleum Status Report
Thursday, October 1
ISM Manufacturing PMI (September)
Initial Weekly Jobless Claims
Construction Spending (August)
EIA Weekly Natural Gas Storage Report
Friday, October 2
Employment Situation (September Nonfarm Payrolls, Unemployment Rate, Average Hourly Earnings)
Upcoming Earnings
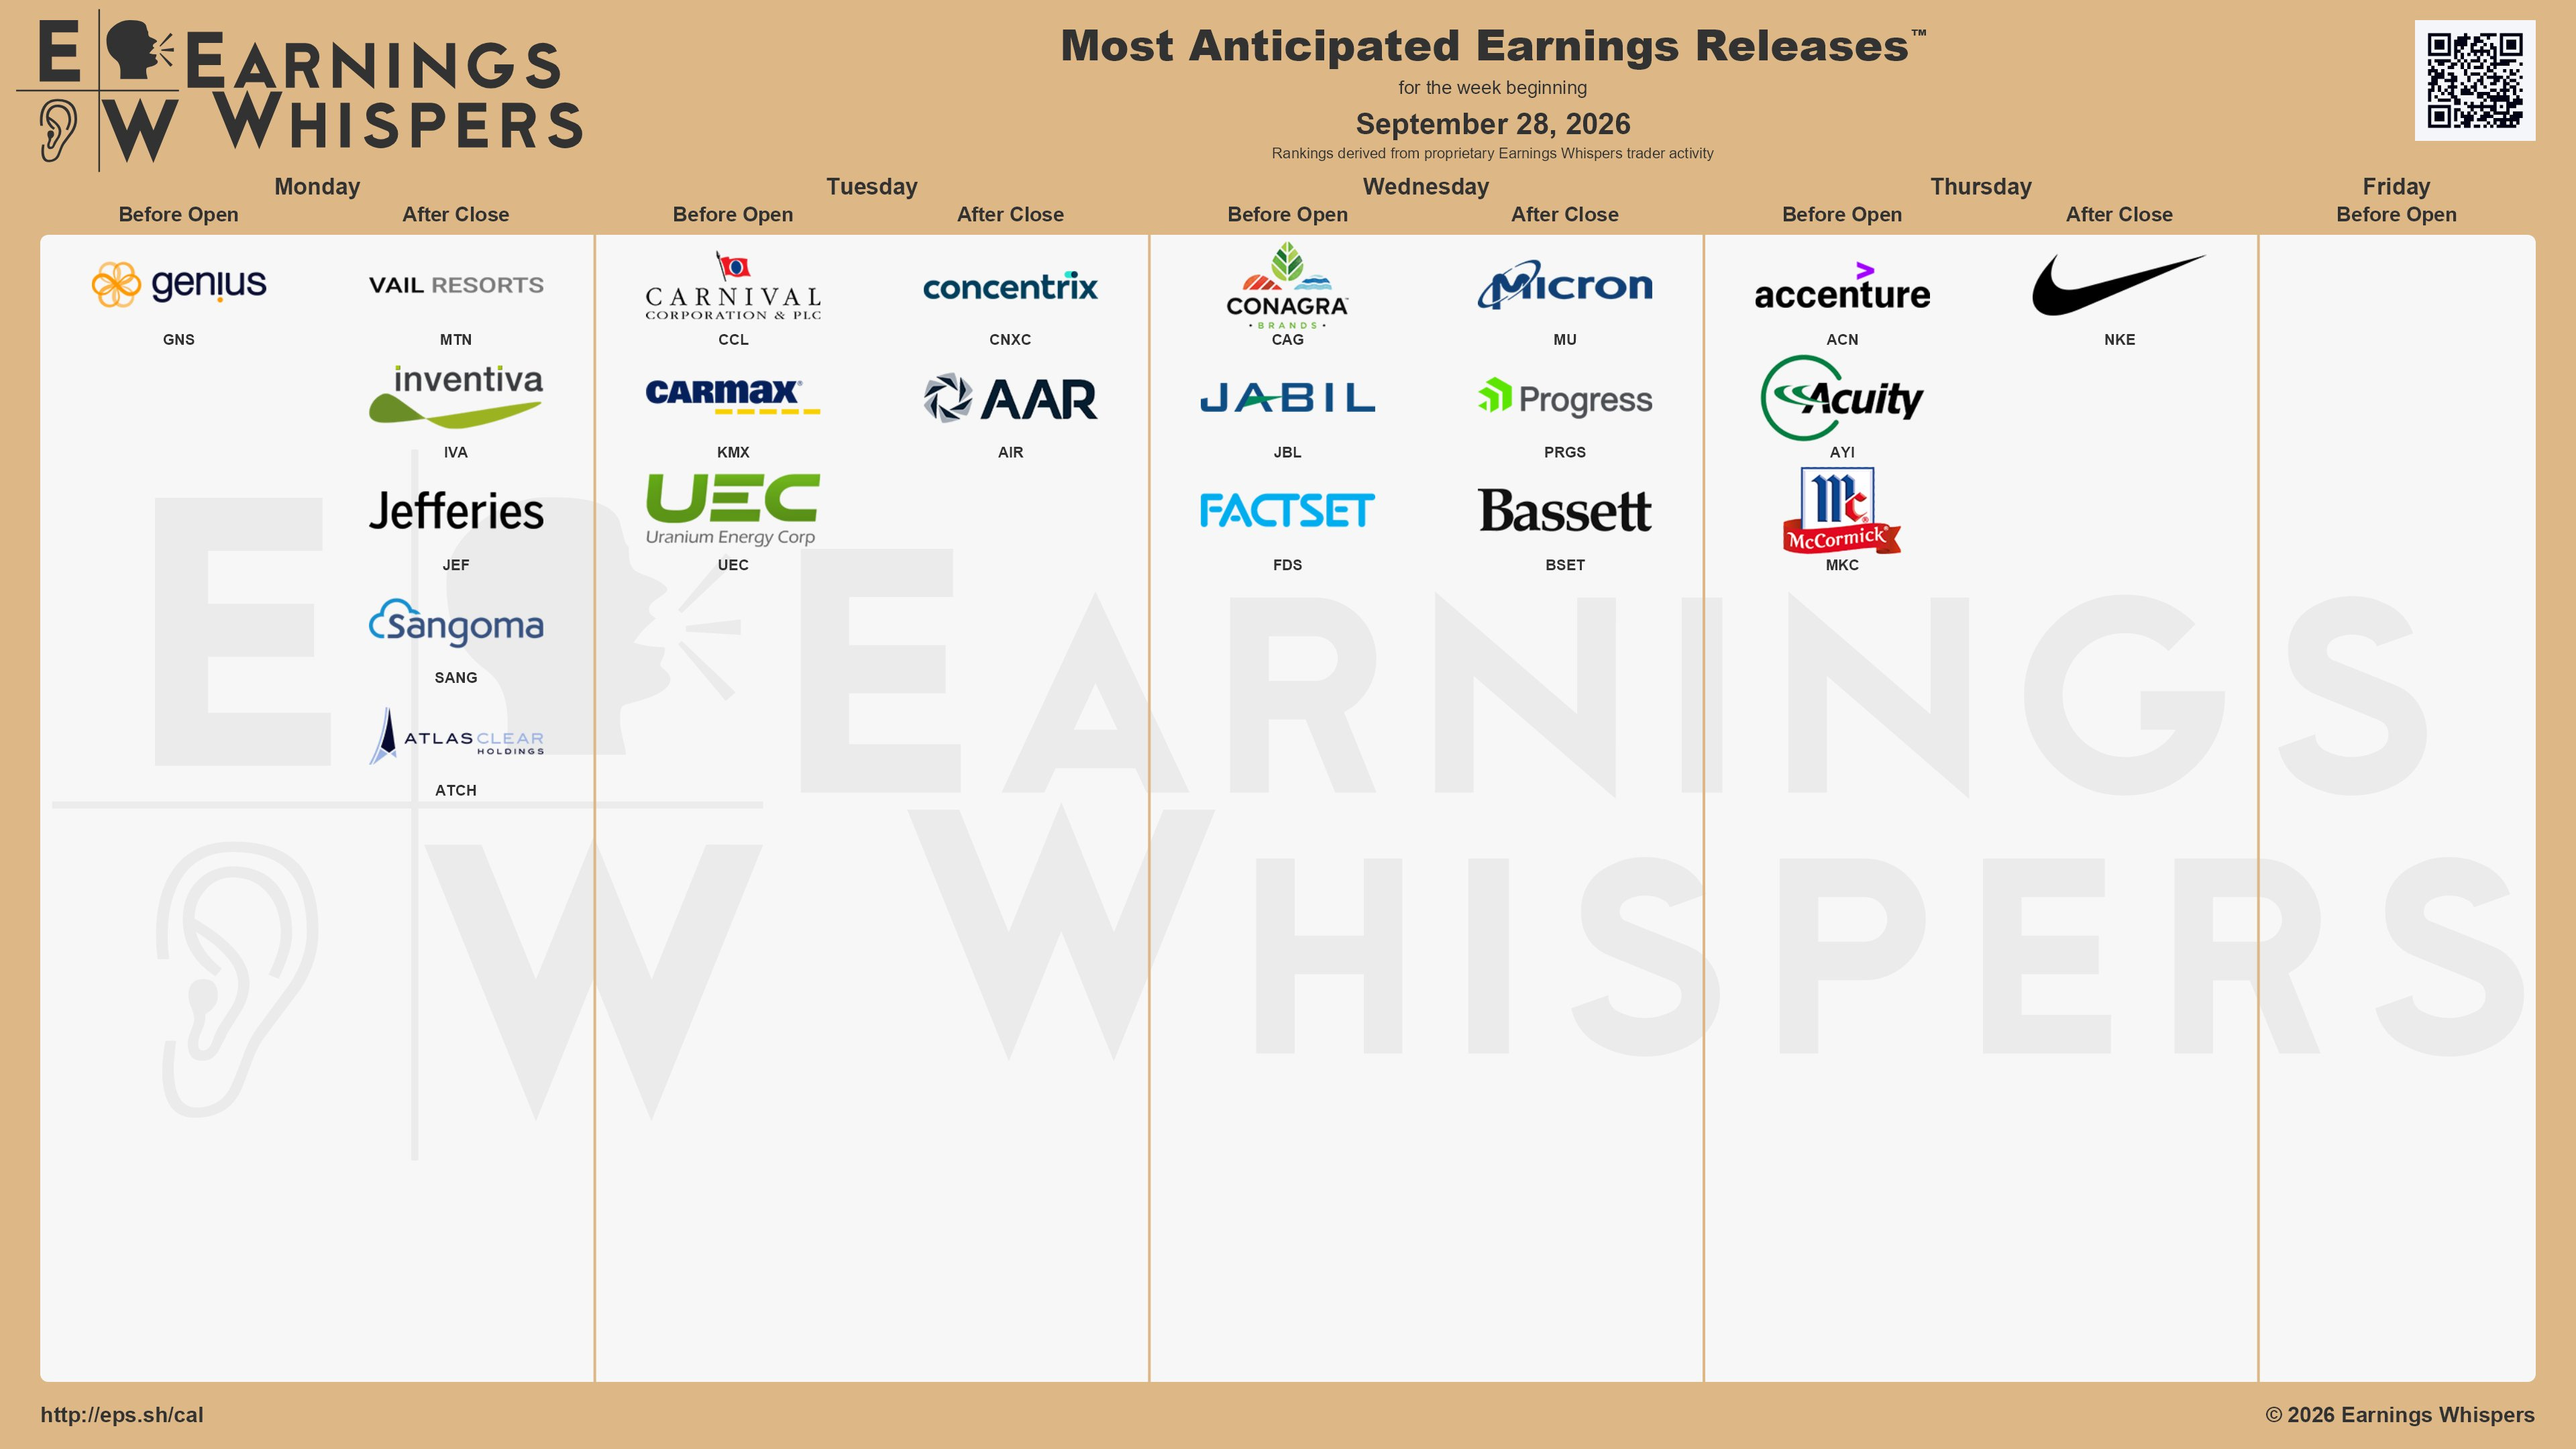
Below is the infographic by Earnings Whispers highlighting the schedule for this week:
Charts
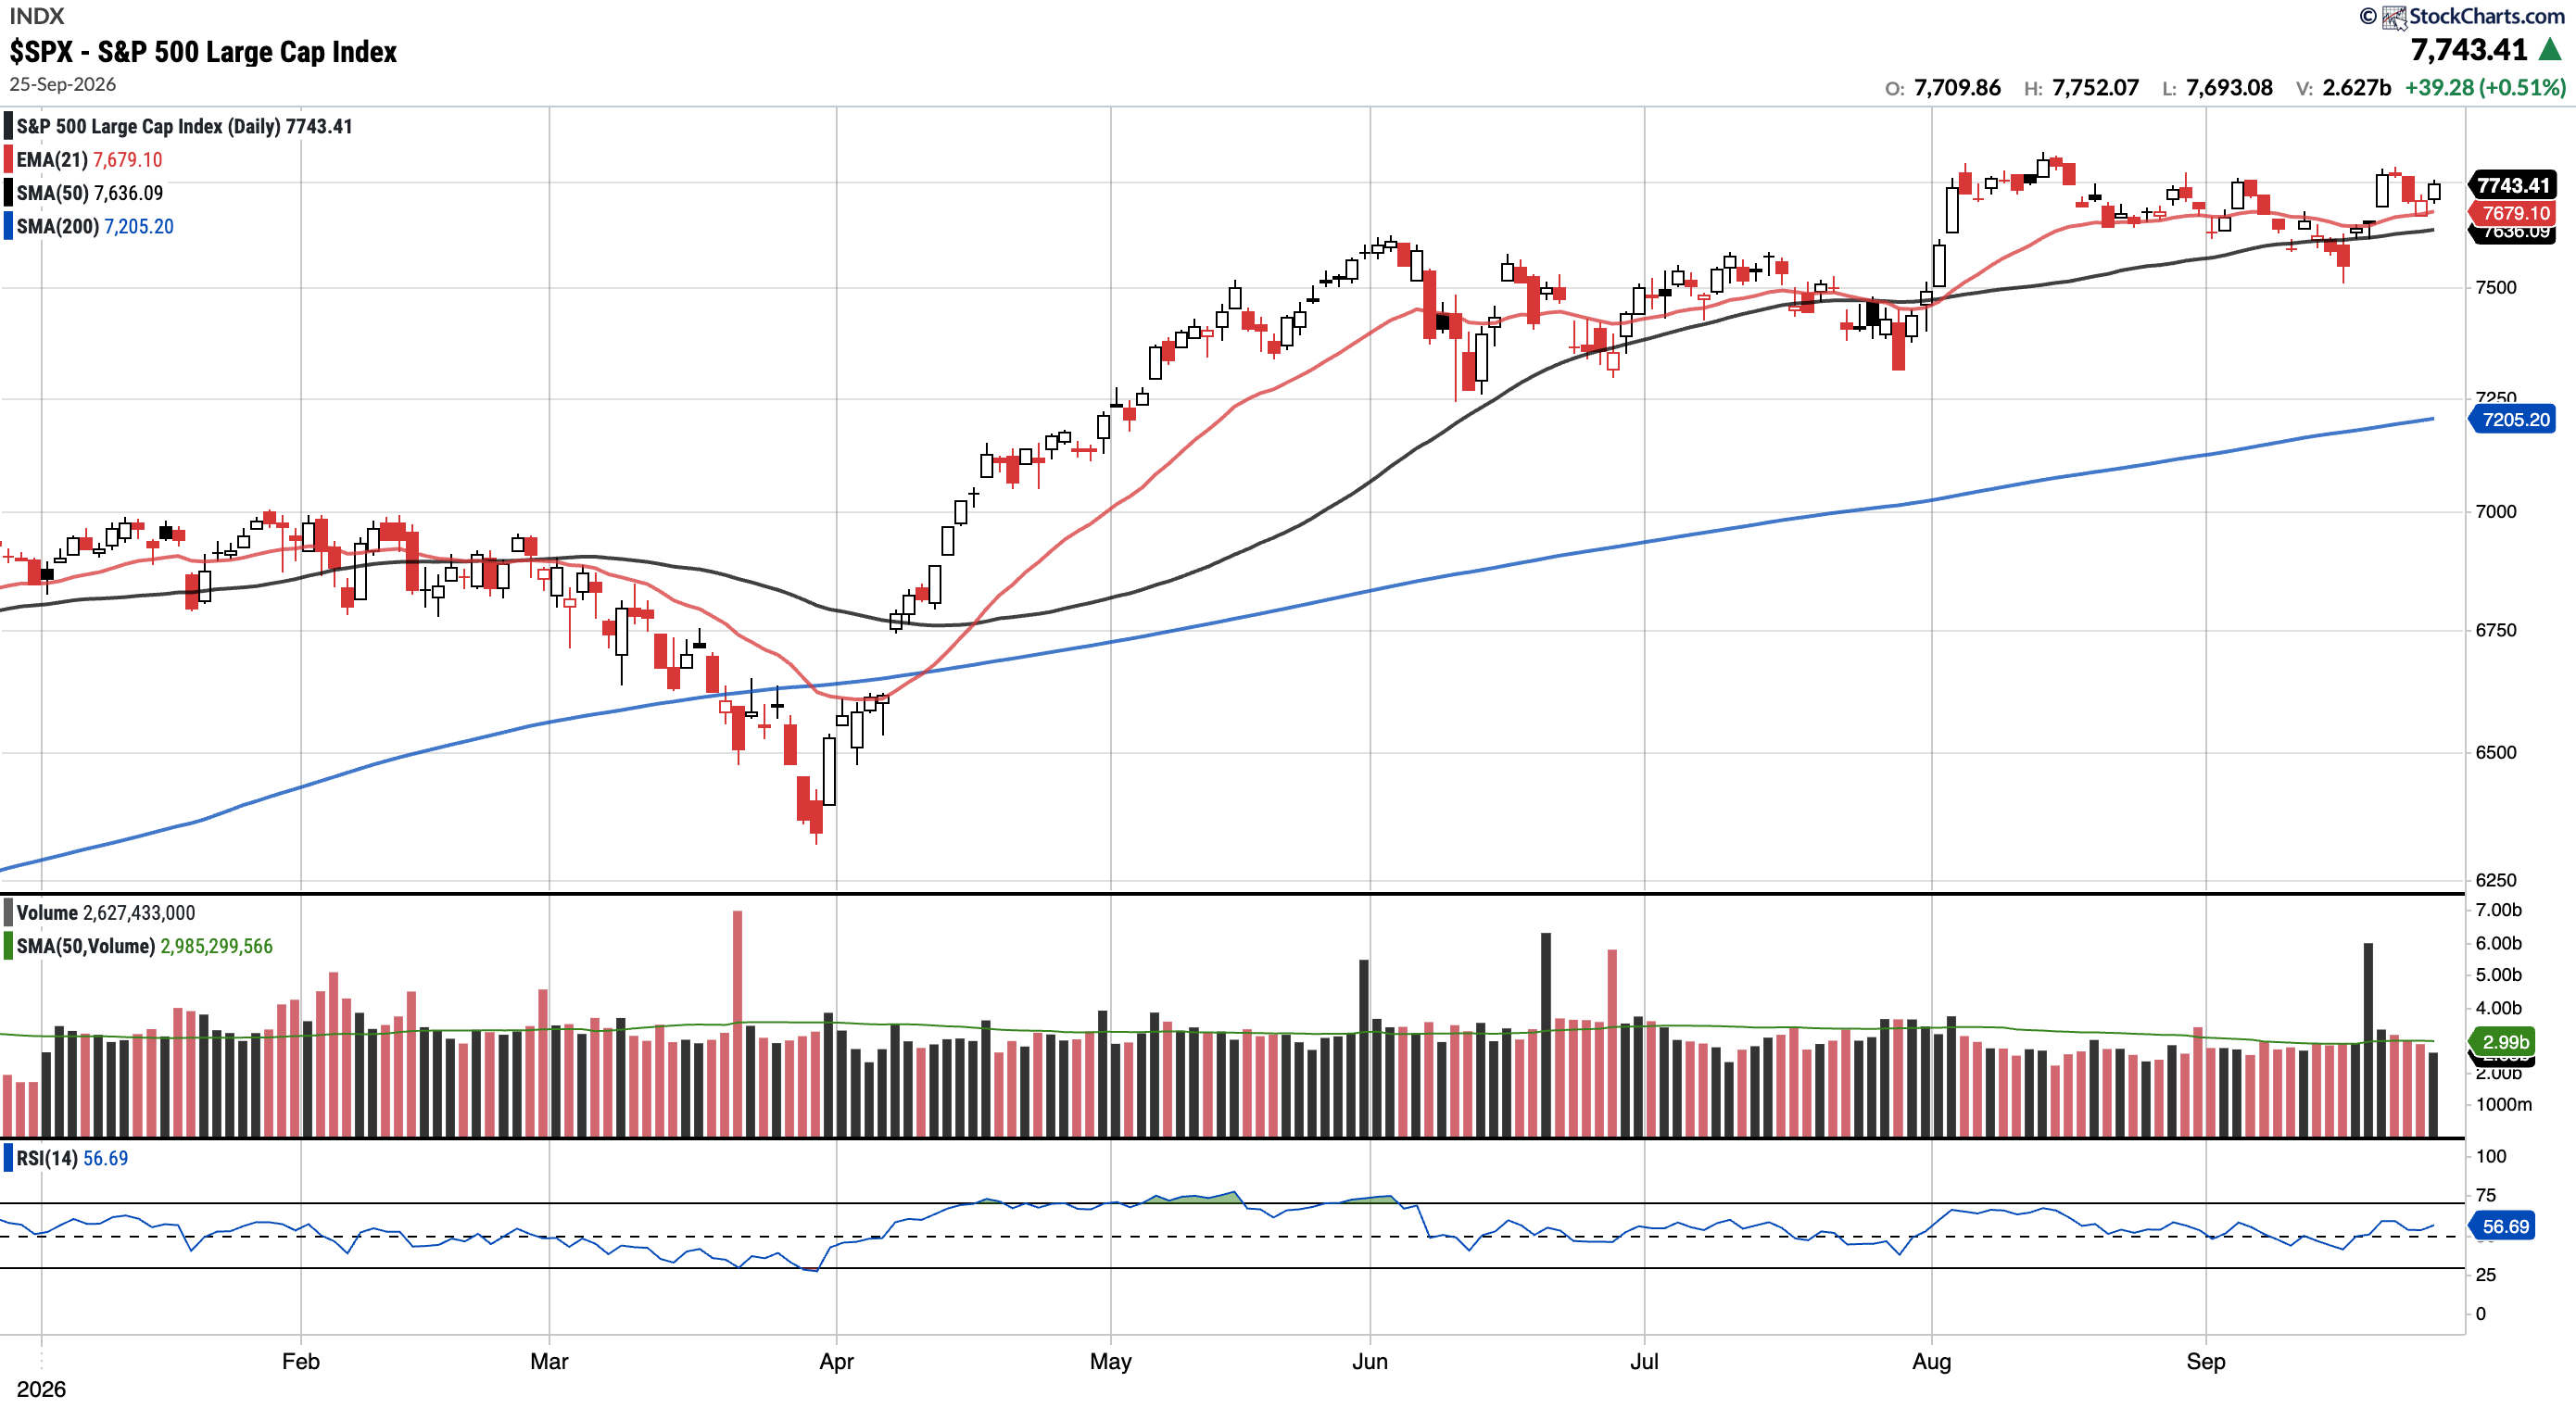
SPX
Currently trades at $7743.41, 1.41% above the 50SMA and 7.47% above the 200SMA.
RSI 56.69
12.90% YTD
Distribution days in the last week: 1
The S&P 500 continued its steady climb this week, with the 21EMA acting as support on pullbacks. Despite volume coming in below its 50-day average, price closed the week above all of its key moving averages.
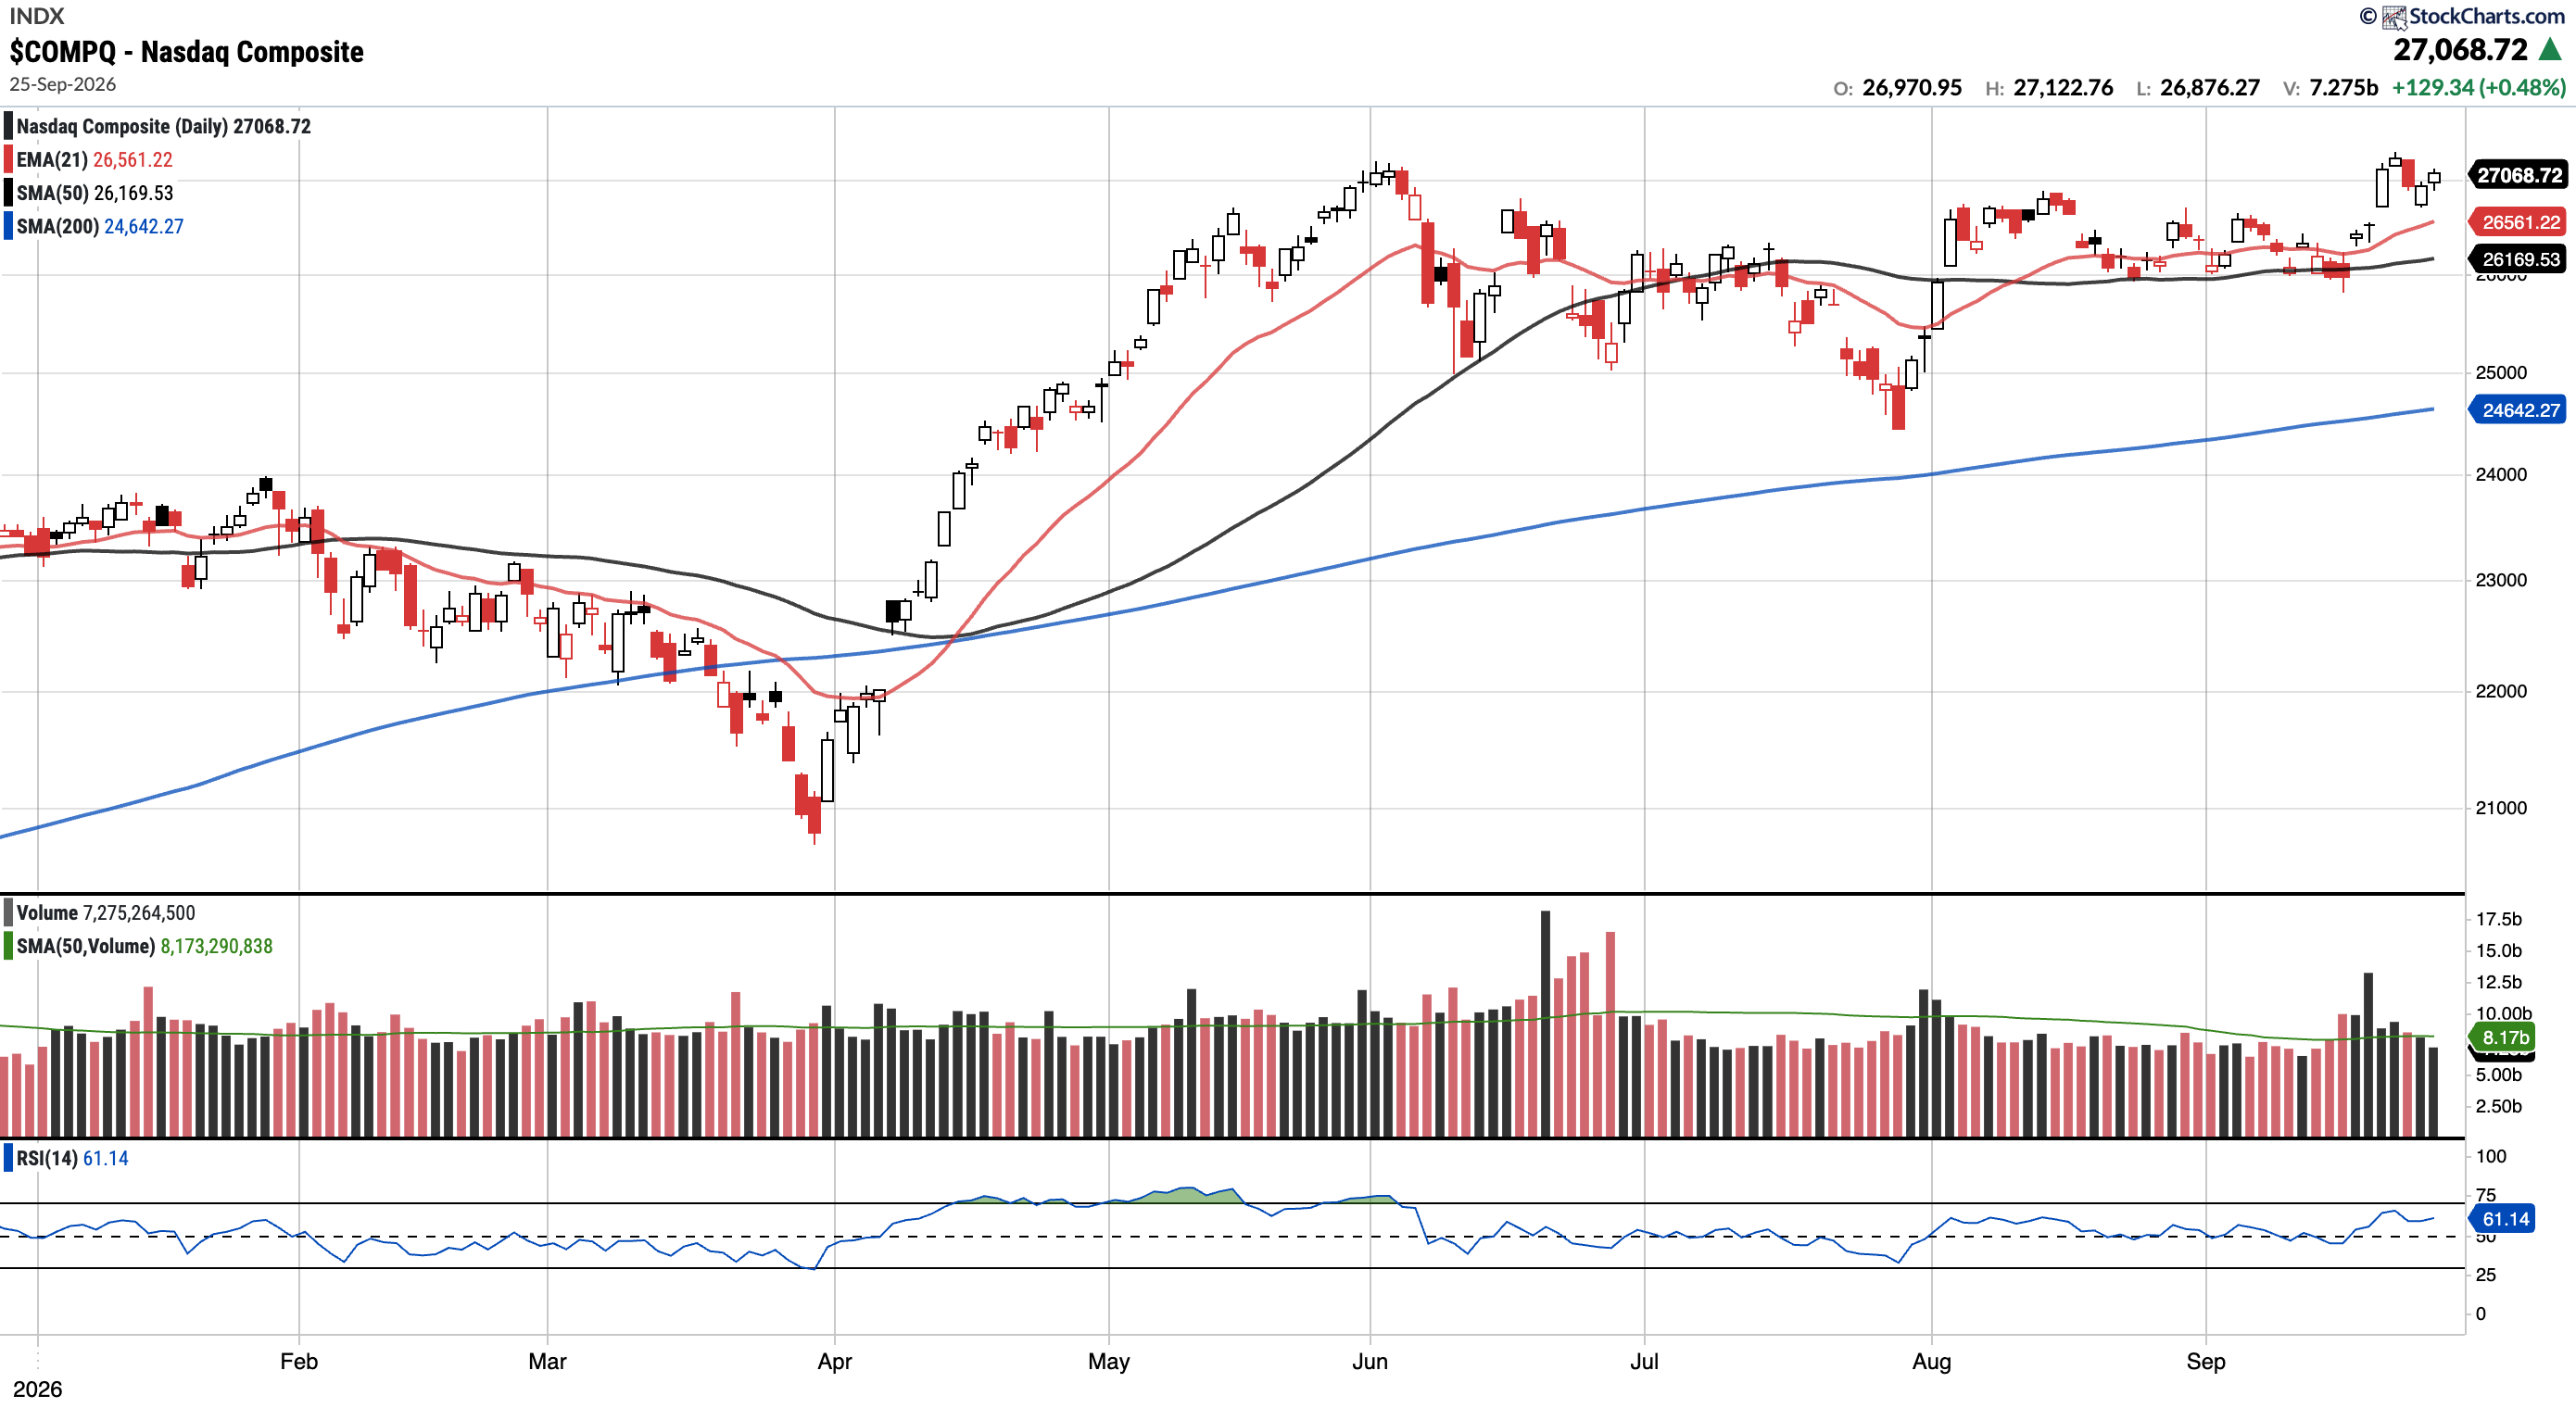
COMPQ
Currently trades at $27,068.72, 3.44% above the 50SMA and 9.85% above the 200SMA.
RSI 61.14
16.50% YTD
Distribution days in the last week: 0
The Nasdaq Composite extended its recovery following a 50-day SMA test earlier in the month. The index neared an all-time high on Tuesday, closing the week comfortably above all of its key moving averages.
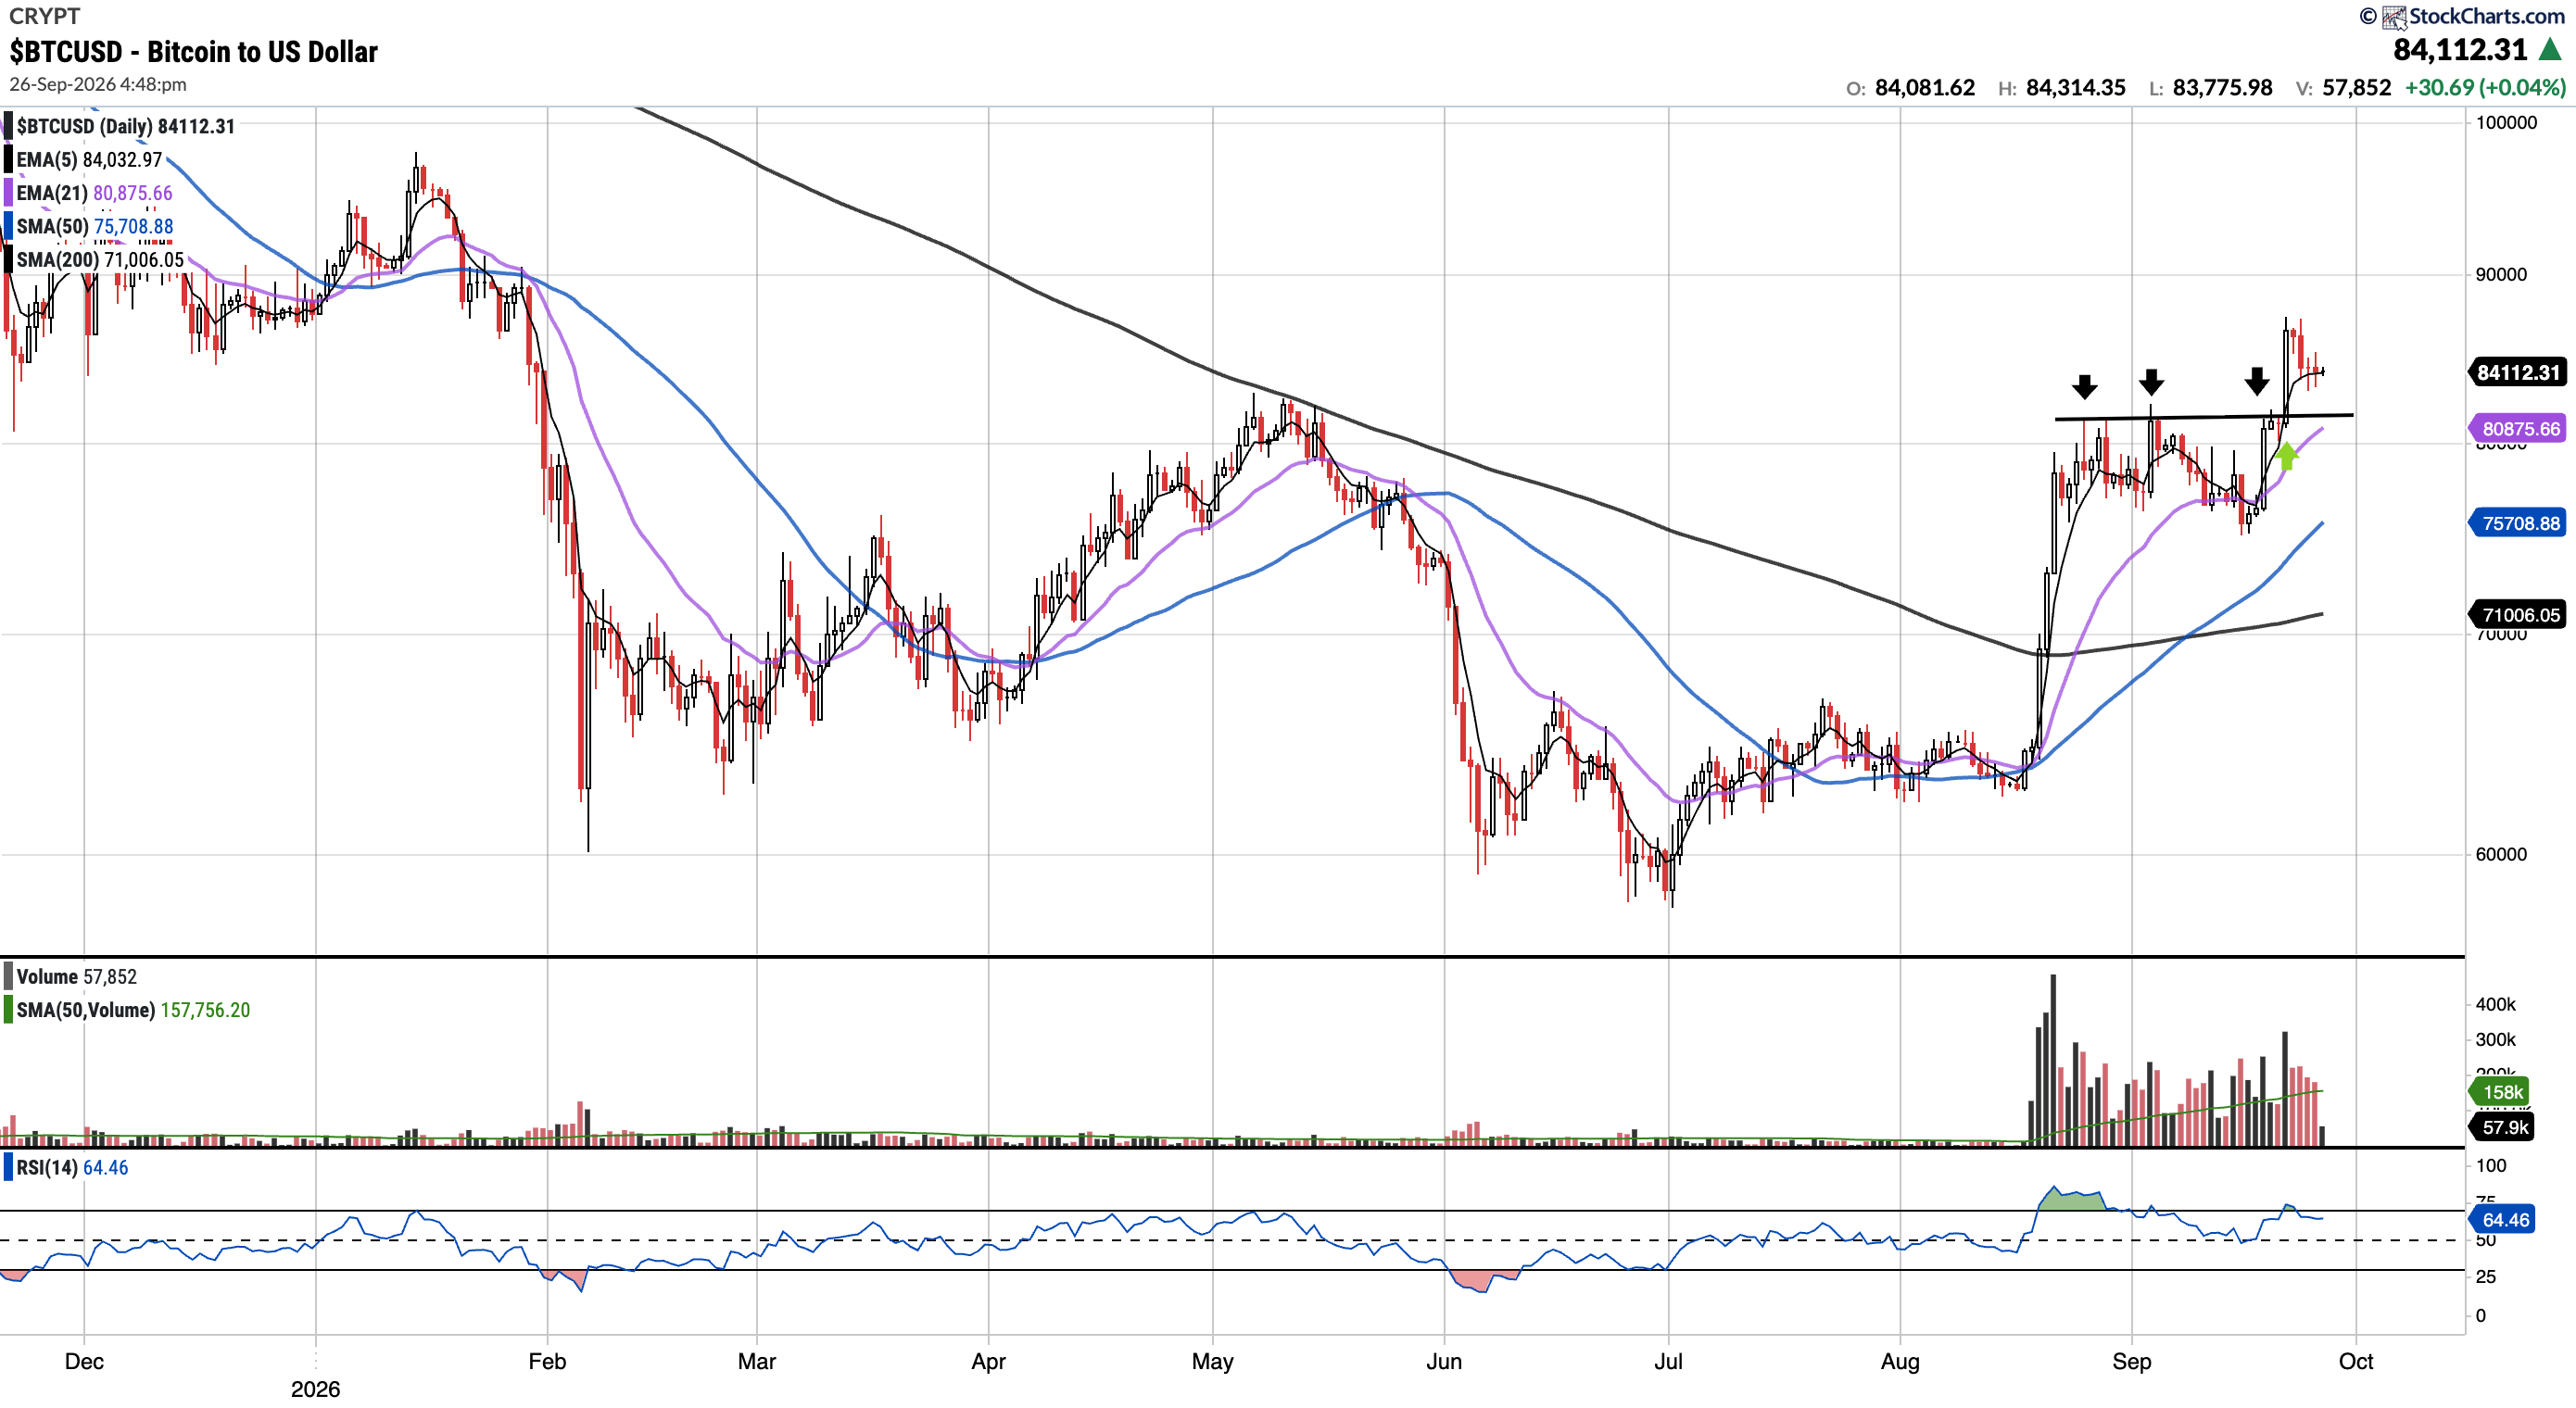
BTC (currently Long)
Currently trades at $84,058.49, 11.03% above the 50SMA and 18.39% above the 200SMA.
RSI 64.46
-5.27% YTD
The $80K–$82K zone flagged as resistance last week has been cleared (see green arrow), which coincided with a clean bounce off 5-EMA support. While BTC remains above all key moving averages, it was rejected at the $87K–$88K level, which bulls must now clear to trigger the next leg up.
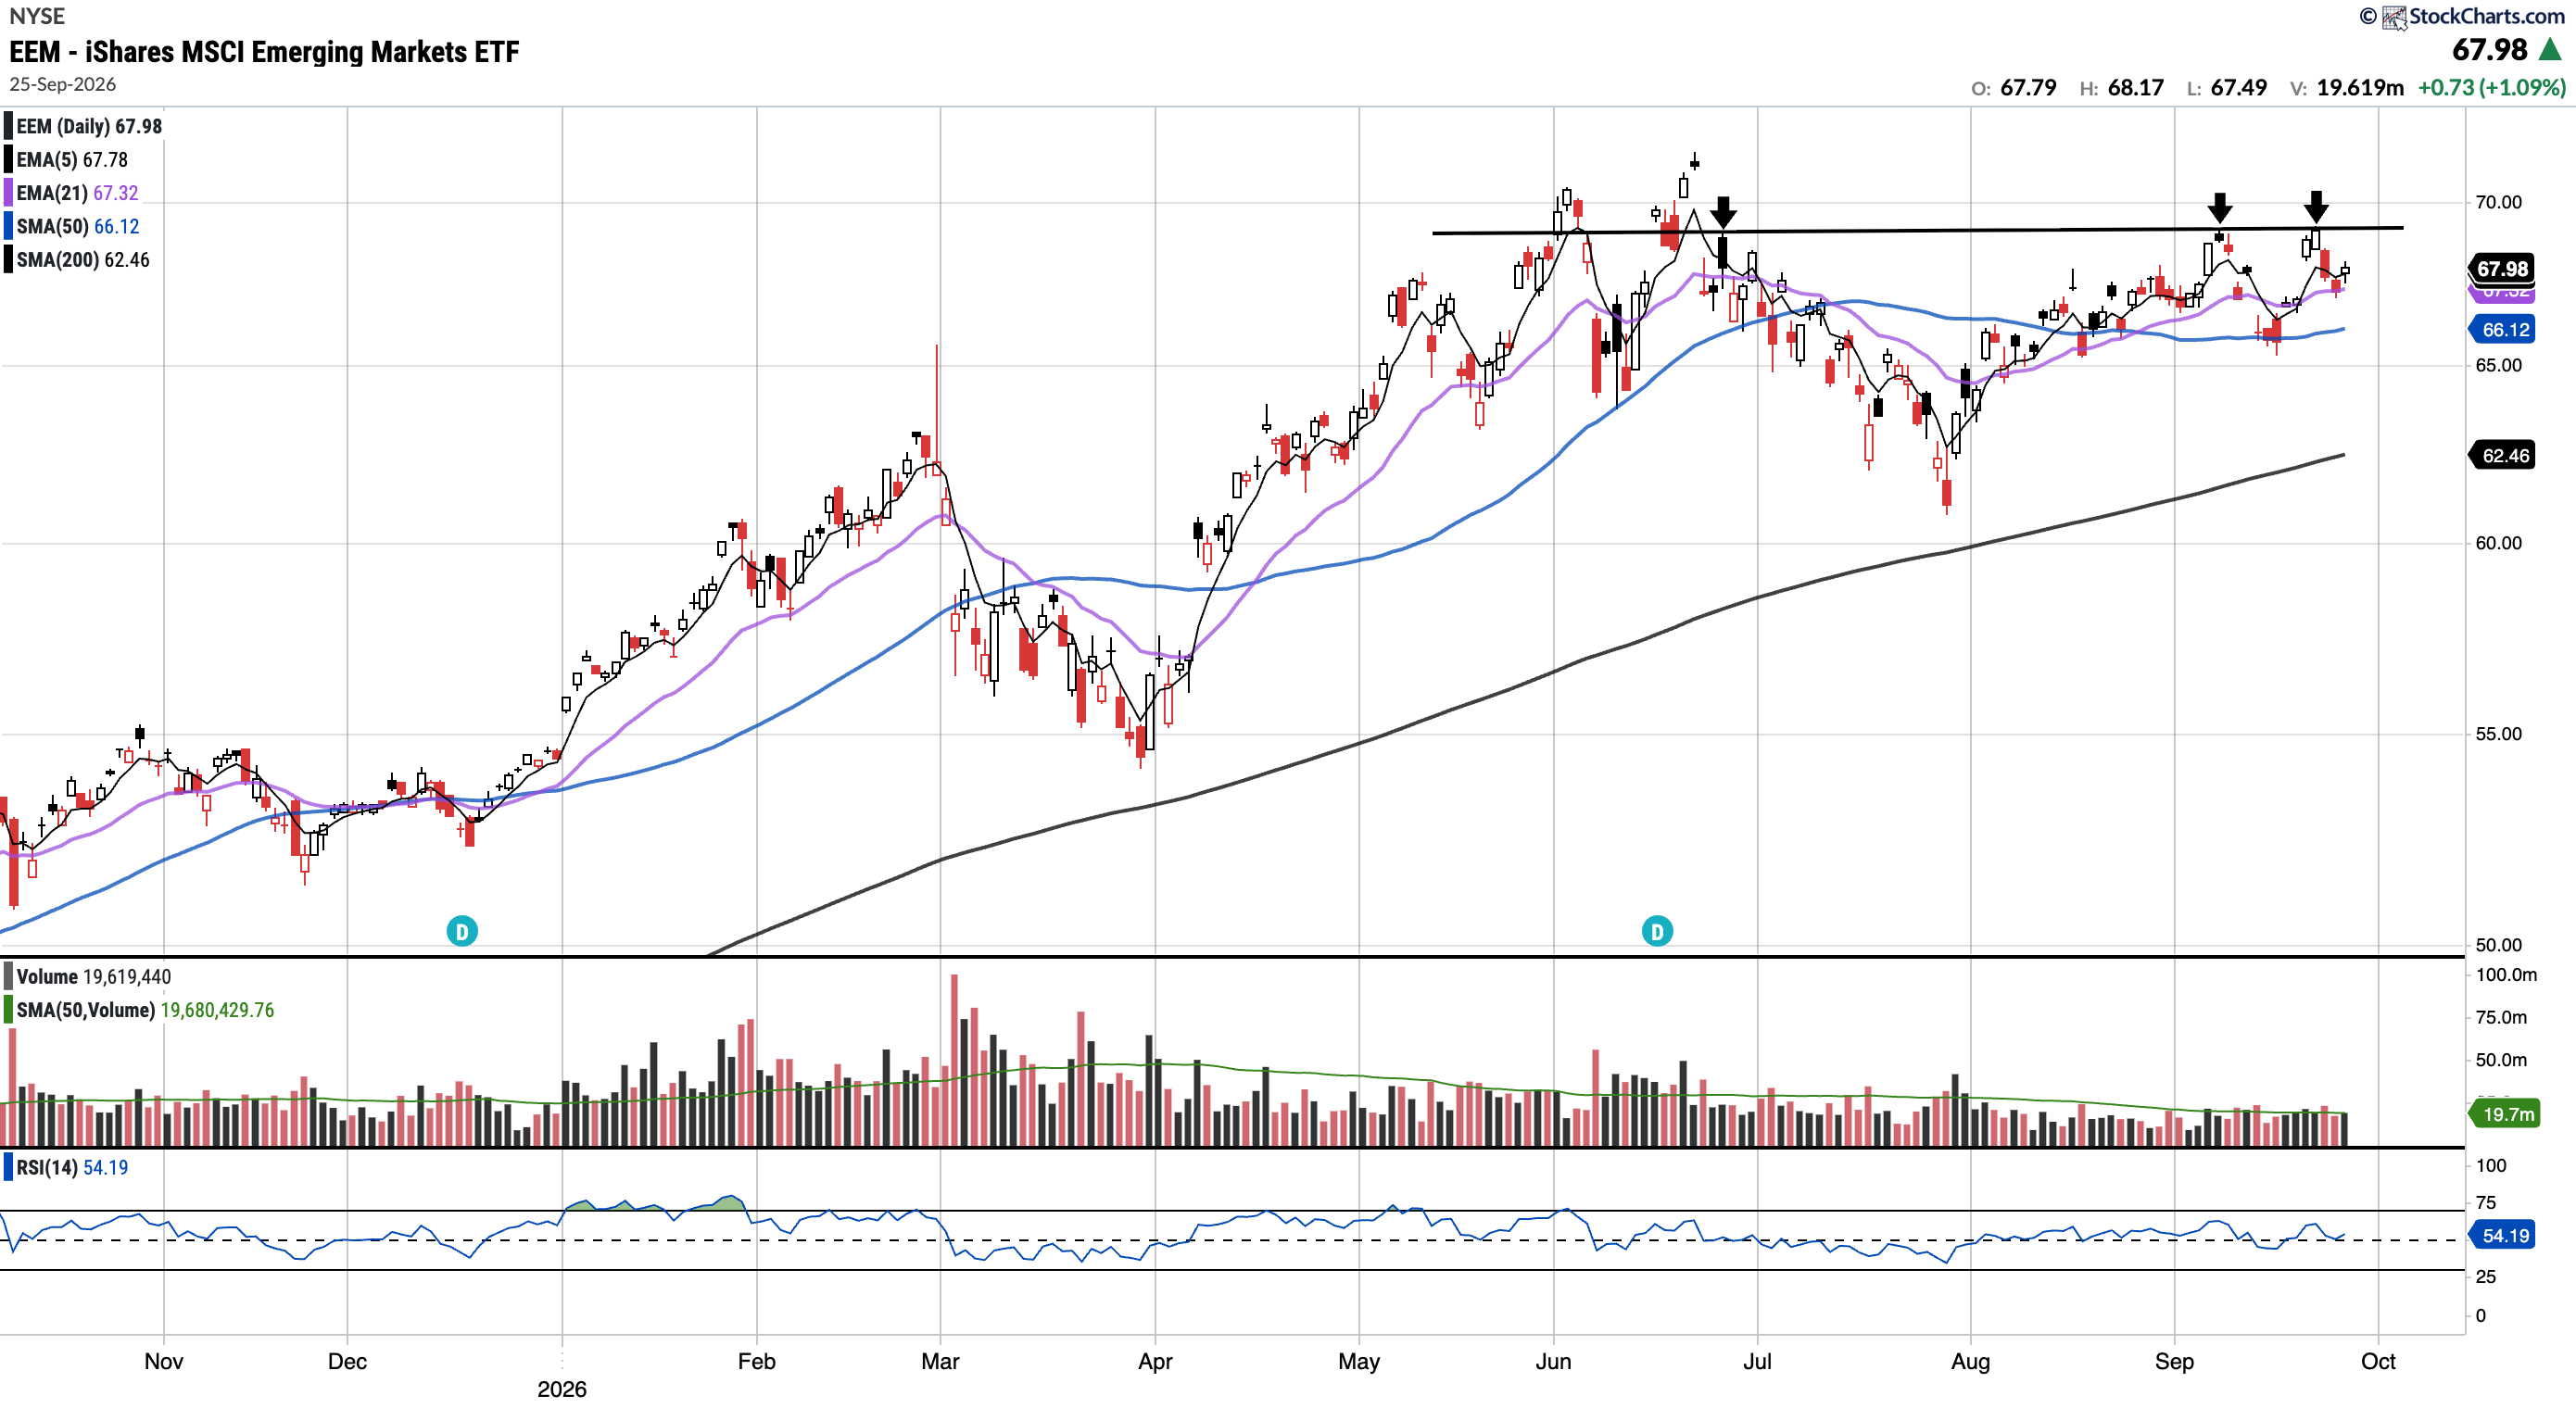
EEM
Currently trades at $67.98, 2.81% above the 50SMA and 8.84% above the 200SMA.
RSI 54.19
21.50% YTD
EEM has now rejected the $69 level three times, and continues to hold just below. While price remains above all of its key moving averages, keeping the broader uptrend intact, a decisive break above $69-70 is what bulls need to watch for the next leg higher.
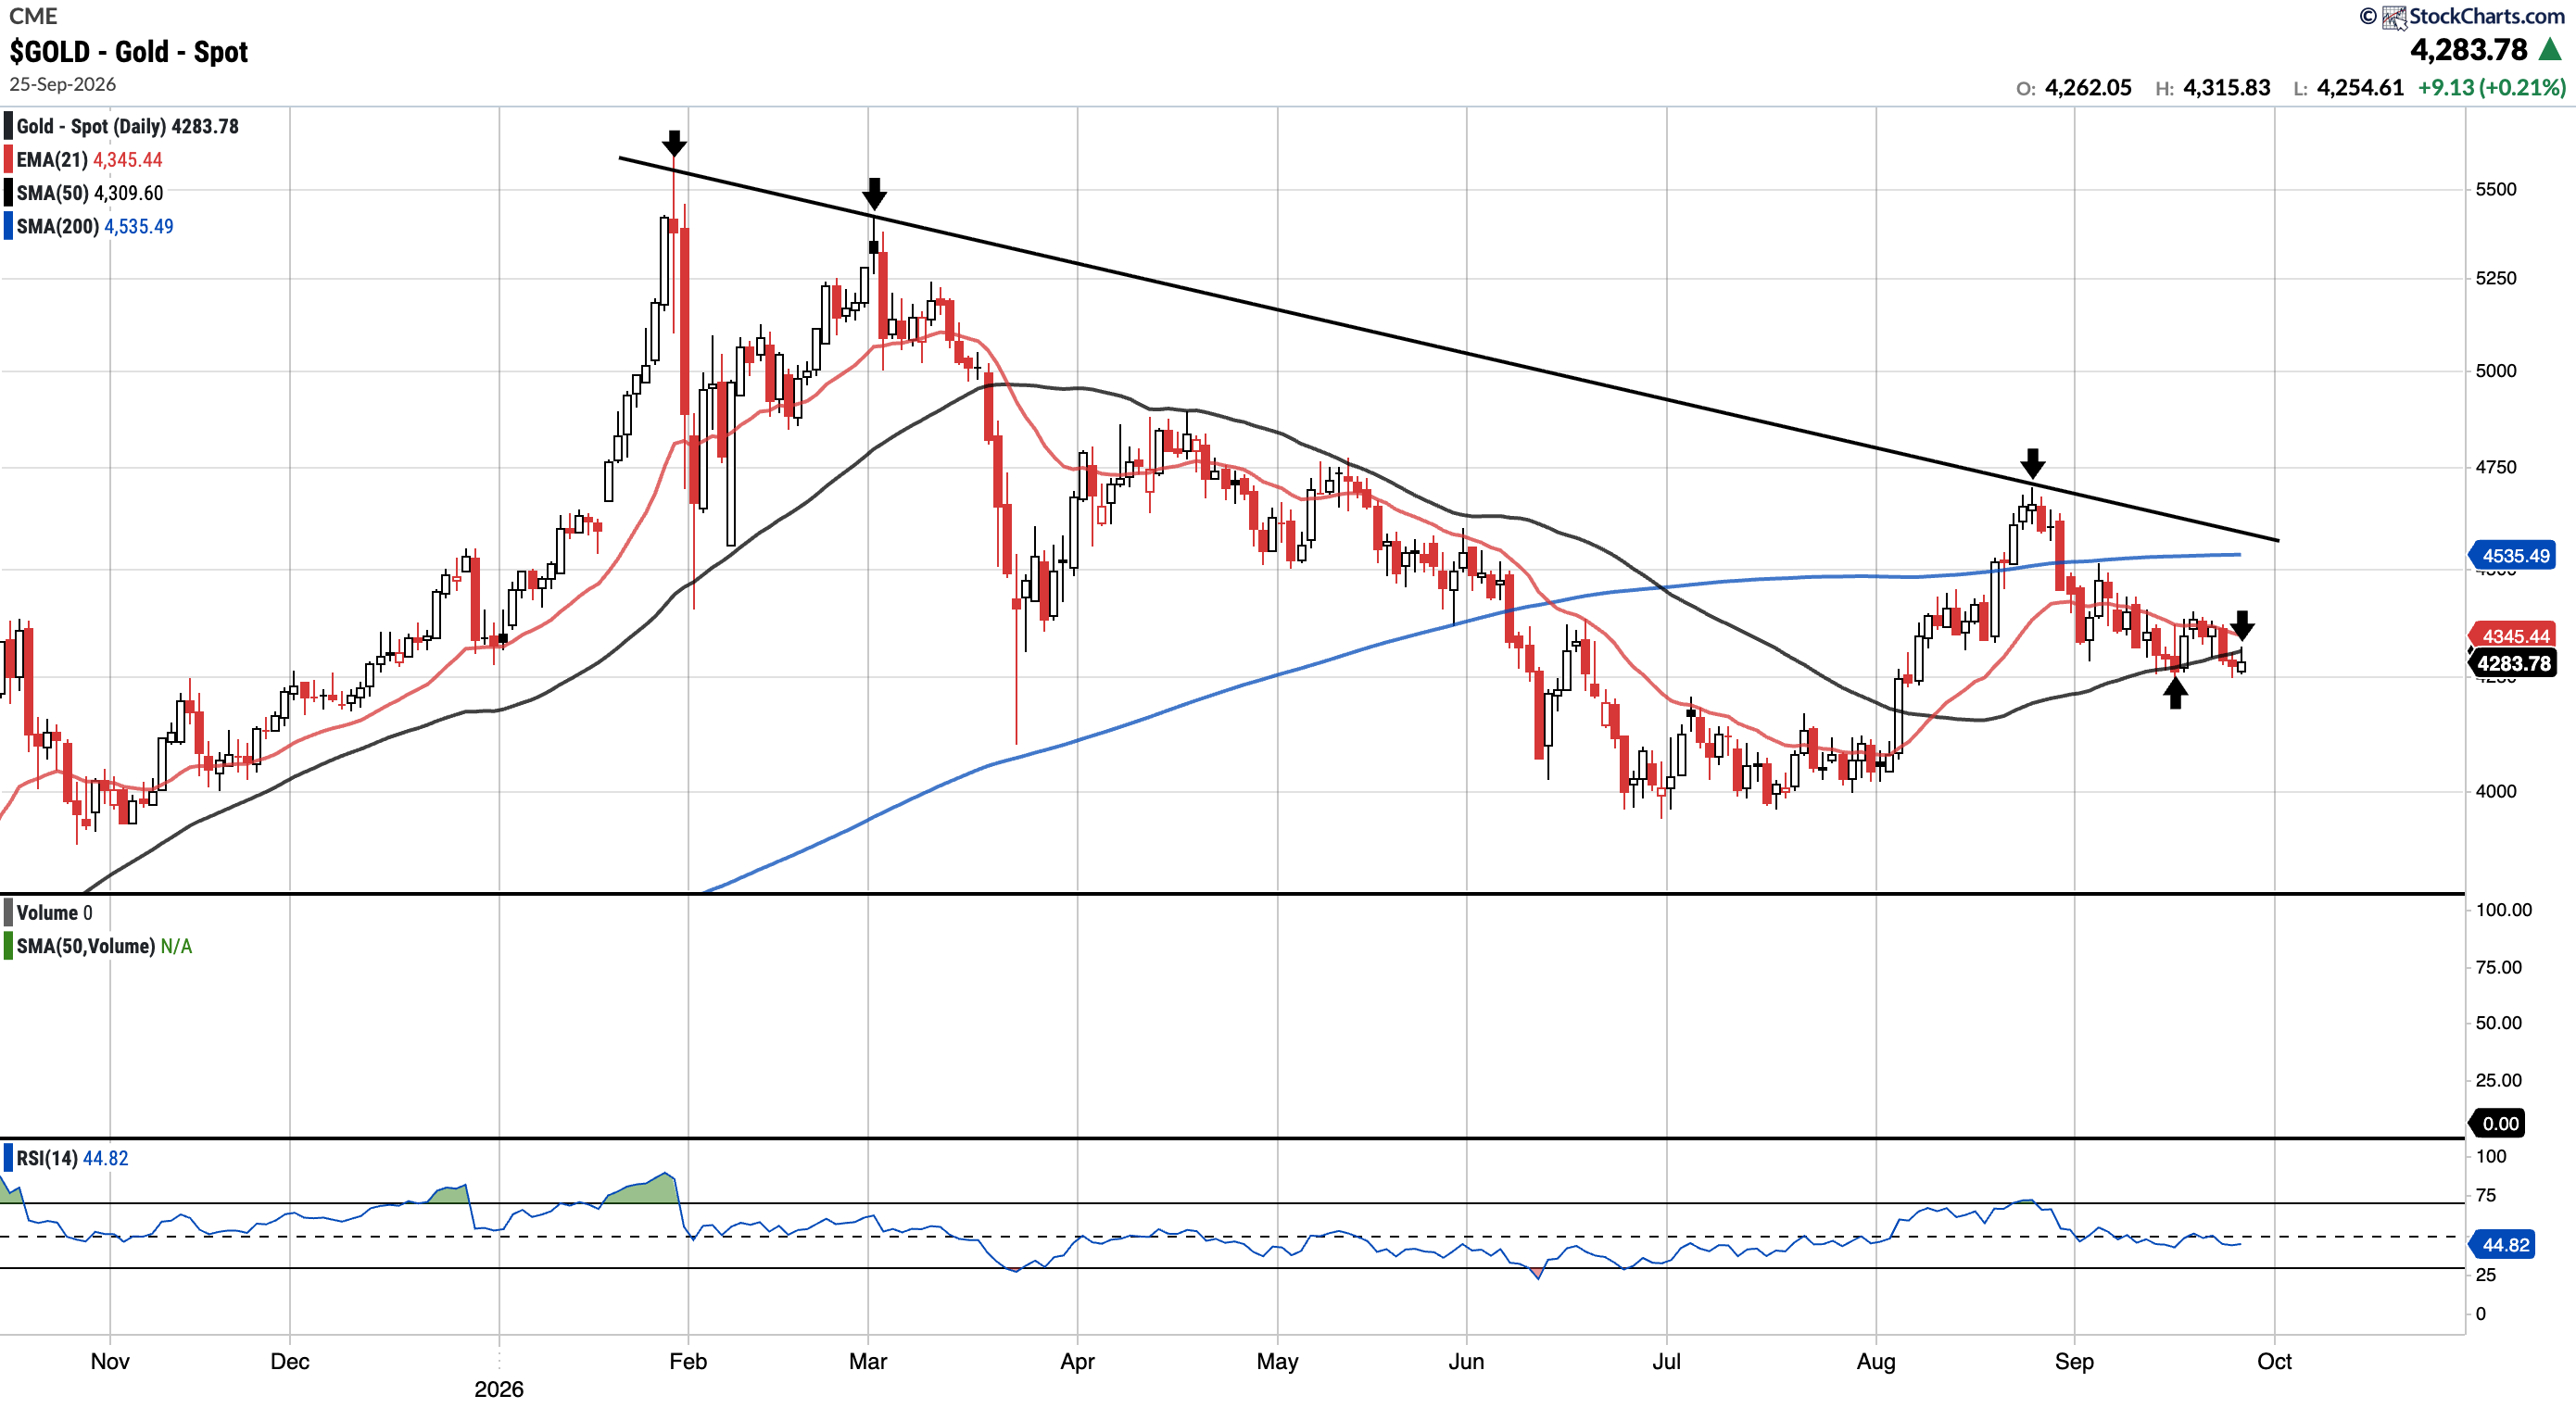
GOLD (Long Physical)
Currently trades at $4,283.78, 0.60% below the 50SMA and 5.55% below the 200SMA.
RSI 44.82
-1.17% YTD
Gold remains in a downtrend from its January peak. A bounce off the $4,100–$4,150 support zone earlier this month has faded, leaving price pinned just below both its 21-day EMA and 50-day SMA, with the 200-day SMA overhead at $4,535.
Bulls need to reclaim the 50-day SMA first, followed by the 200-day SMA and the January descending trendline as major overhead resistance.
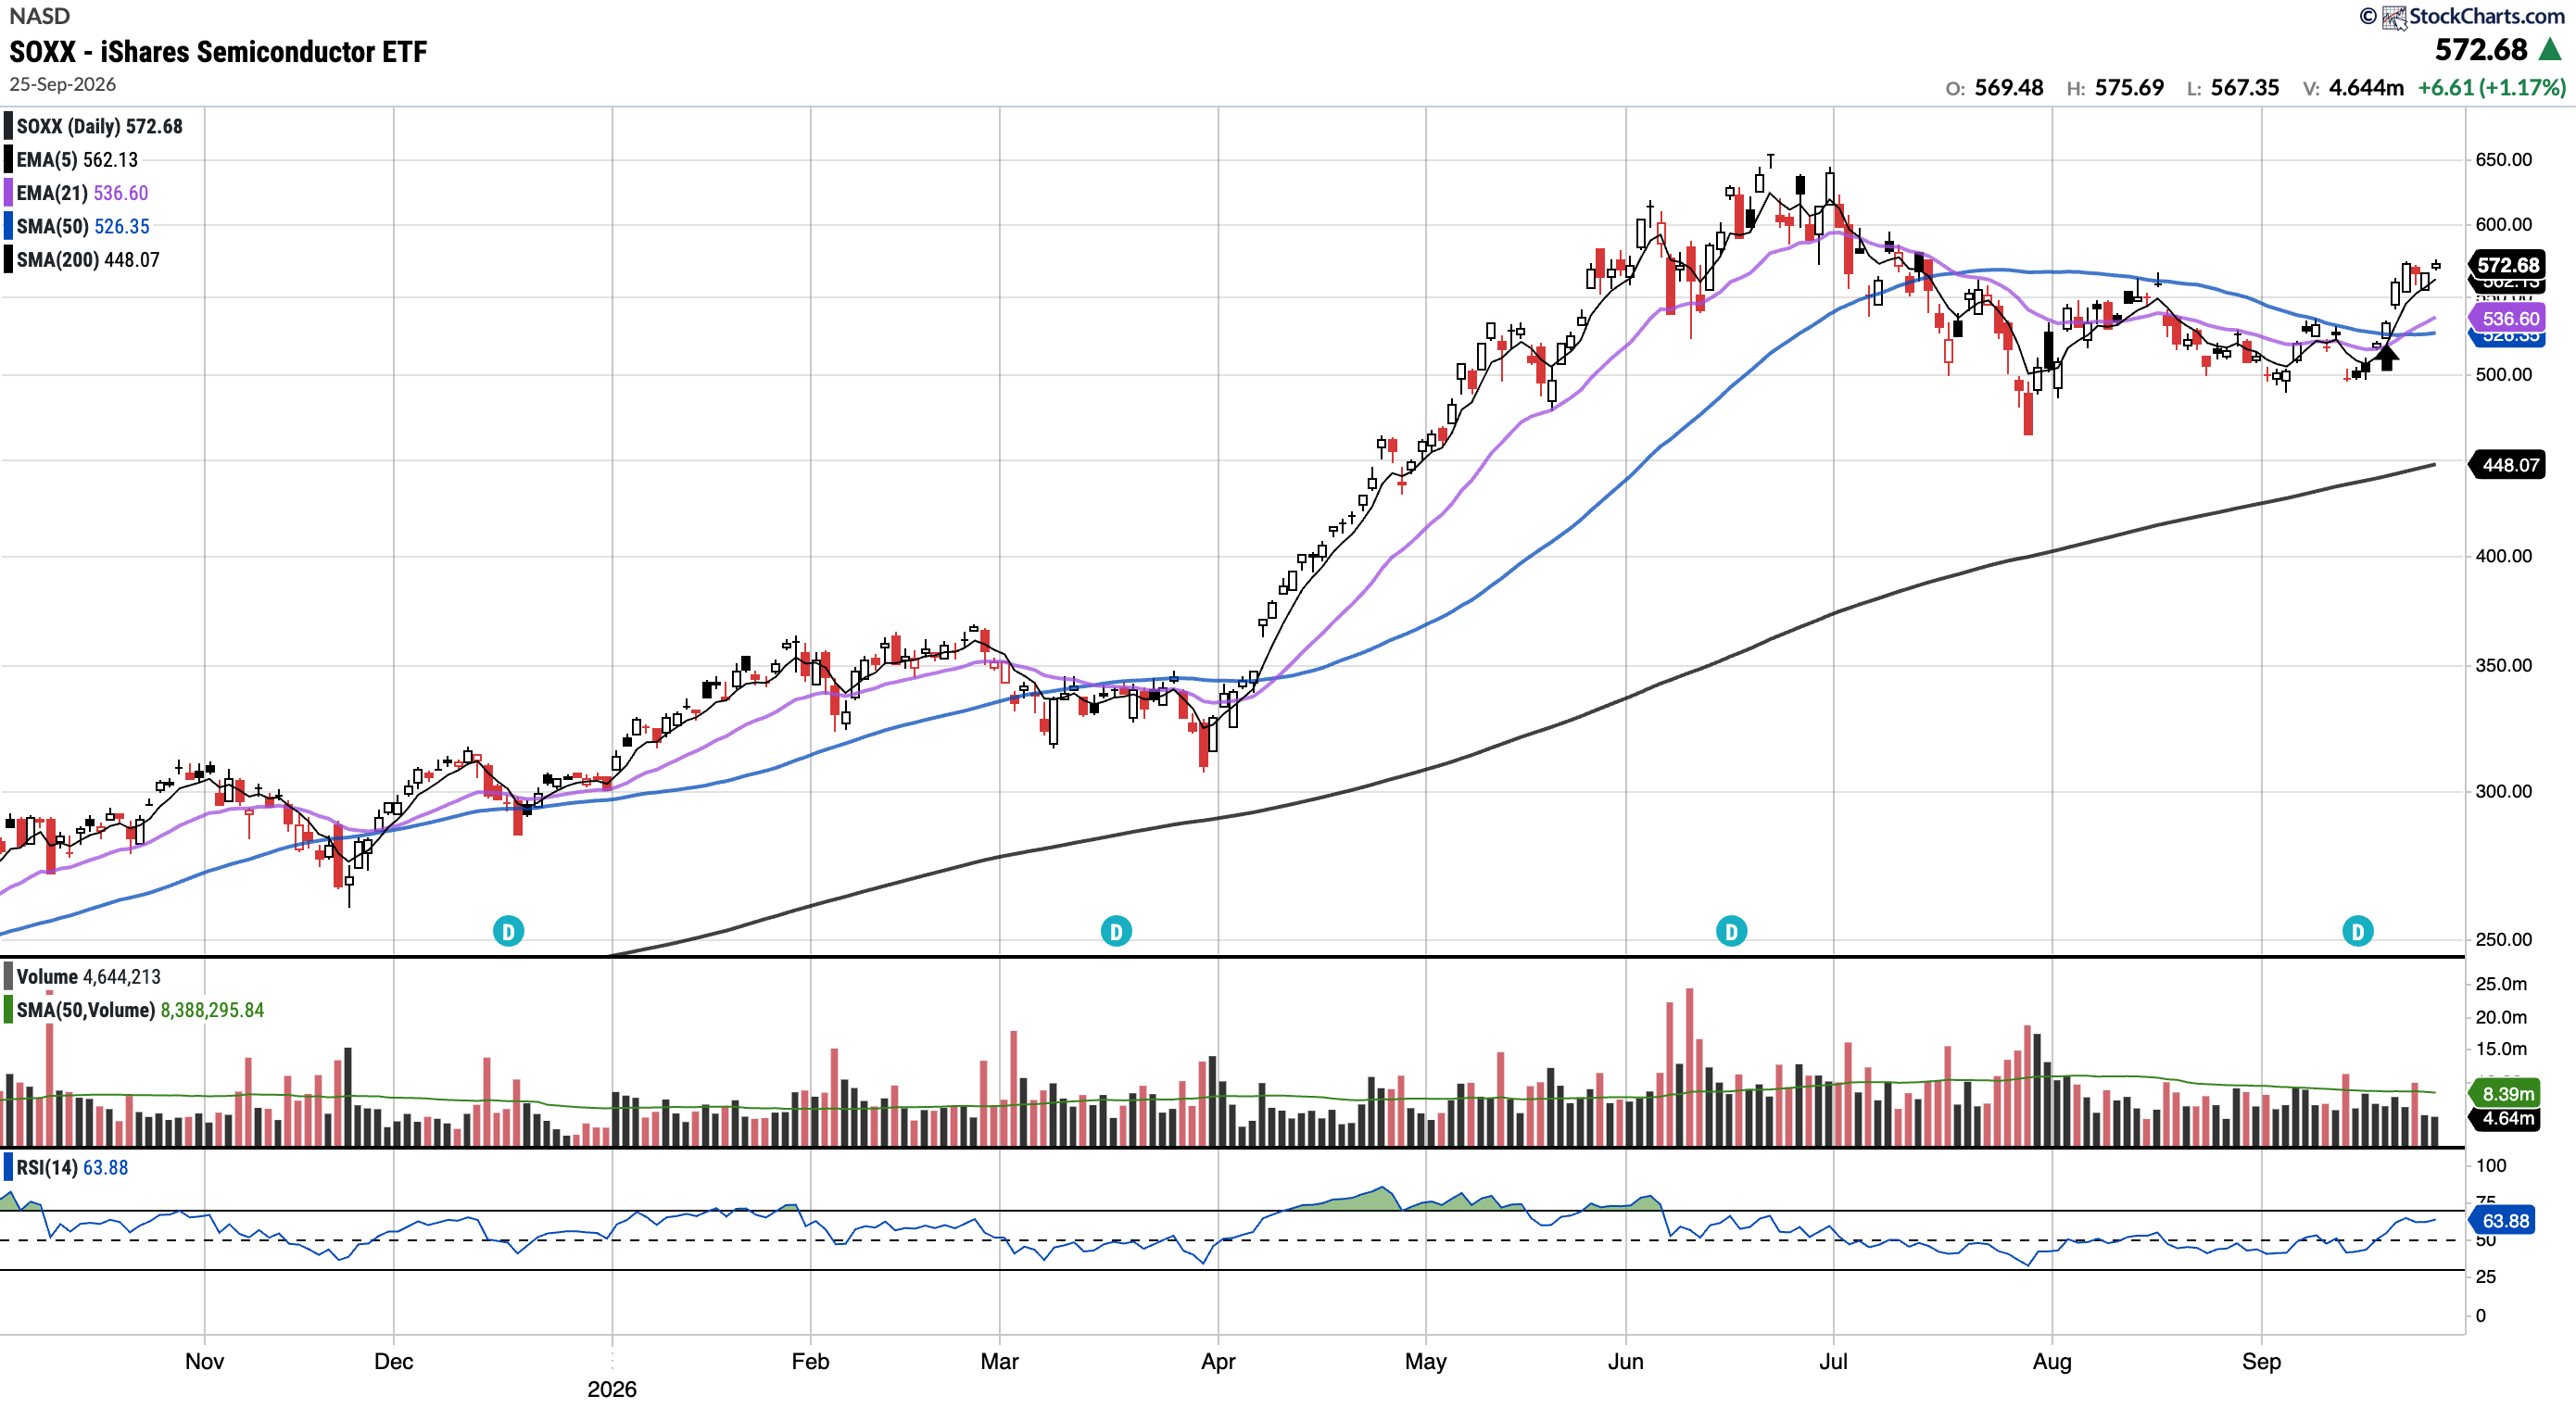
SOXX
Currently trades at $572.68, 8.80% above the 50SMA and 27.81% above the 200SMA.
RSI 63.88
82.88% YTD
SOXX continued to push higher following its breakout above both the 21-day EMA and 50-day SMA, closing the week back above all key moving averages and clearing its mid-August high. The arrows demonstrates the 5/21 cross also, a signal that can mark the start of a new uptrend.
SKHY (Currently Long)
Currently trades at $191.56, 16.83% above the 50SMA.
RSI 59.71
14.02% YTD
Price continues to consolidate between the $178 support/pivot level and resistance around $199–$200, a natural pause following August's rally from sub-$130. Crucially, price remains supported above $178. Bulls would like a decisive breakout above $199–$200 to signal continuation of the broader uptrend.
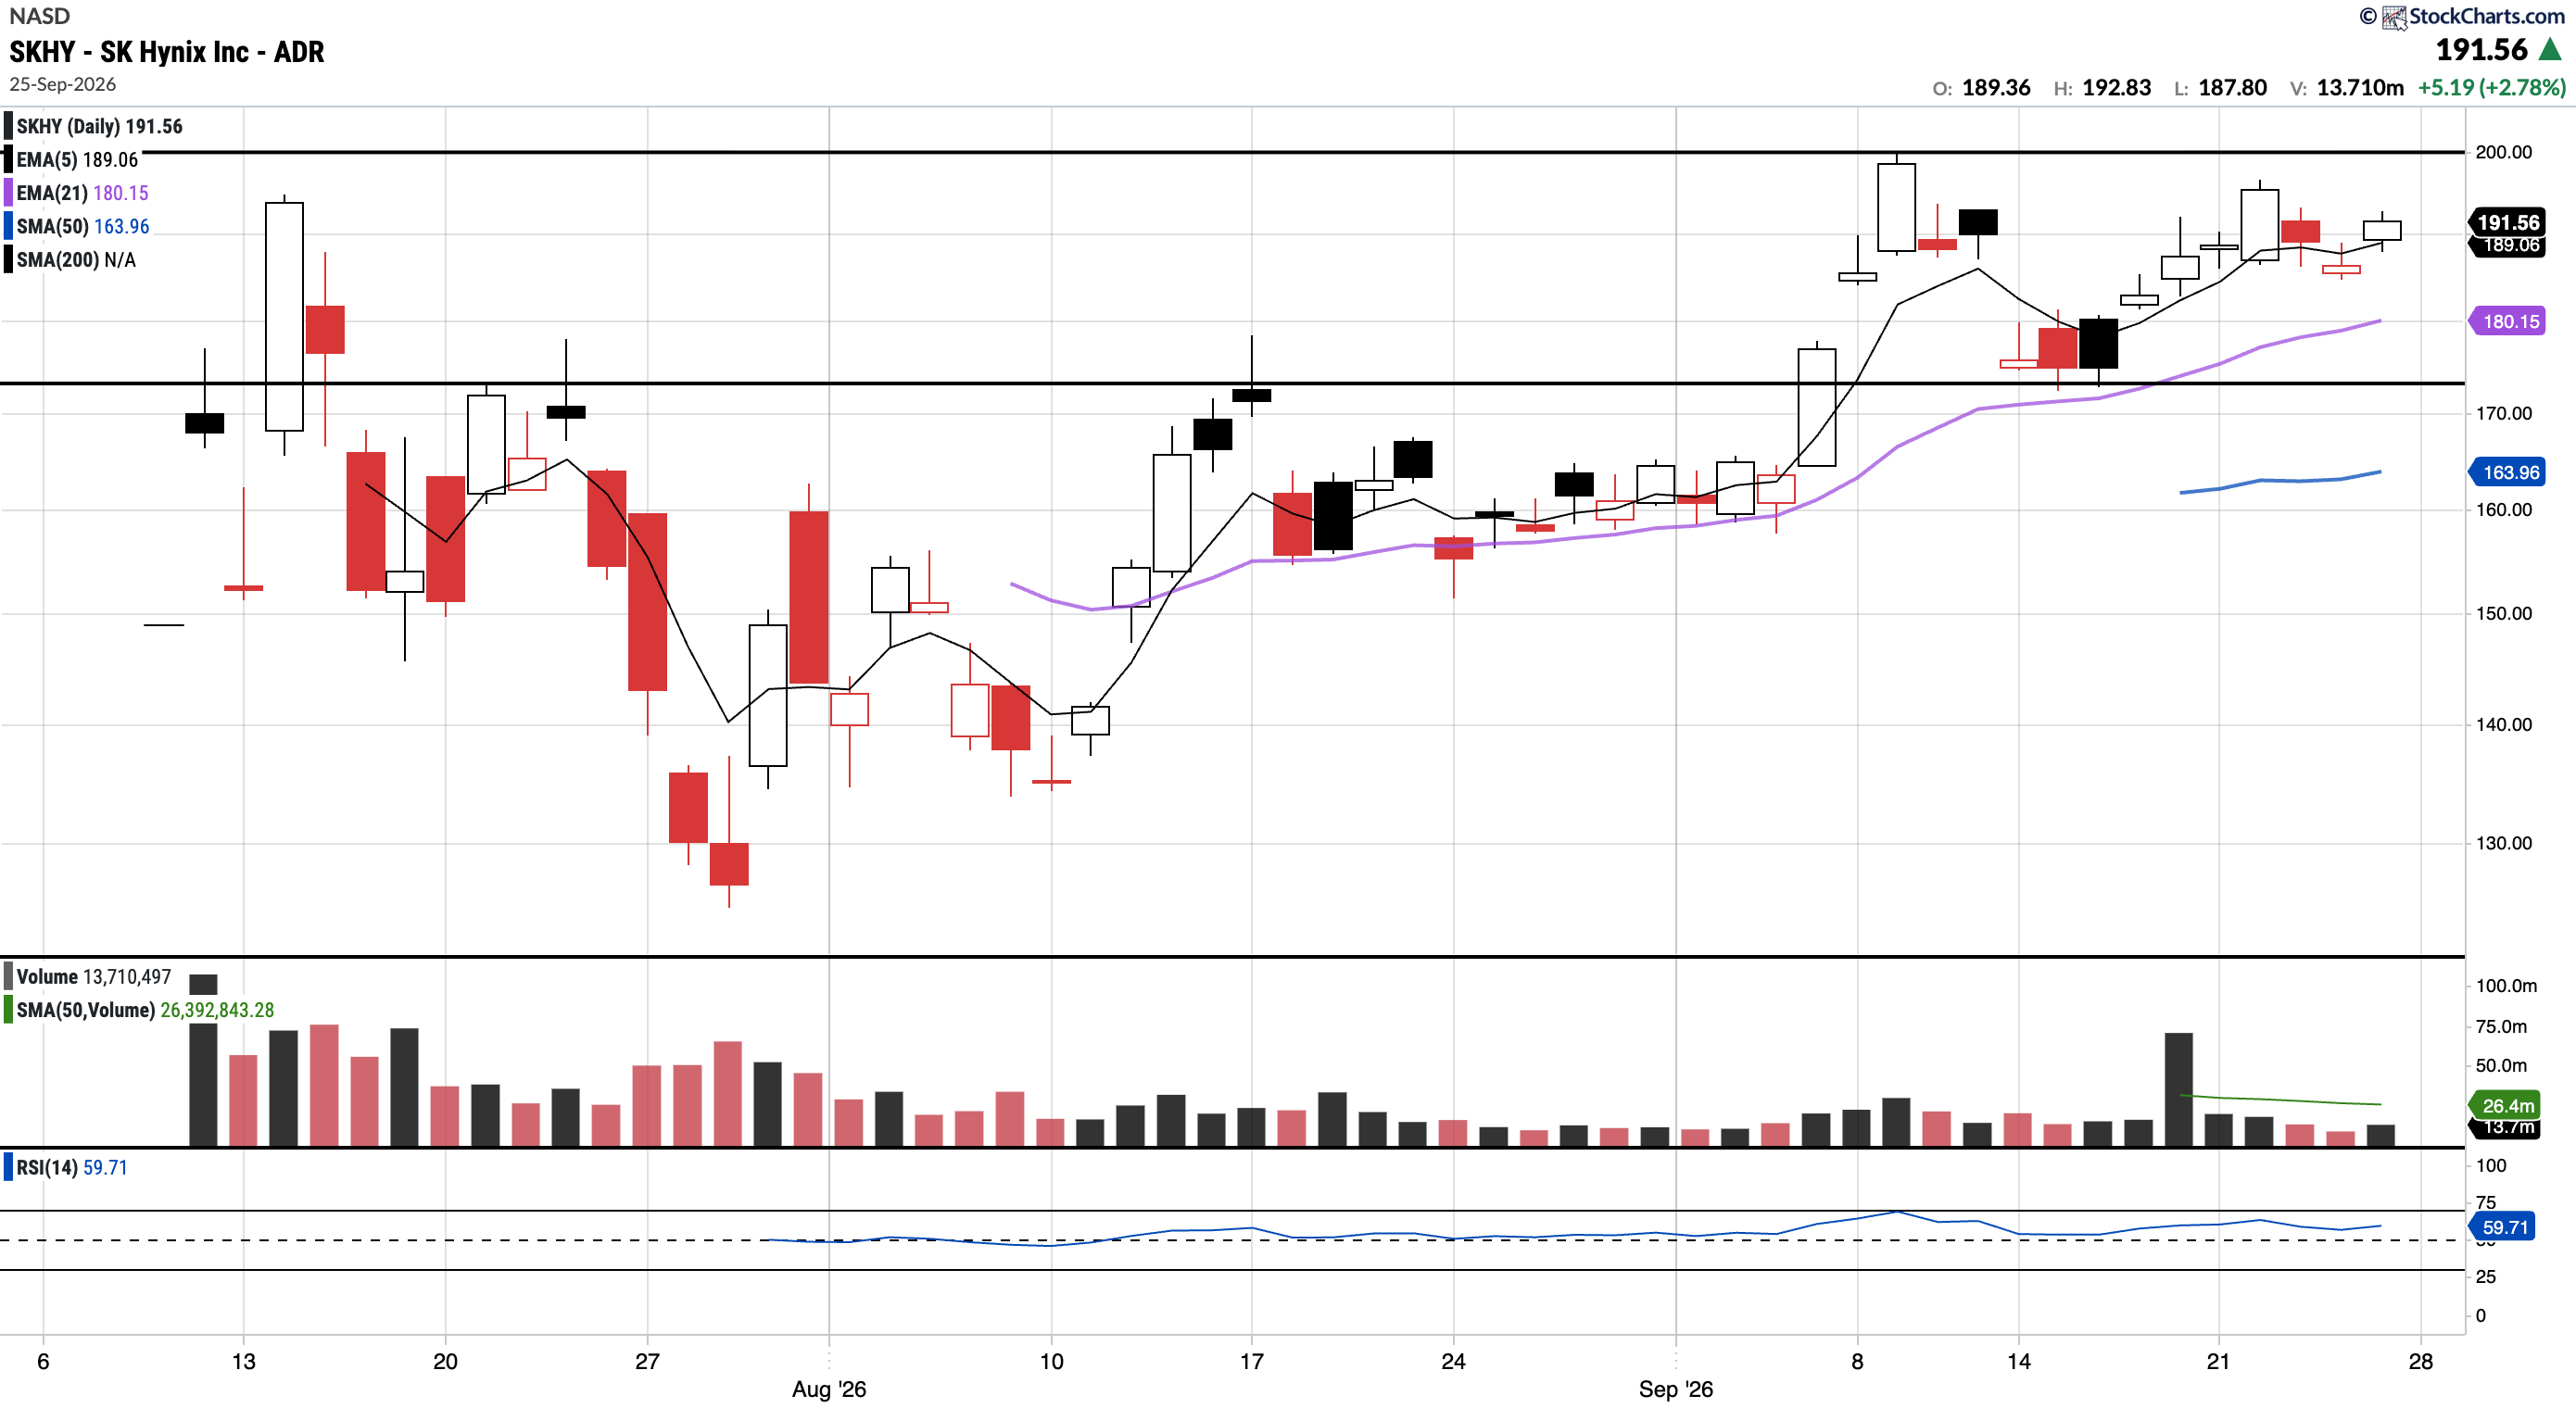
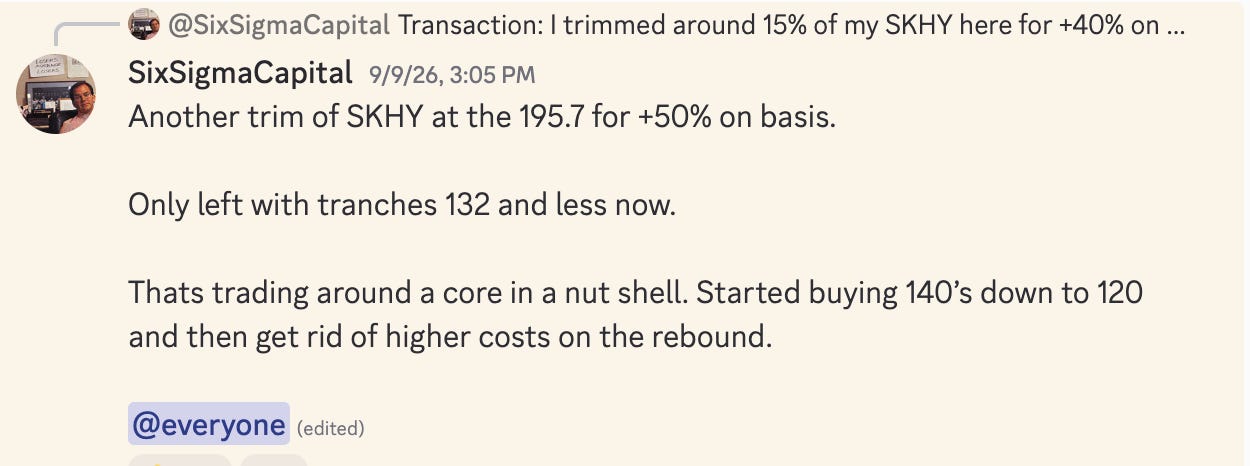
We purchased this name in the July pullback and have been trimming in the mid to high 190’s:
GOOGL (Currently Long)
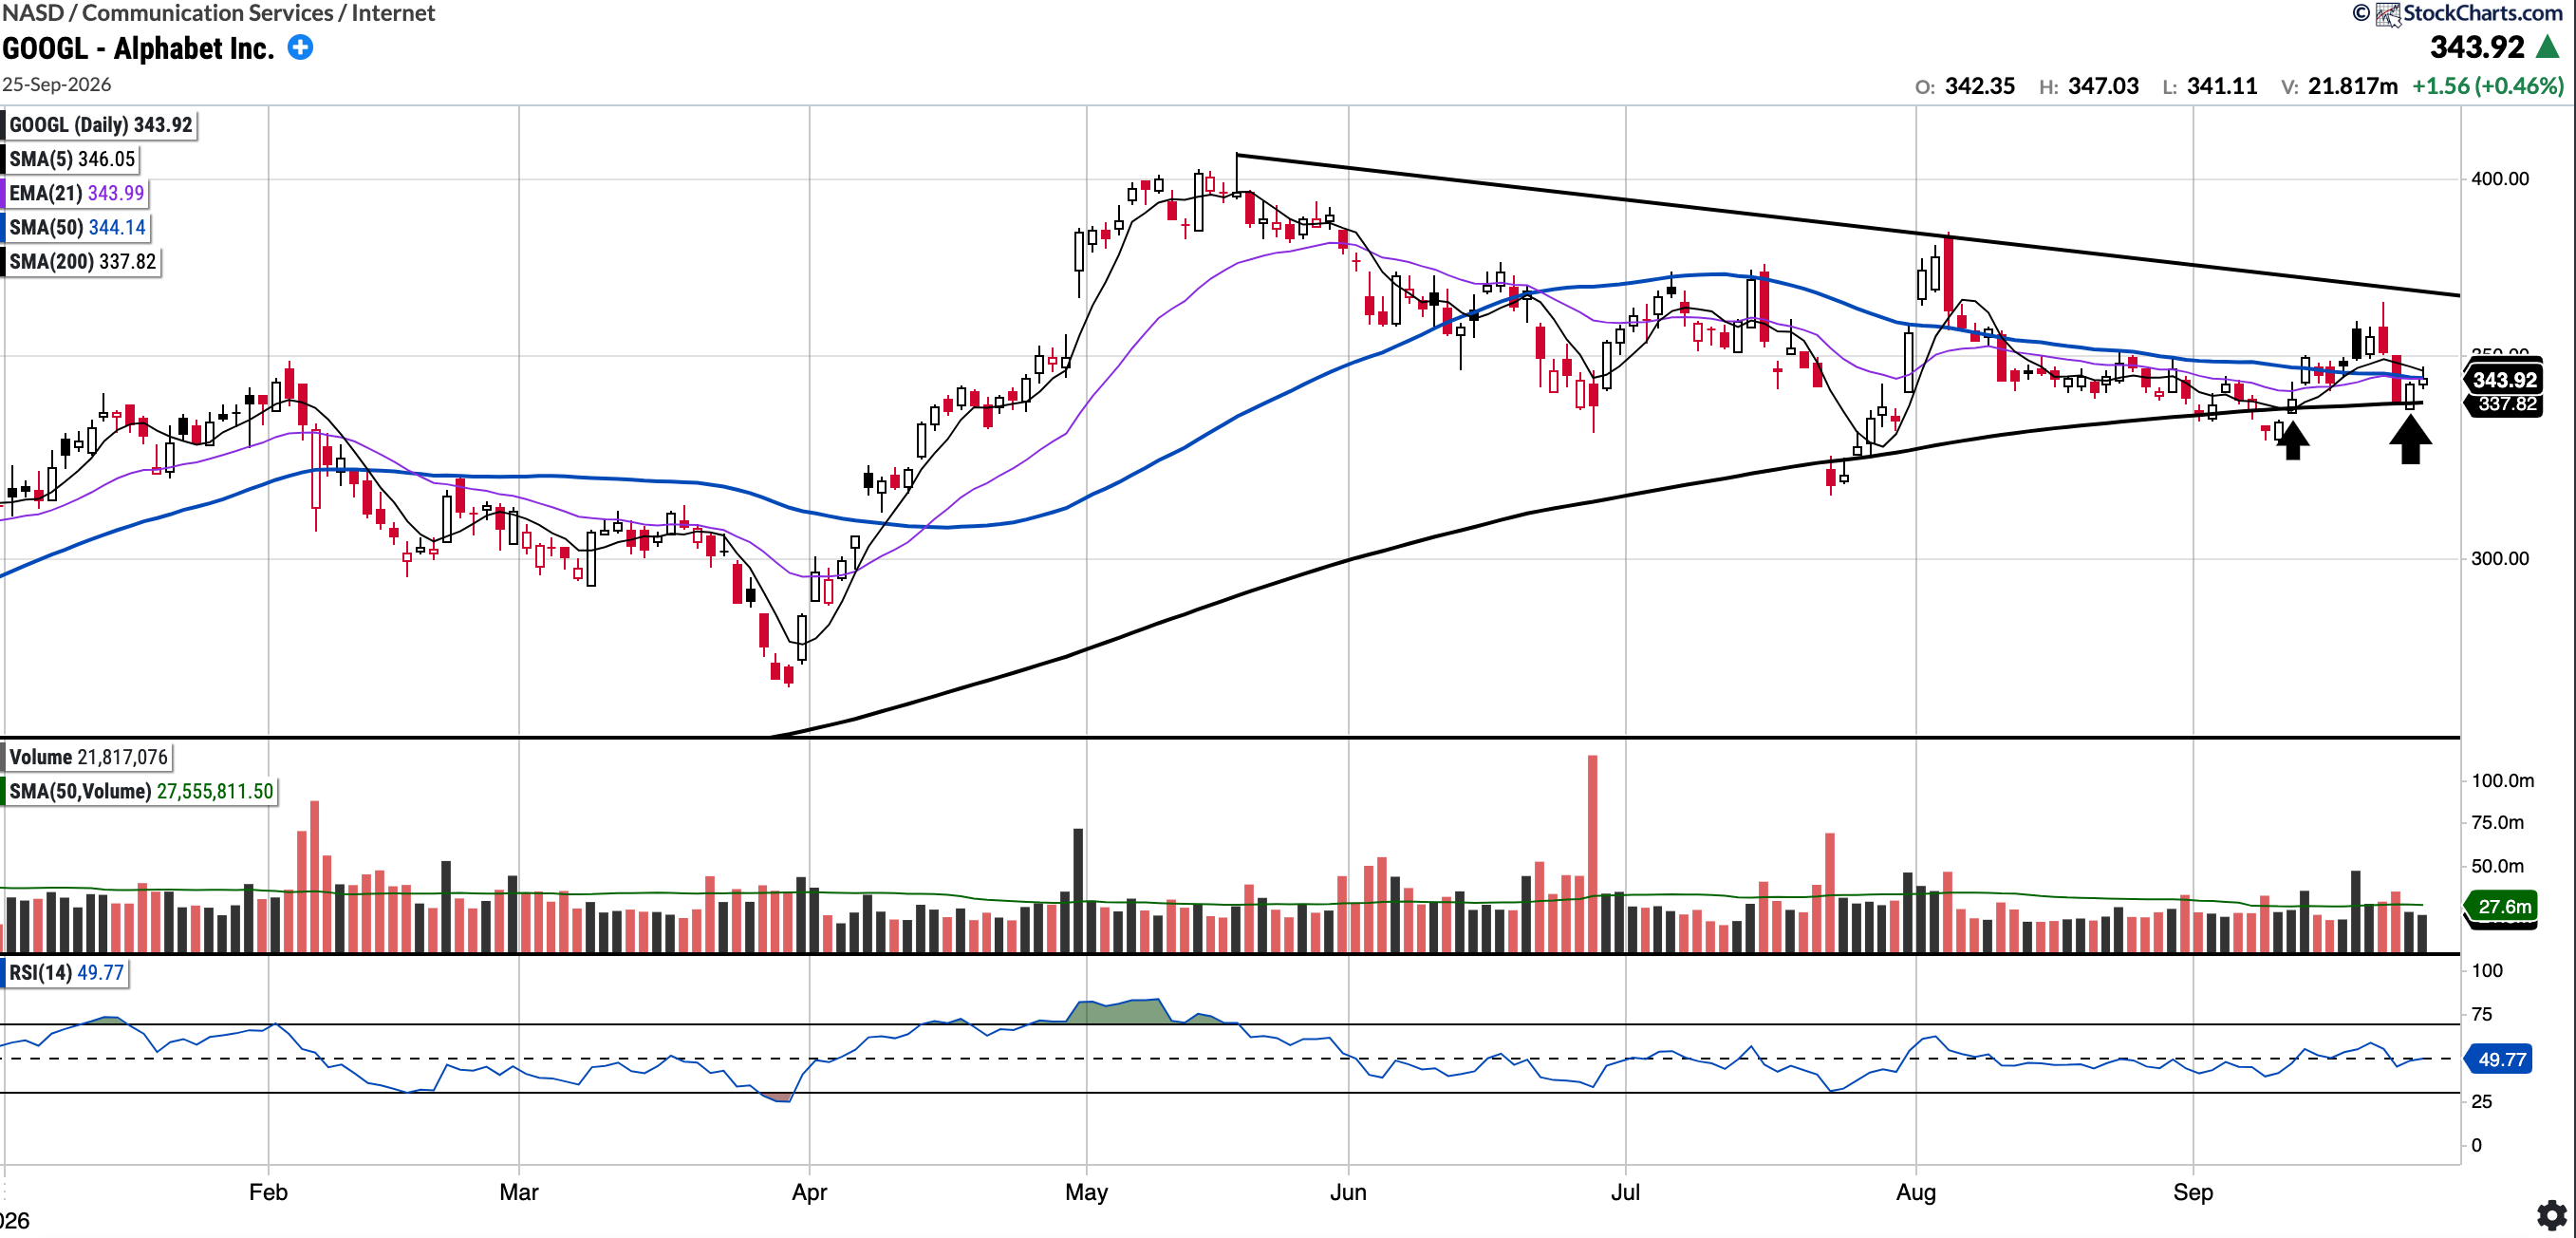
Currently trades at $343.92, 0.06% below the 50SMA and 1.81% above the 200SMA.
RSI 49.77
9.34% YTD
GOOGL successfully retested and held the 200-day SMA, a level I have flagged as key support over the past few weeks. The stock staged a brief rally to $365 to test the descending trendline before pulling back. While holding the 200-day moving average is a positive sign, bulls now need to reclaim the overhead moving averages and break out above the descending trendline.
META (Currently Long)
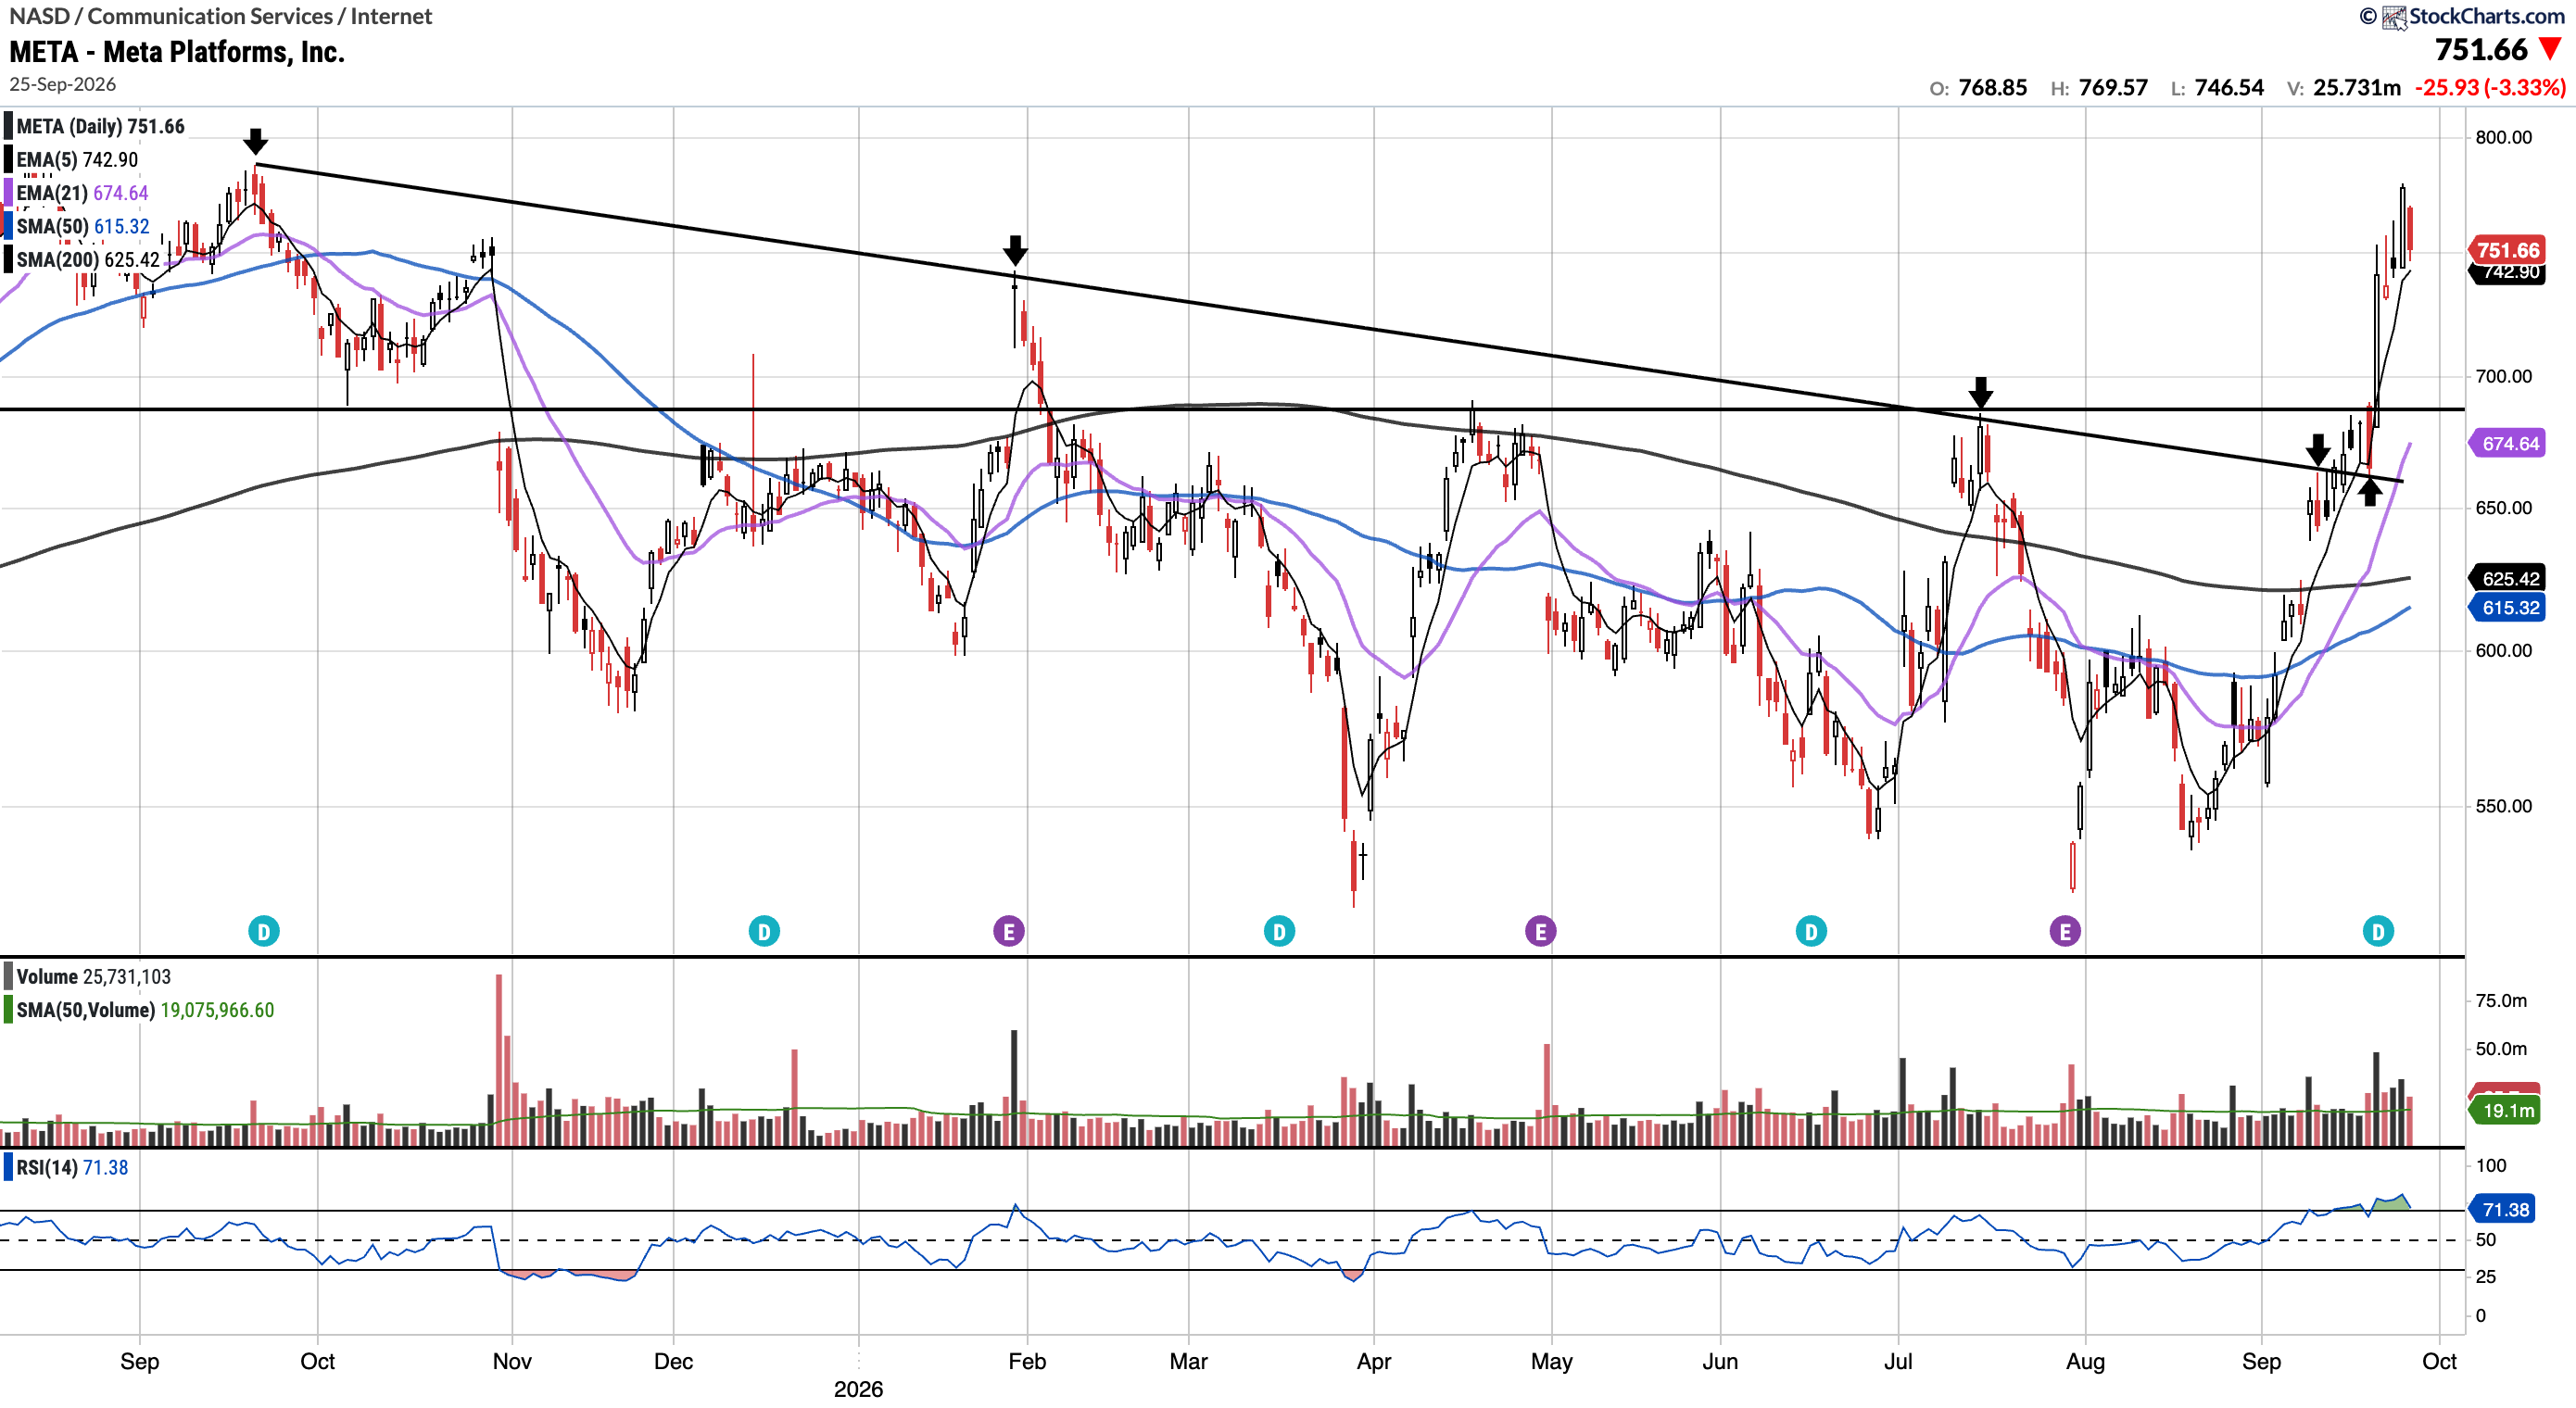
Currently trades at $751.66, 22.16% above the 50SMA and 20.18% above the 200SMA.
RSI 71.38
15.86% YTD
In last week’s writeup, I noted that META had broken decisively above its yearlong descending trendline into $690 resistance before completing a retest.
On Monday, price rallied sharply off that level to clear $690. META came close to a new all-time high but subsequently pulled back a few percent, and will likely consolidate here before making another attempt at highs.
CRDO (Currently Long)
Currently trades at $210.97, 0.48% above the 50SMA and 19.75% above the 200SMA.
RSI 57.86
47.30% YTD
CRDO has rallied sharply off its early September low, reclaiming its 50-SMA to close out the week. With price now above all of its key moving averages, bulls will want the 50-SMA to hold as support for any hope of continuation to the upside.
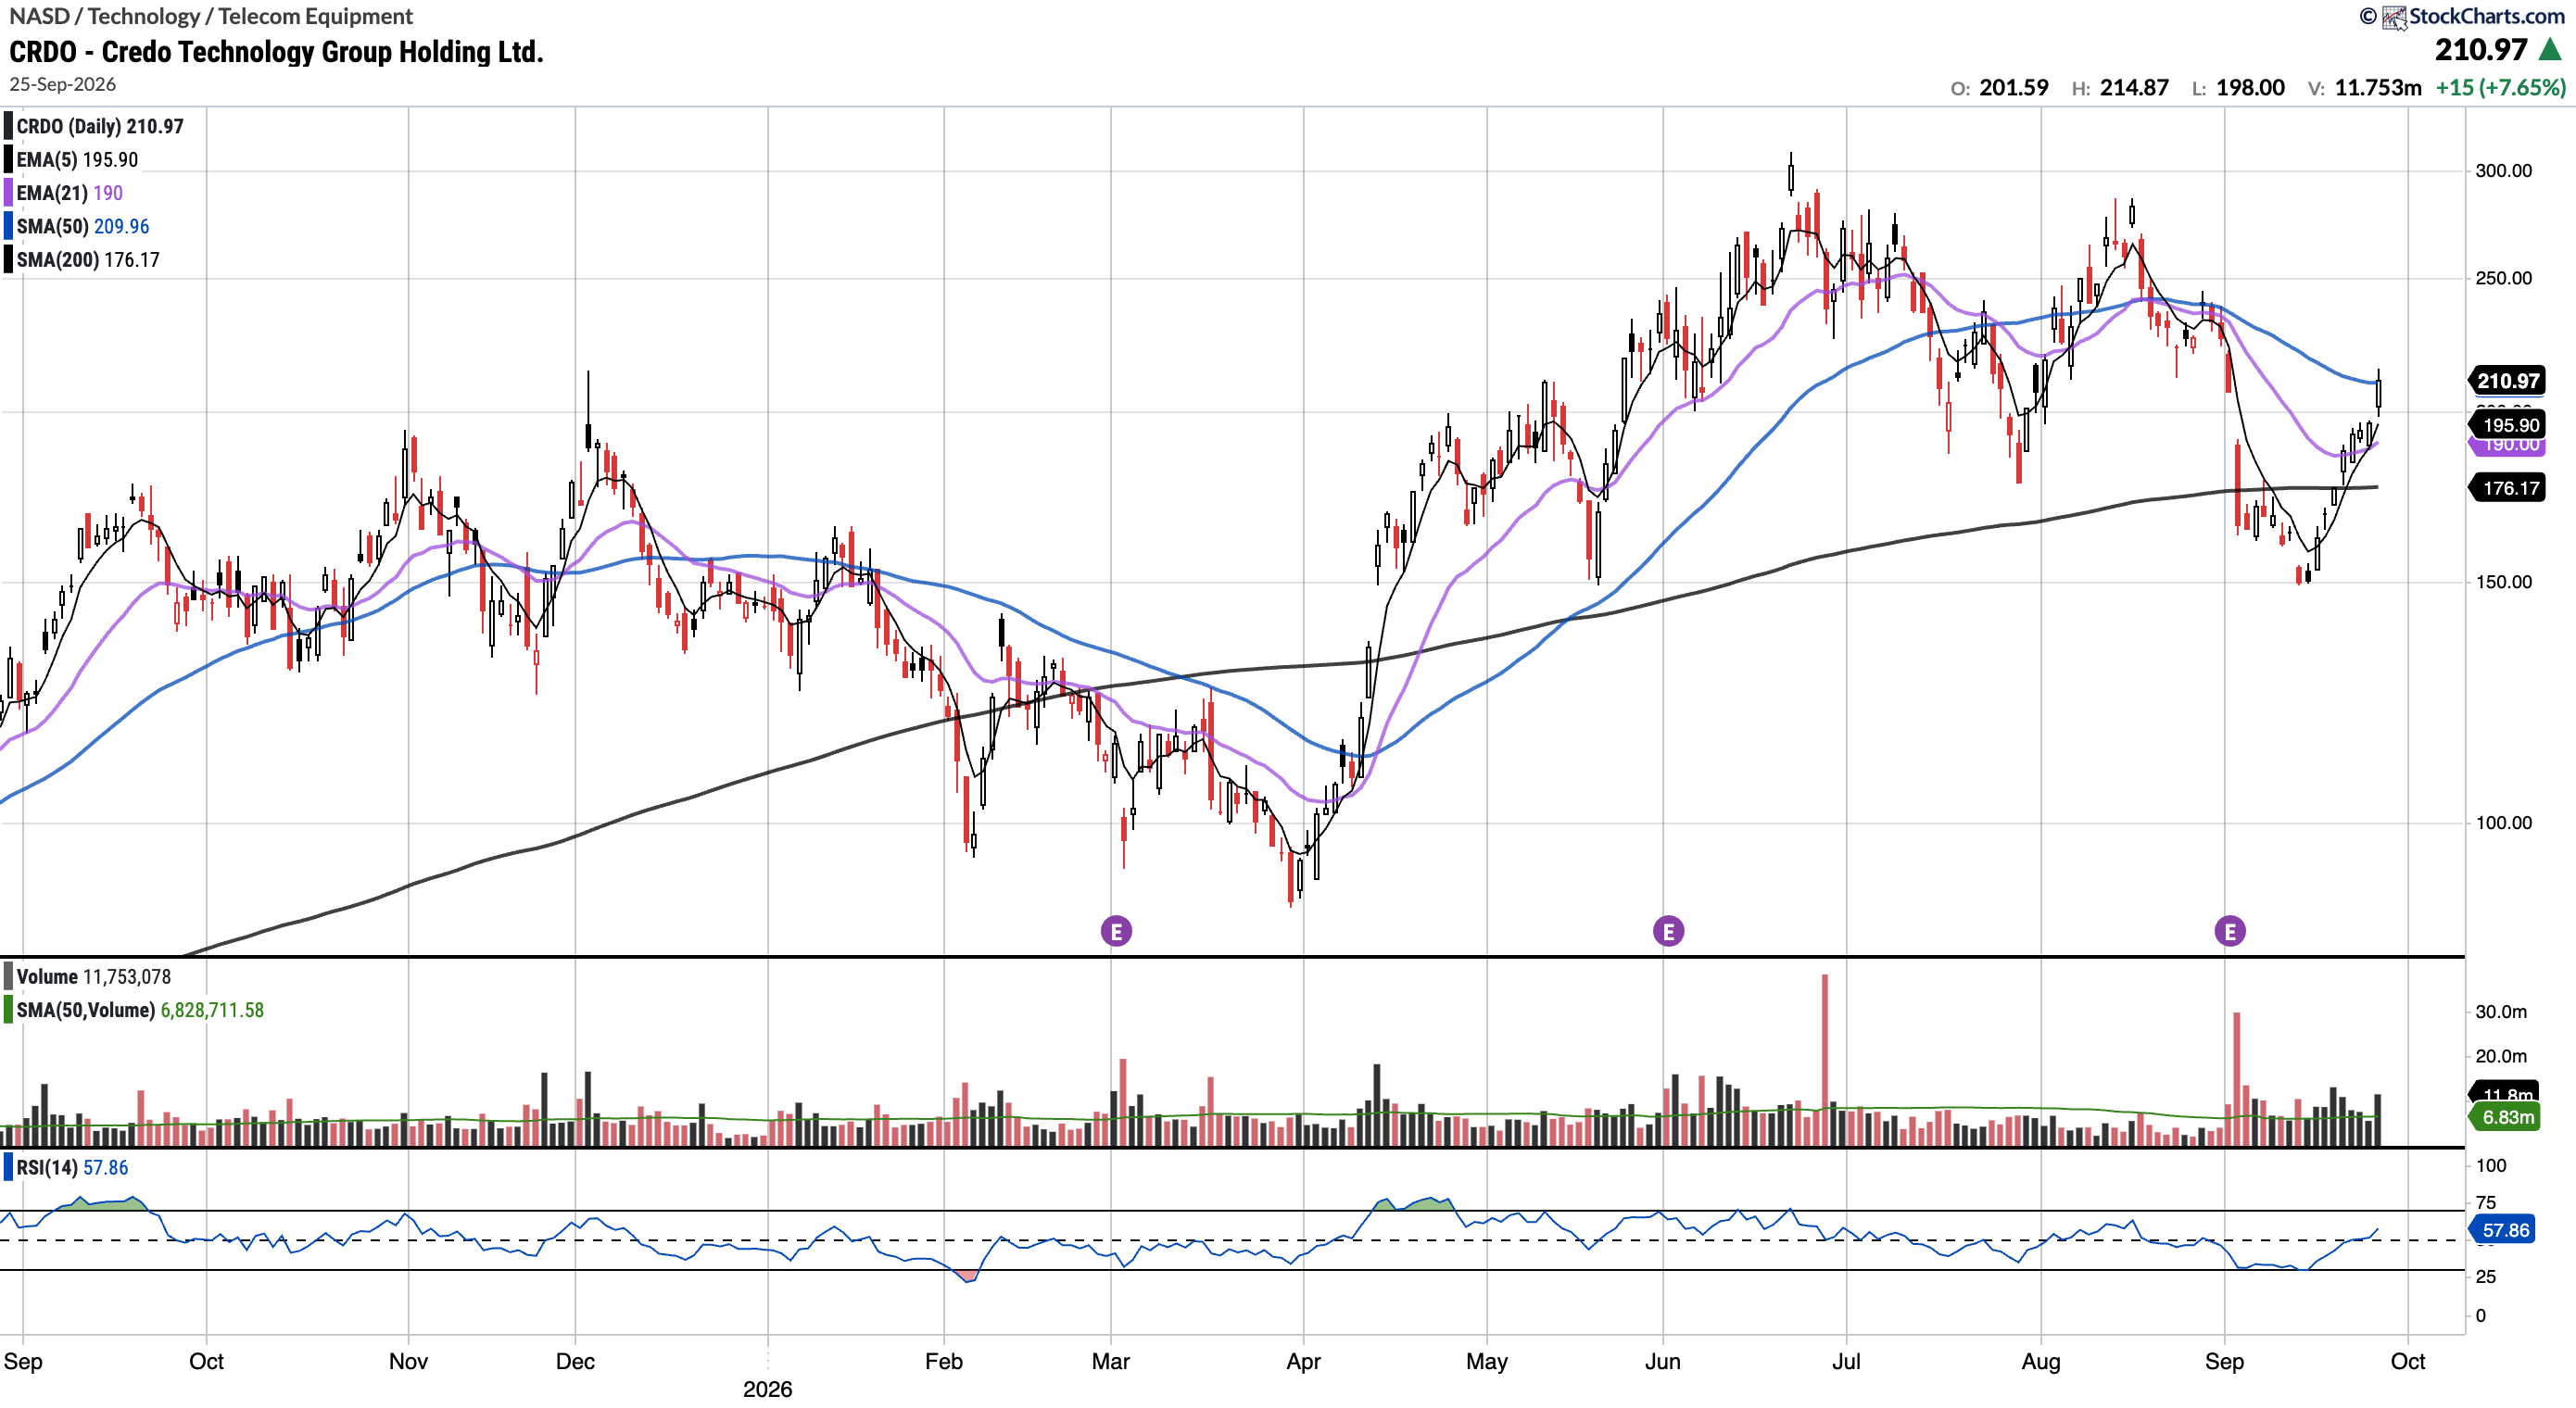
SixSigmaCapital de-risked some of our position into strength this week.
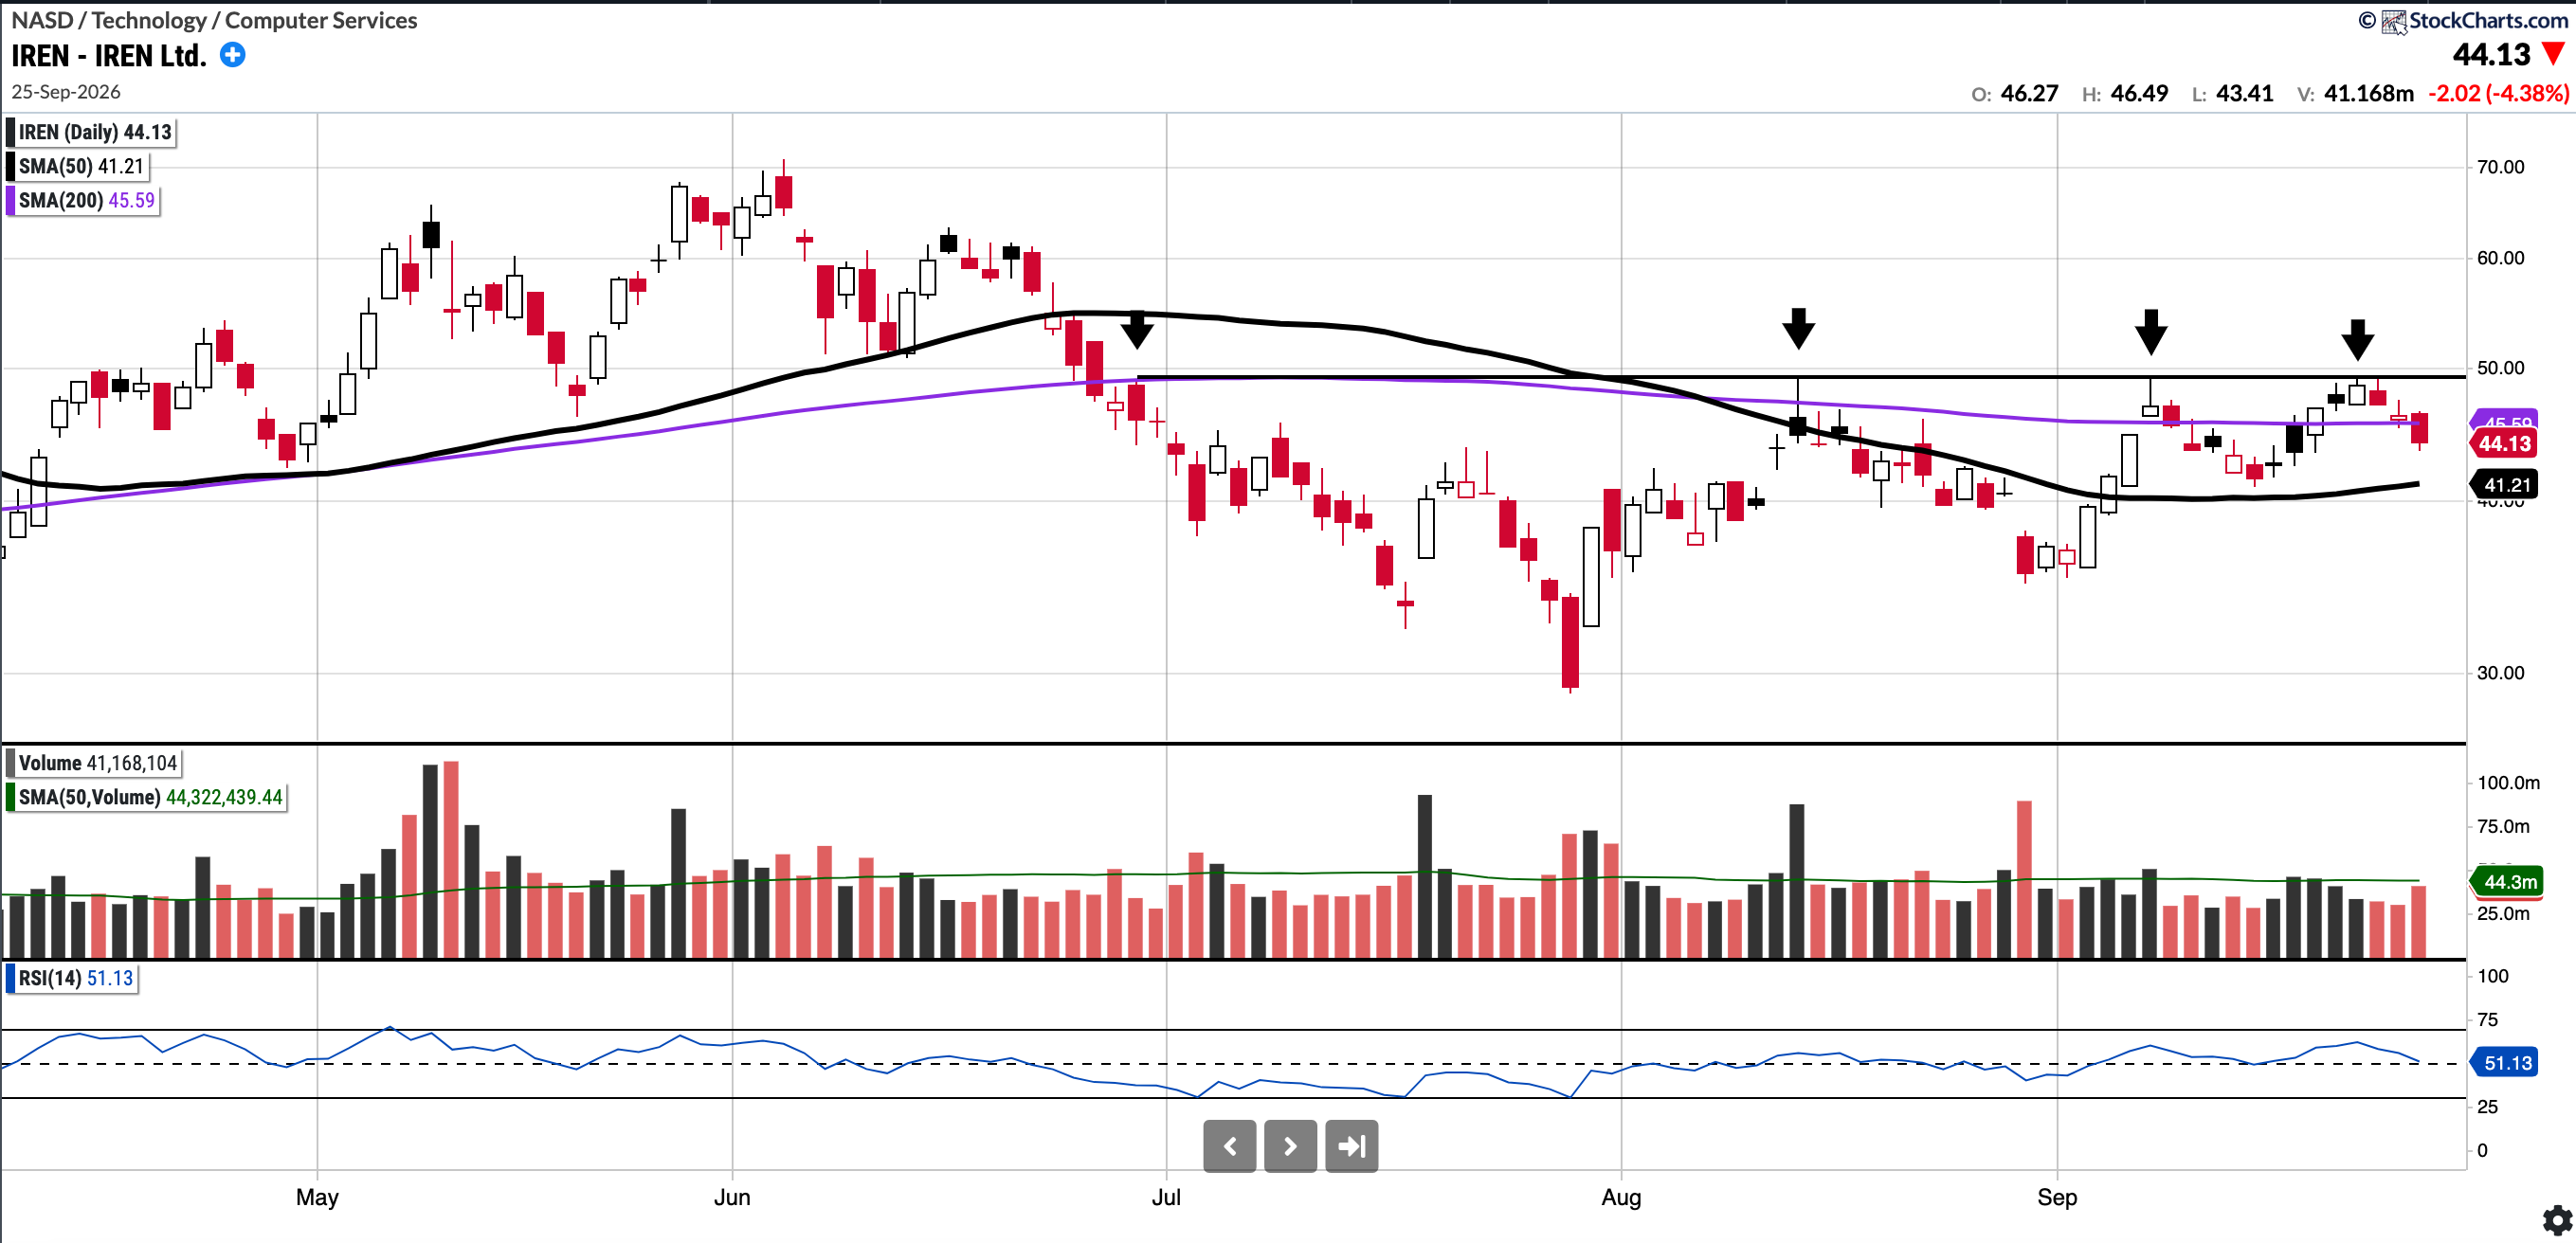
IREN (Currently Long)
Currently trades at $44.12, 7.08% above the 50SMA and 3.22% below the 200SMA.
RSI 51.13
3.34% YTD
Since late July, IREN has repeatedly found resistance at the $49 mark. It closes out the week just below the 200 dayPrice now sits just below its 200SMA (~$45.59), which is the more immediate resistance before the $49 level is back into focus. A break of the 200SMA and the $49 level would likely see price rally into $60s.
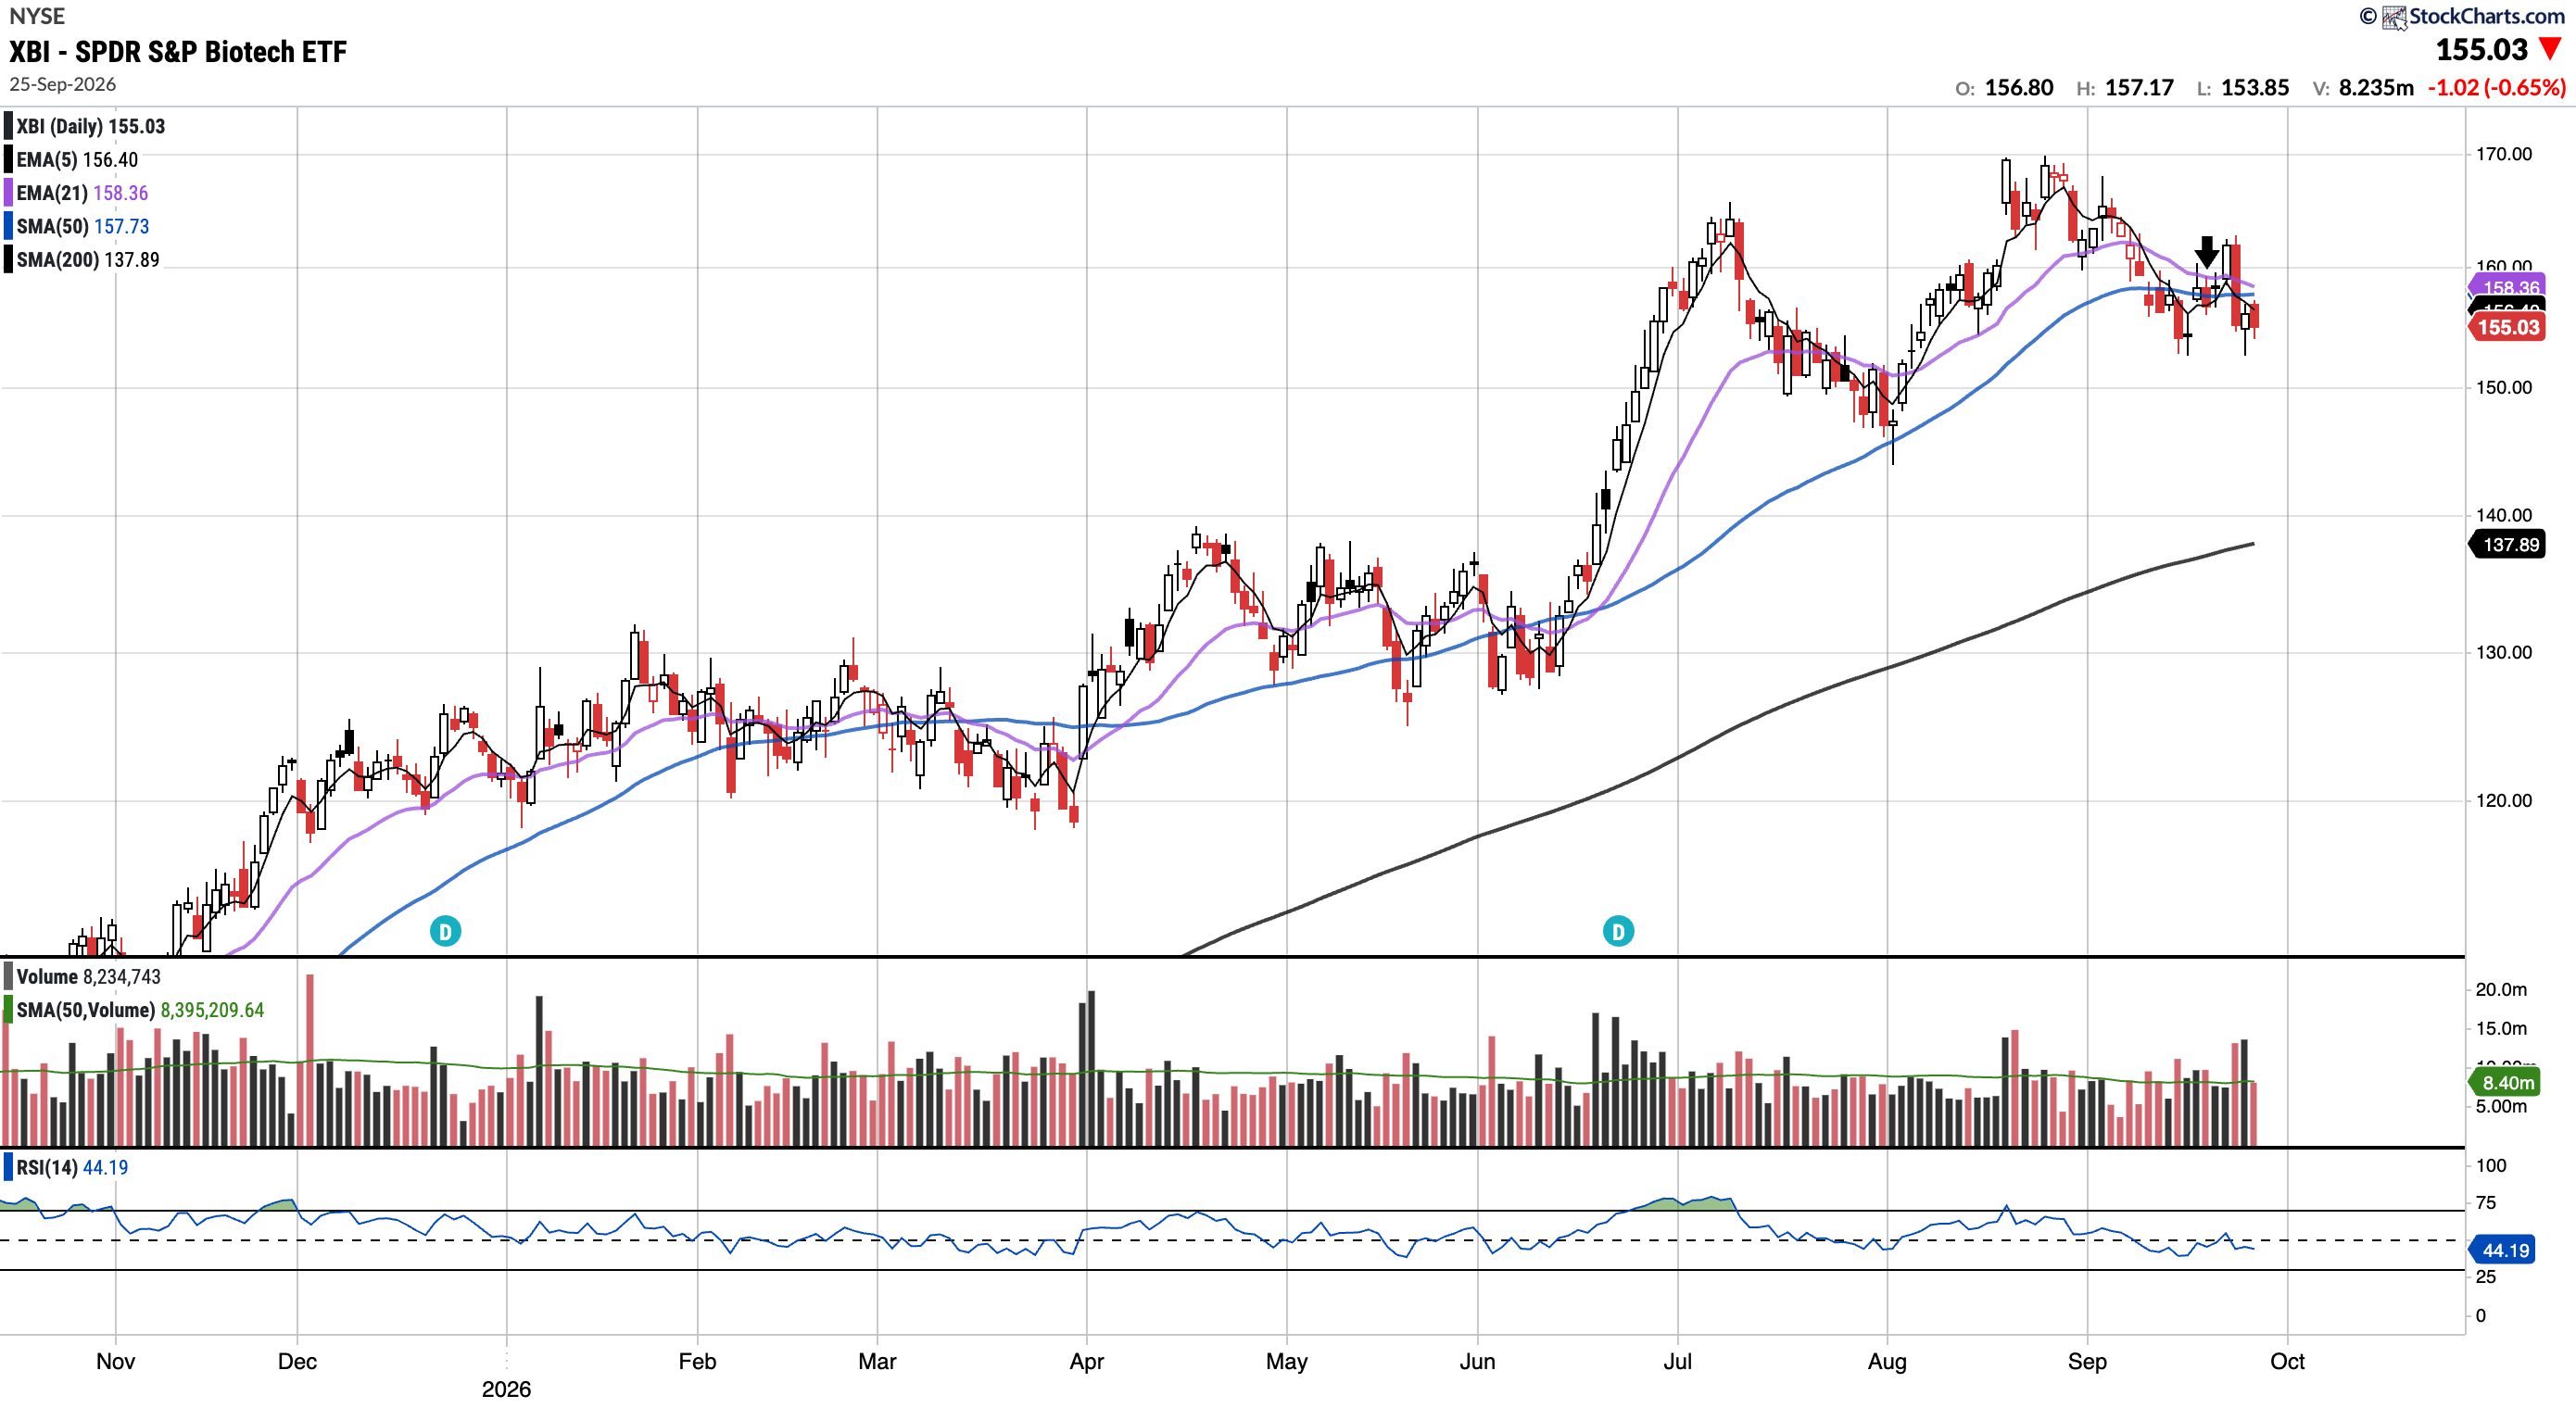
XBI
Currently trades at $155.03, 1.71% below the 50SMA and 12.43% above the 200SMA.
RSI 44.19
27.70% YTD
A rejection of the $160–162 level this week has given way to a pullback. Price fell below its 21EMA and 50SMA, and bulls will need a reclaim of those moving averages to keep the longer-term trend intact.
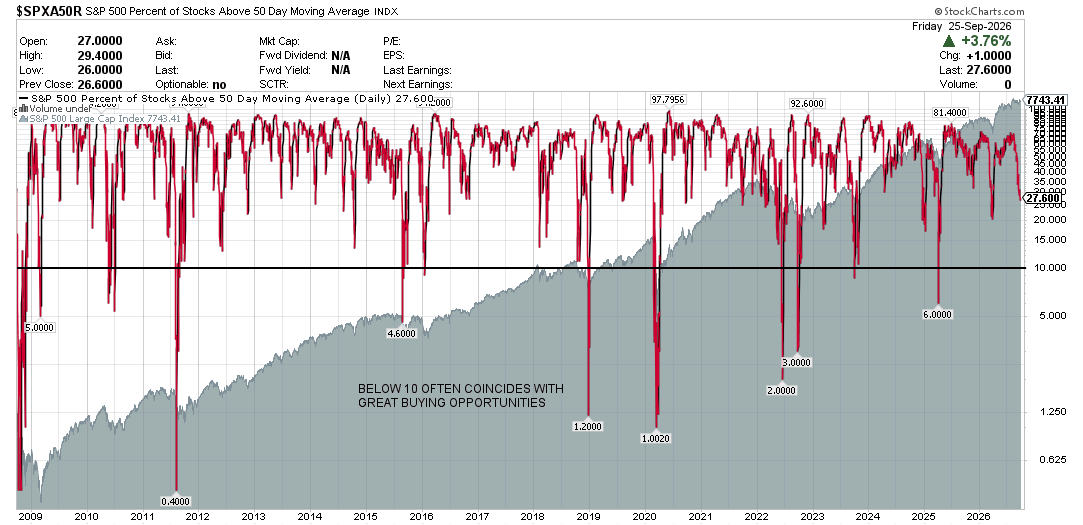
S&P 500 Percentage of Stocks Above the 50 Day Moving Average: Currently 27.60%
Breadth barely decreased this week, with the percentage of stocks above the 50-day moving average now at 27.60% compared to 28.80% last week. 27% is poor breadth and shows a narrow market.
Notable portfolio changes in previous week (all updated live in subscriber channels):