
Preview of the Week Ahead
W/C Feb 9, 2026

Hope you all are having a good weekend. Below we will be previewing the upcoming week and providing a portfolio update as usual.
Format for what is covered in this weekly preview:
A look at the indices
Key upcoming economic events
Upcoming earnings reports
Charts
Notable portfolio changes from the previous week
Current Portfolio Holdings (Position size, cost basis, and commentary on each holding regarding the intended holding period and any planned activity)
Closing Thoughts
I highly recommend checking out the latest Monthly Portfolio and Performance Update (TWR +400% since Jan ‘23) below
Monthly Portfolio Update: +400% since inception of SSC

I hope you are well. Below, we provide market commentary and an in-depth portfolio update.
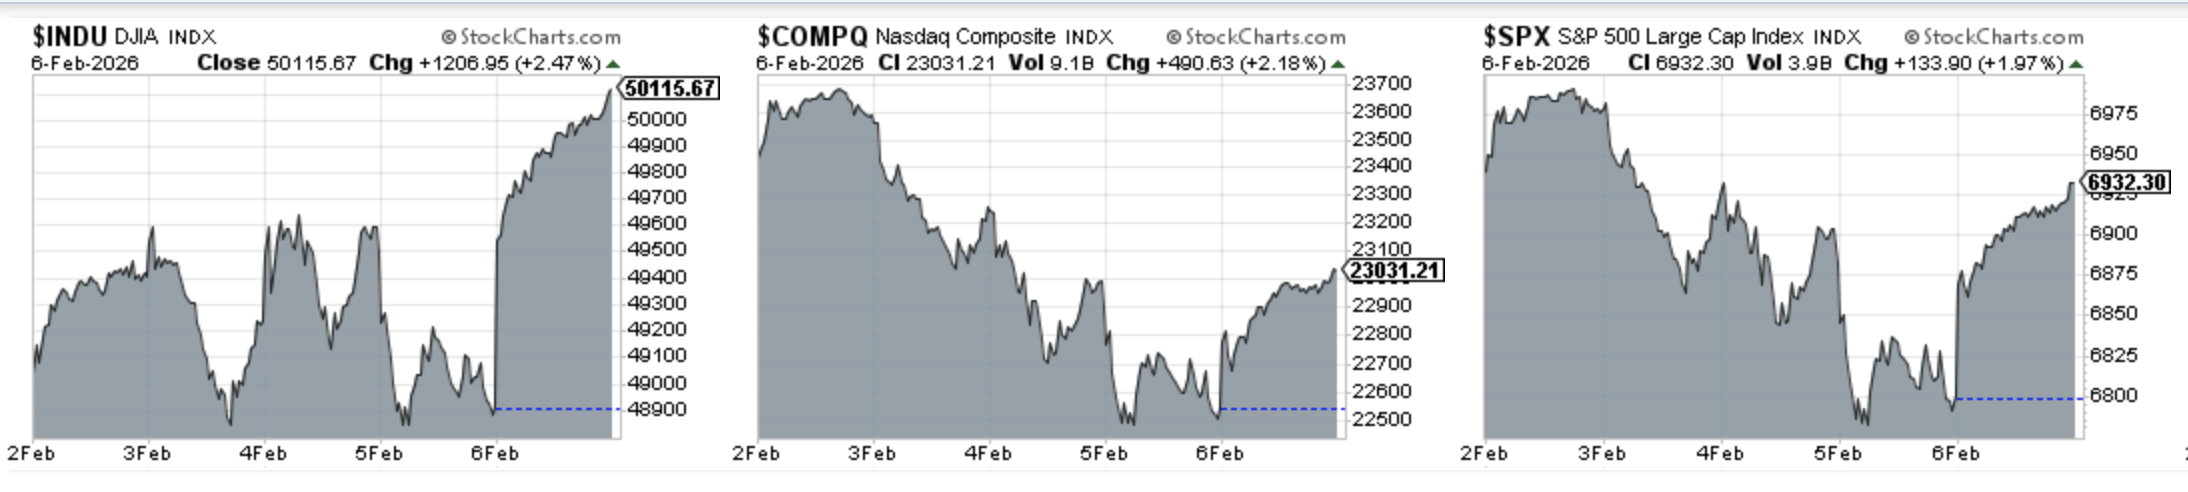
Indices
Dow Jones advanced 2.28% in the last week
S&P 500 declined 0.01% in the last week
Nasdaq Composite declined 1.58% in the last week
IWM advanced1.91% in the last week
Key upcoming economic events:
Monday, Feb 9
Consumer Inflation Expectations (Jan)
Tuesday, Feb 10
U.S. Retail Sales (Dec)
Employment Cost Index (Q4 2025)
Business Inventories (Nov)
Wednesday, Feb 11
The Jobs Report / Non-Farm Payrolls (Jan). Was originally due Feb 6.
10-Year Treasury Note Auction
Thursday, Feb 12
Weekly Initial Jobless Claims
Existing Home Sales (Jan)
Friday, Feb 13
Consumer Price Index (Jan)
Upcoming Earnings
The schedule this week is jam packed but thankfully I only have a couple of portfolio companies reporting! Below is the infographic by Earnings Whispers:

Charts
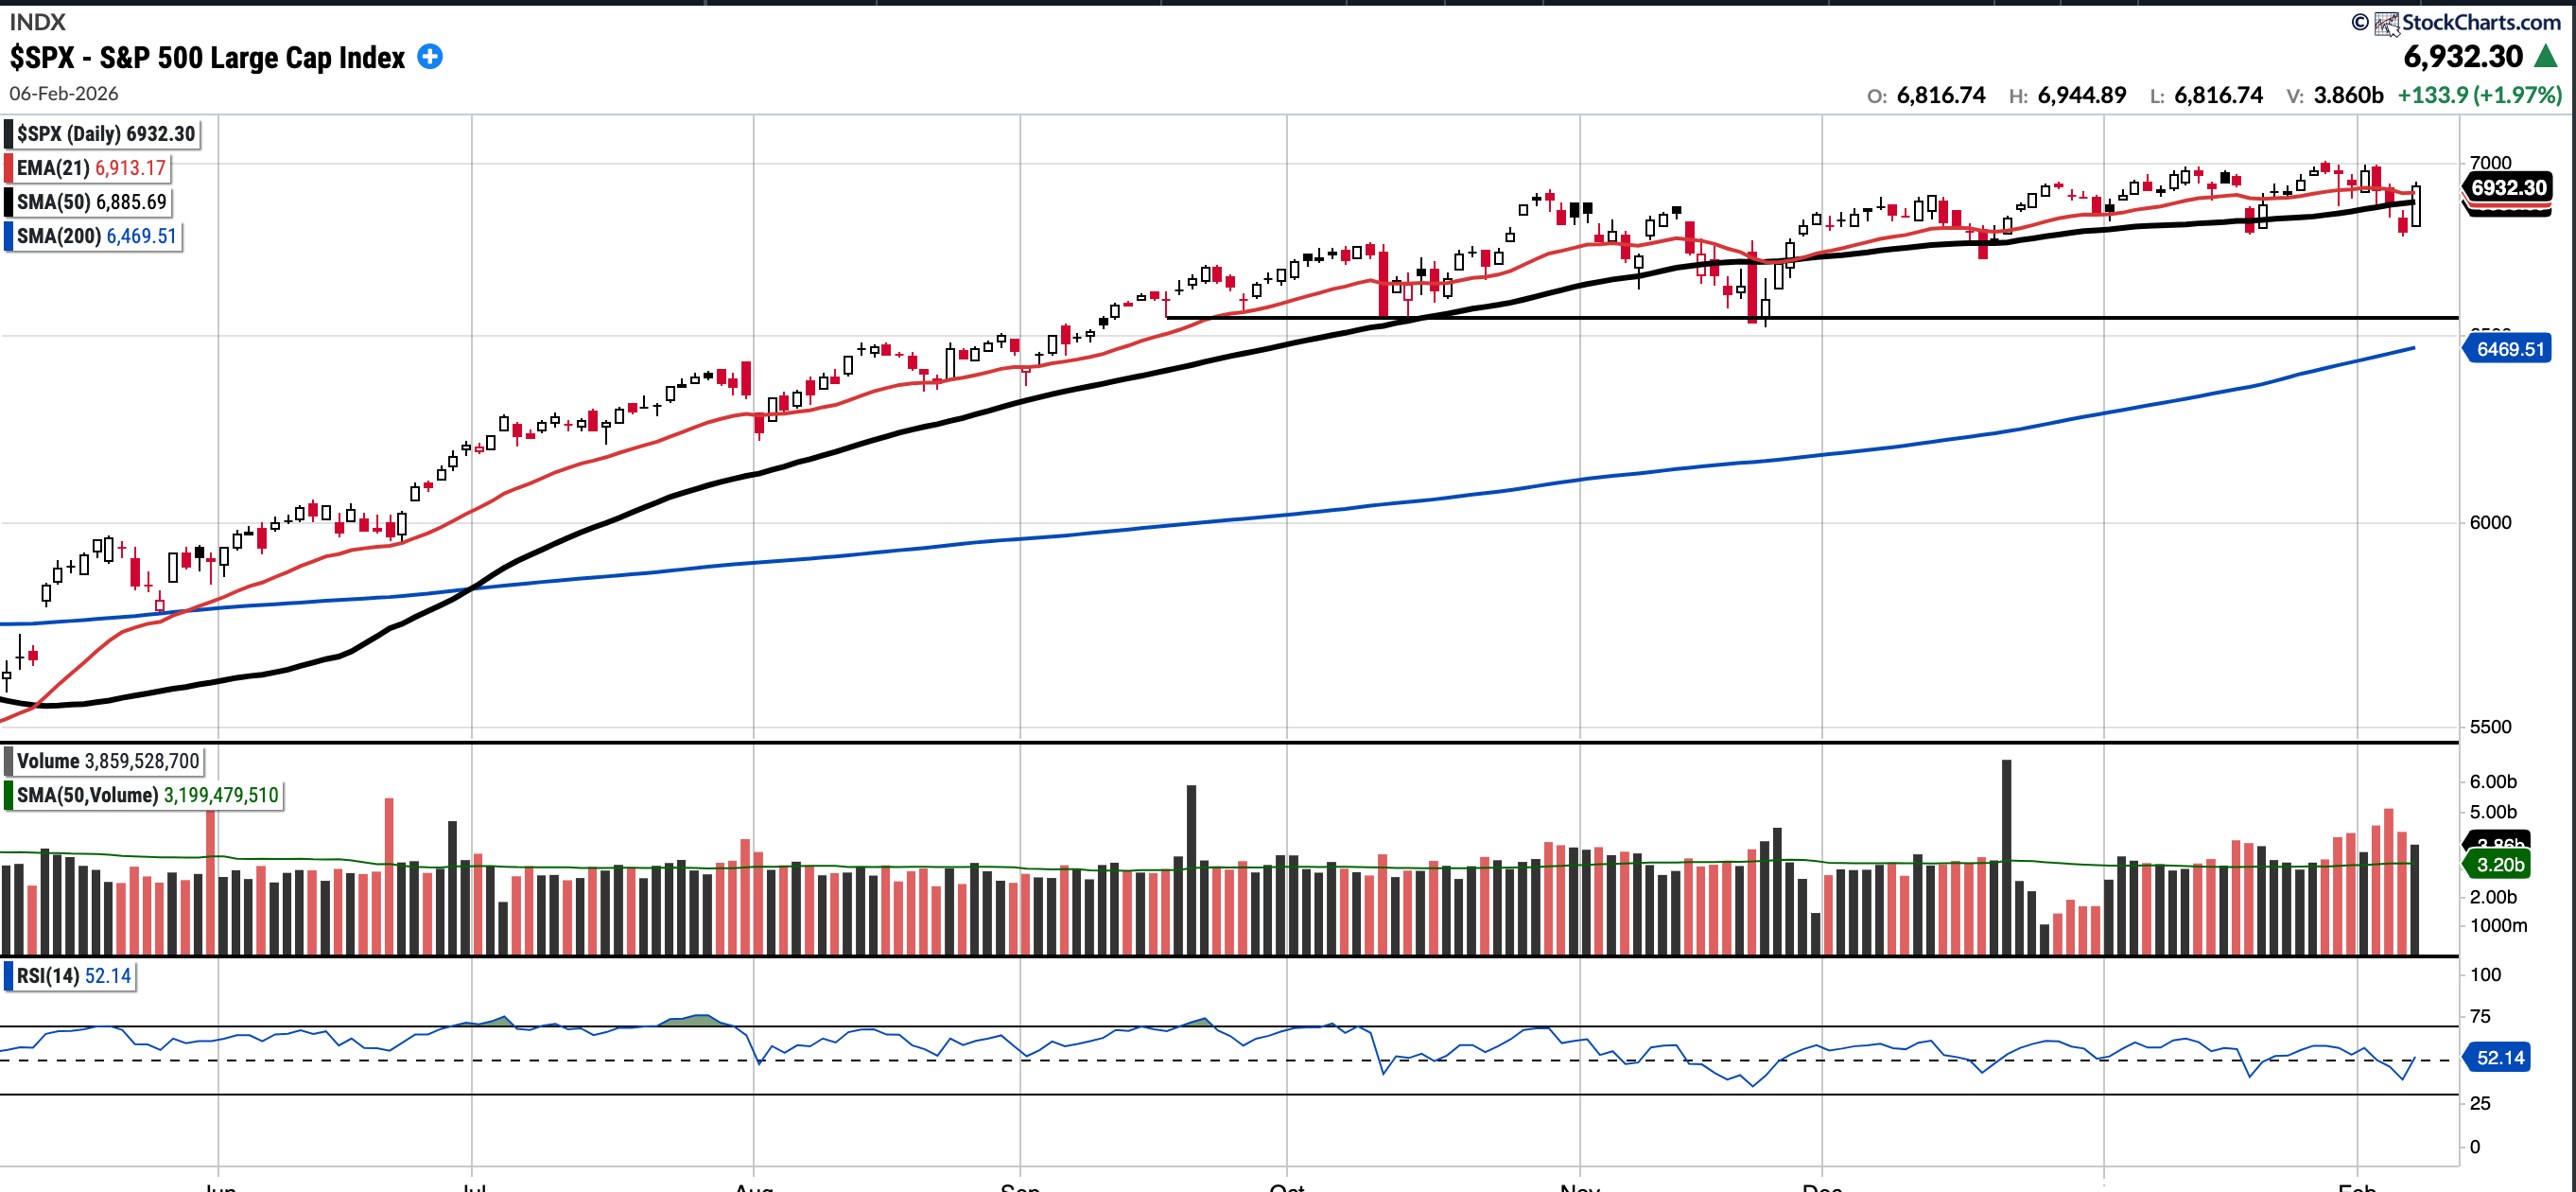
SPX
Currently trades at 6932.30, 0.68% above a rising 50SMA and 7.15% above the 200SMA.
RSI 52.14
+1.08% YTD
Distribution days in the last week: 2
Whilst the S&P 500 ended the week above all key MA’s, there was significant turbulence. There was at least 2 distribution days and on Thursday we also sold off on above average volume.
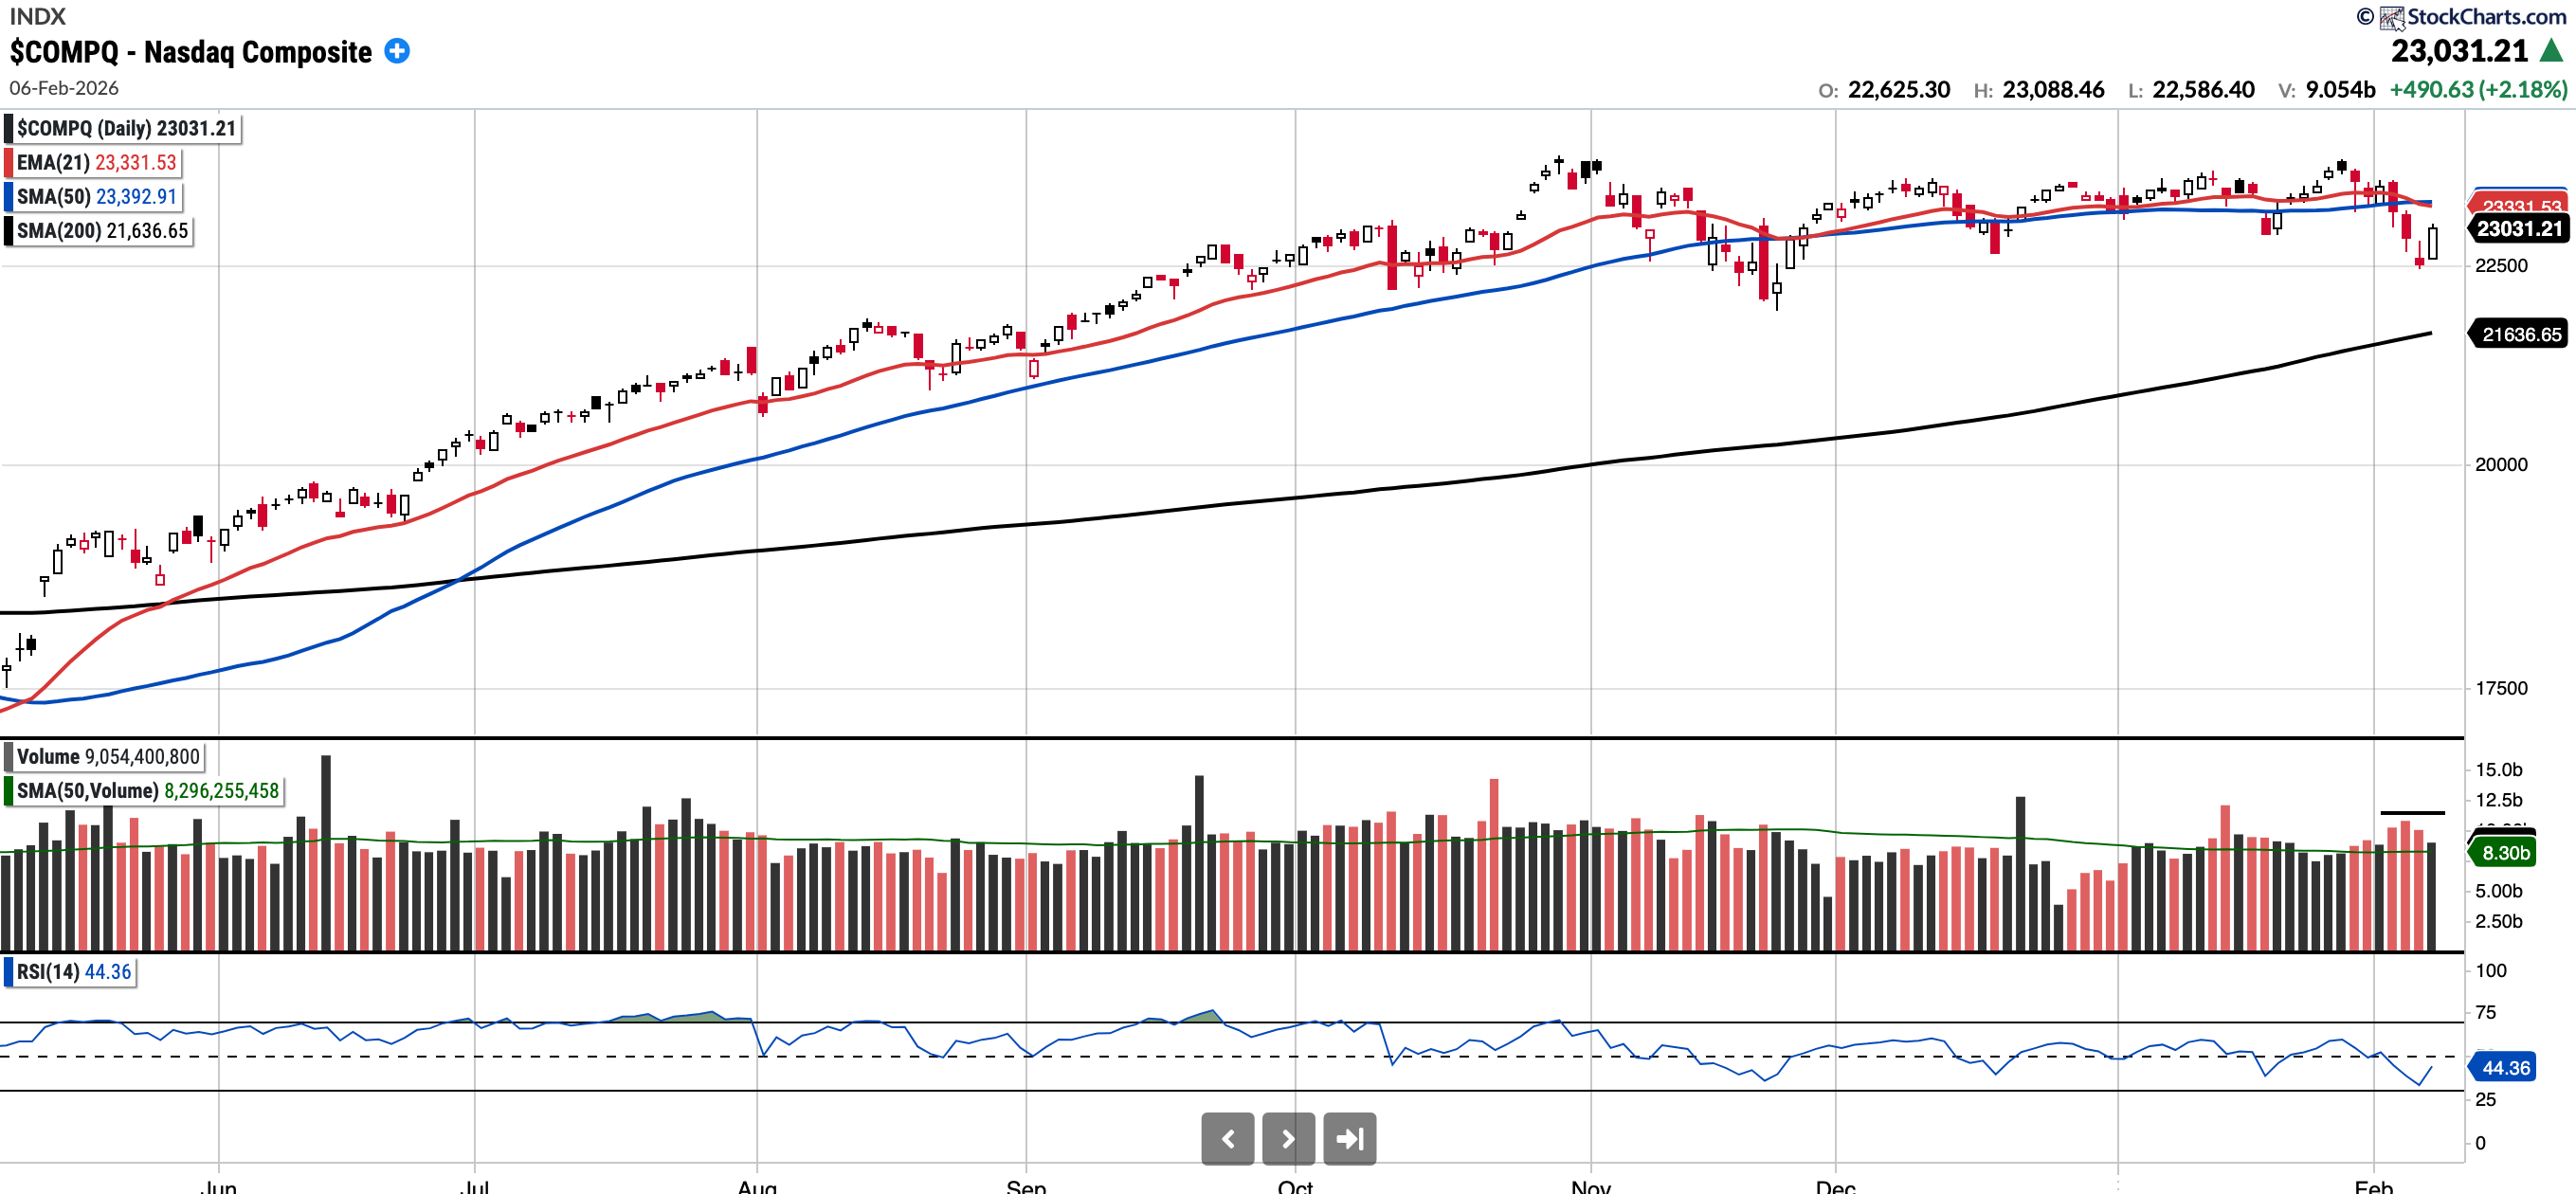
COMPQ
Currently trades at 23,031.21, 1.55% below a flat 50SMA and 6.45% above the 200SMA.
RSI 44.36
-0.88% YTD
Distribution days in the last week: 1
The Nasdaq Composite had a very volatile week, ending the week below both the EMA 21 and SMA 50. The Index sold off >1% on each of Tuesday, Wednesday and Thursday before rebounding 2.18% on Friday. This wide and loose price action is not ideal or constructive.
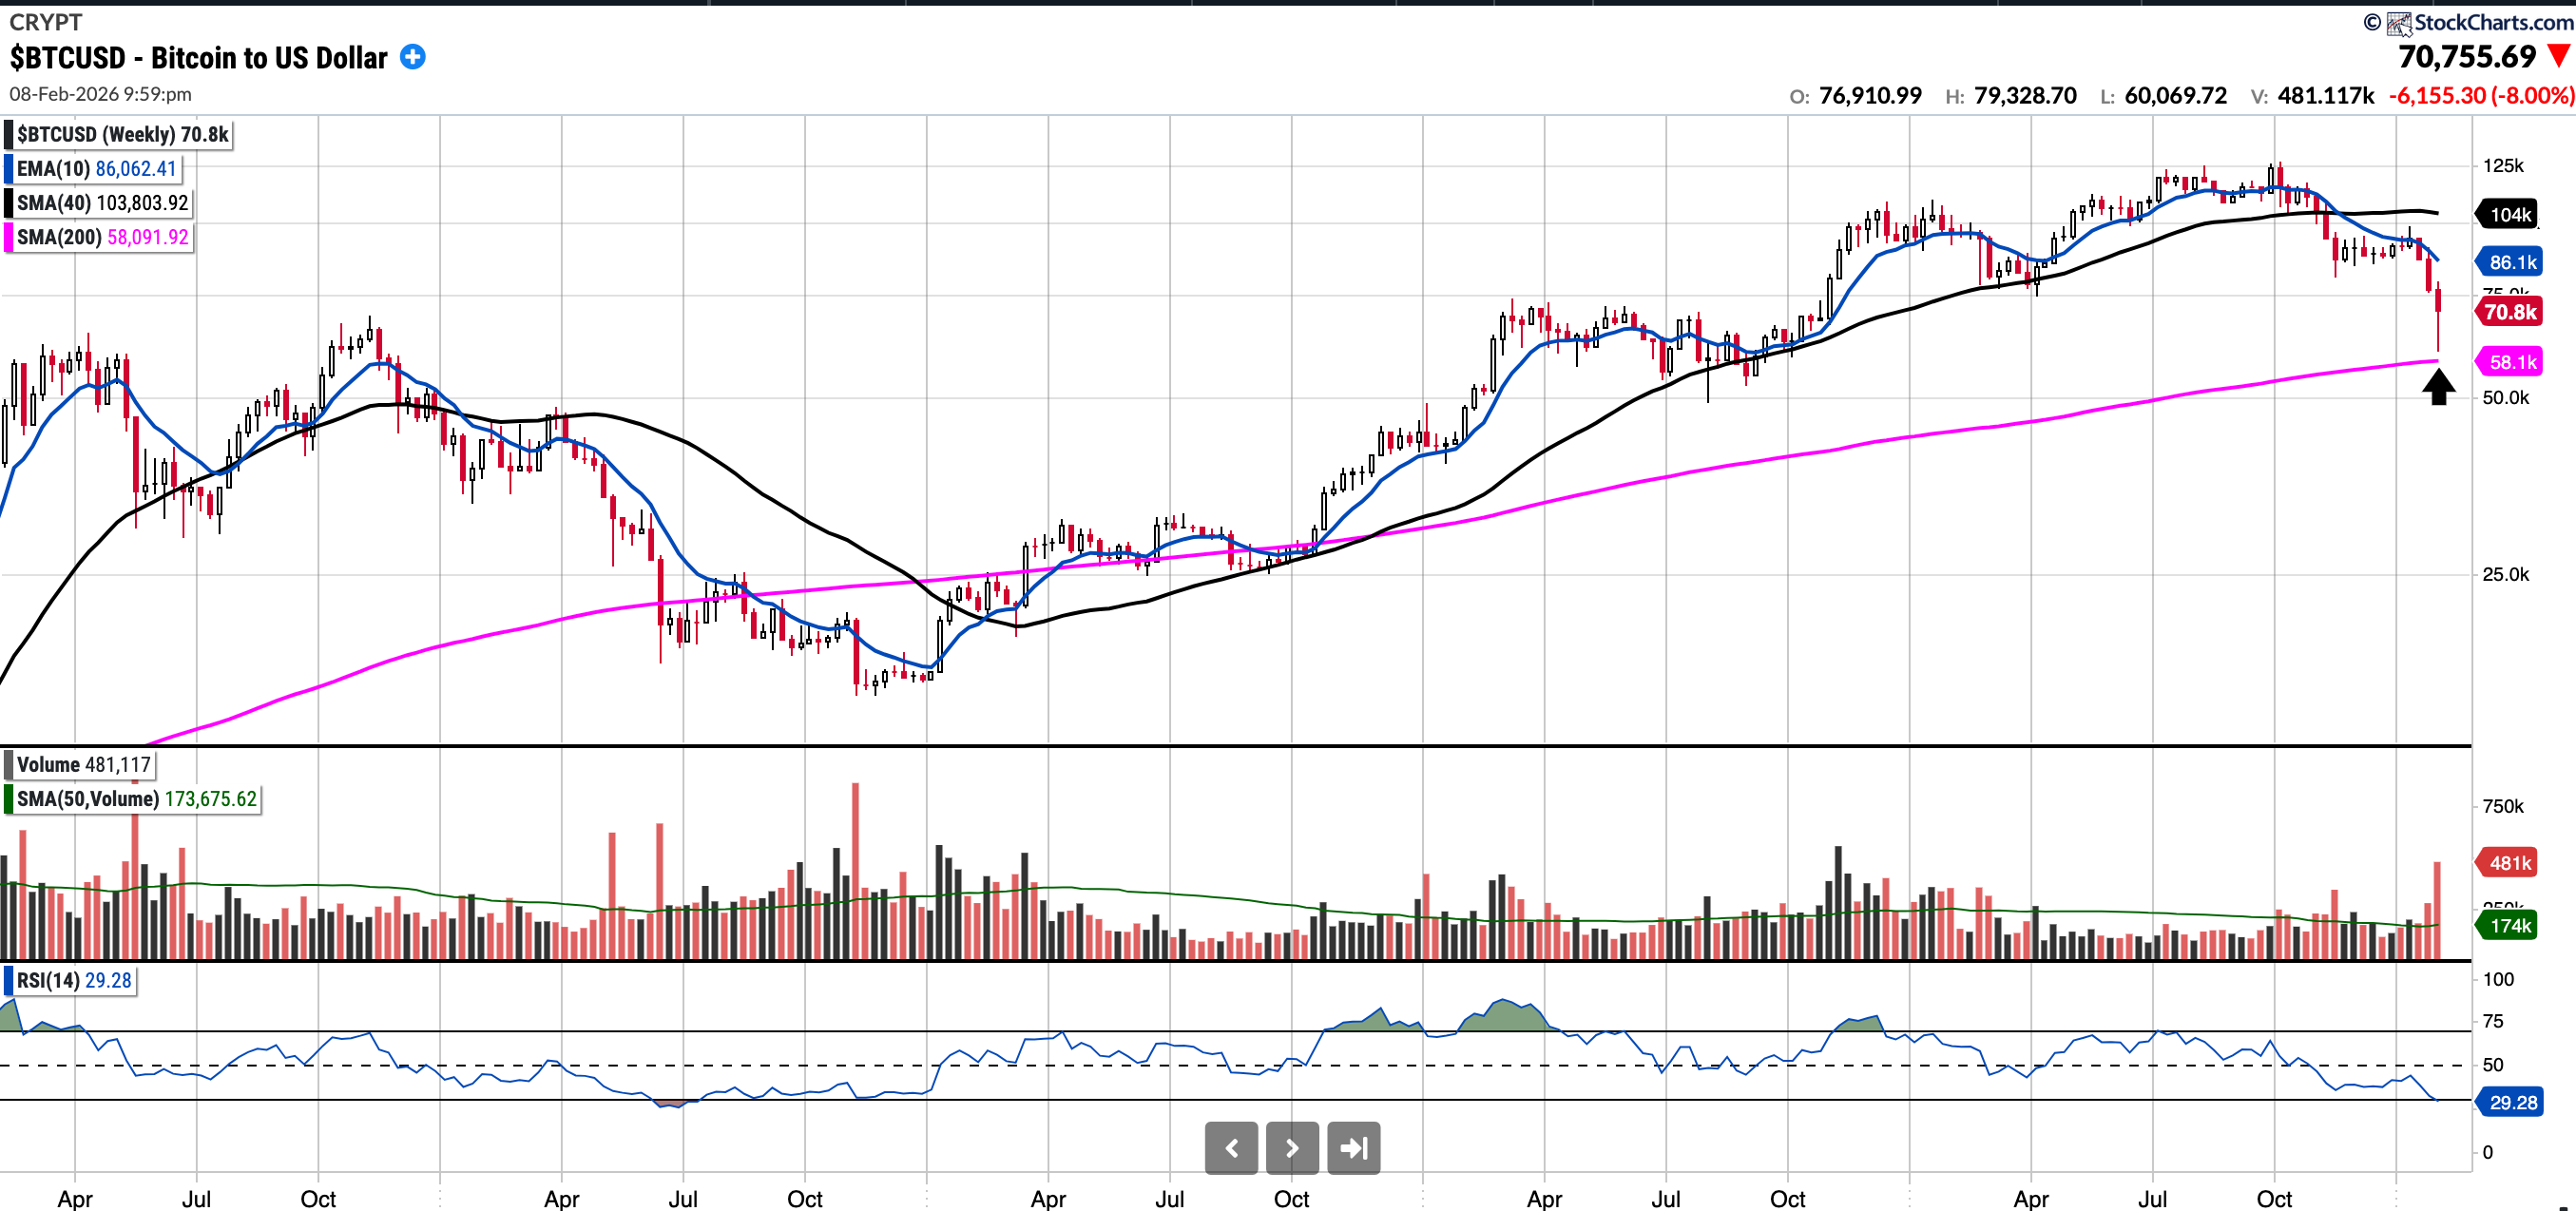
BTC (currently Long)
Currently trades at $70,699.74, ~18.70% below the 50SMA and ~30.9% below the 200SMA.
RSI 34.31
-20.3% YTD.
Last week I wrote “BTC is selling off on high volume, making fresh 52-week lows and remains firmly below all key moving averages. The mid 74k level was the Tariff meltdown low and I suspect that level gets tested overnight”.
This foreshadowed events to come as Bitcoin sliced through those levels, dropping as low as $59,000 on Thursday. BTC bounced back by more than $10,000 on Friday and has since traded in the $69k–$71k range over the weekend. While Bitcoin could see further mean reversion, significant technical work remains before the chart looks constructive again.
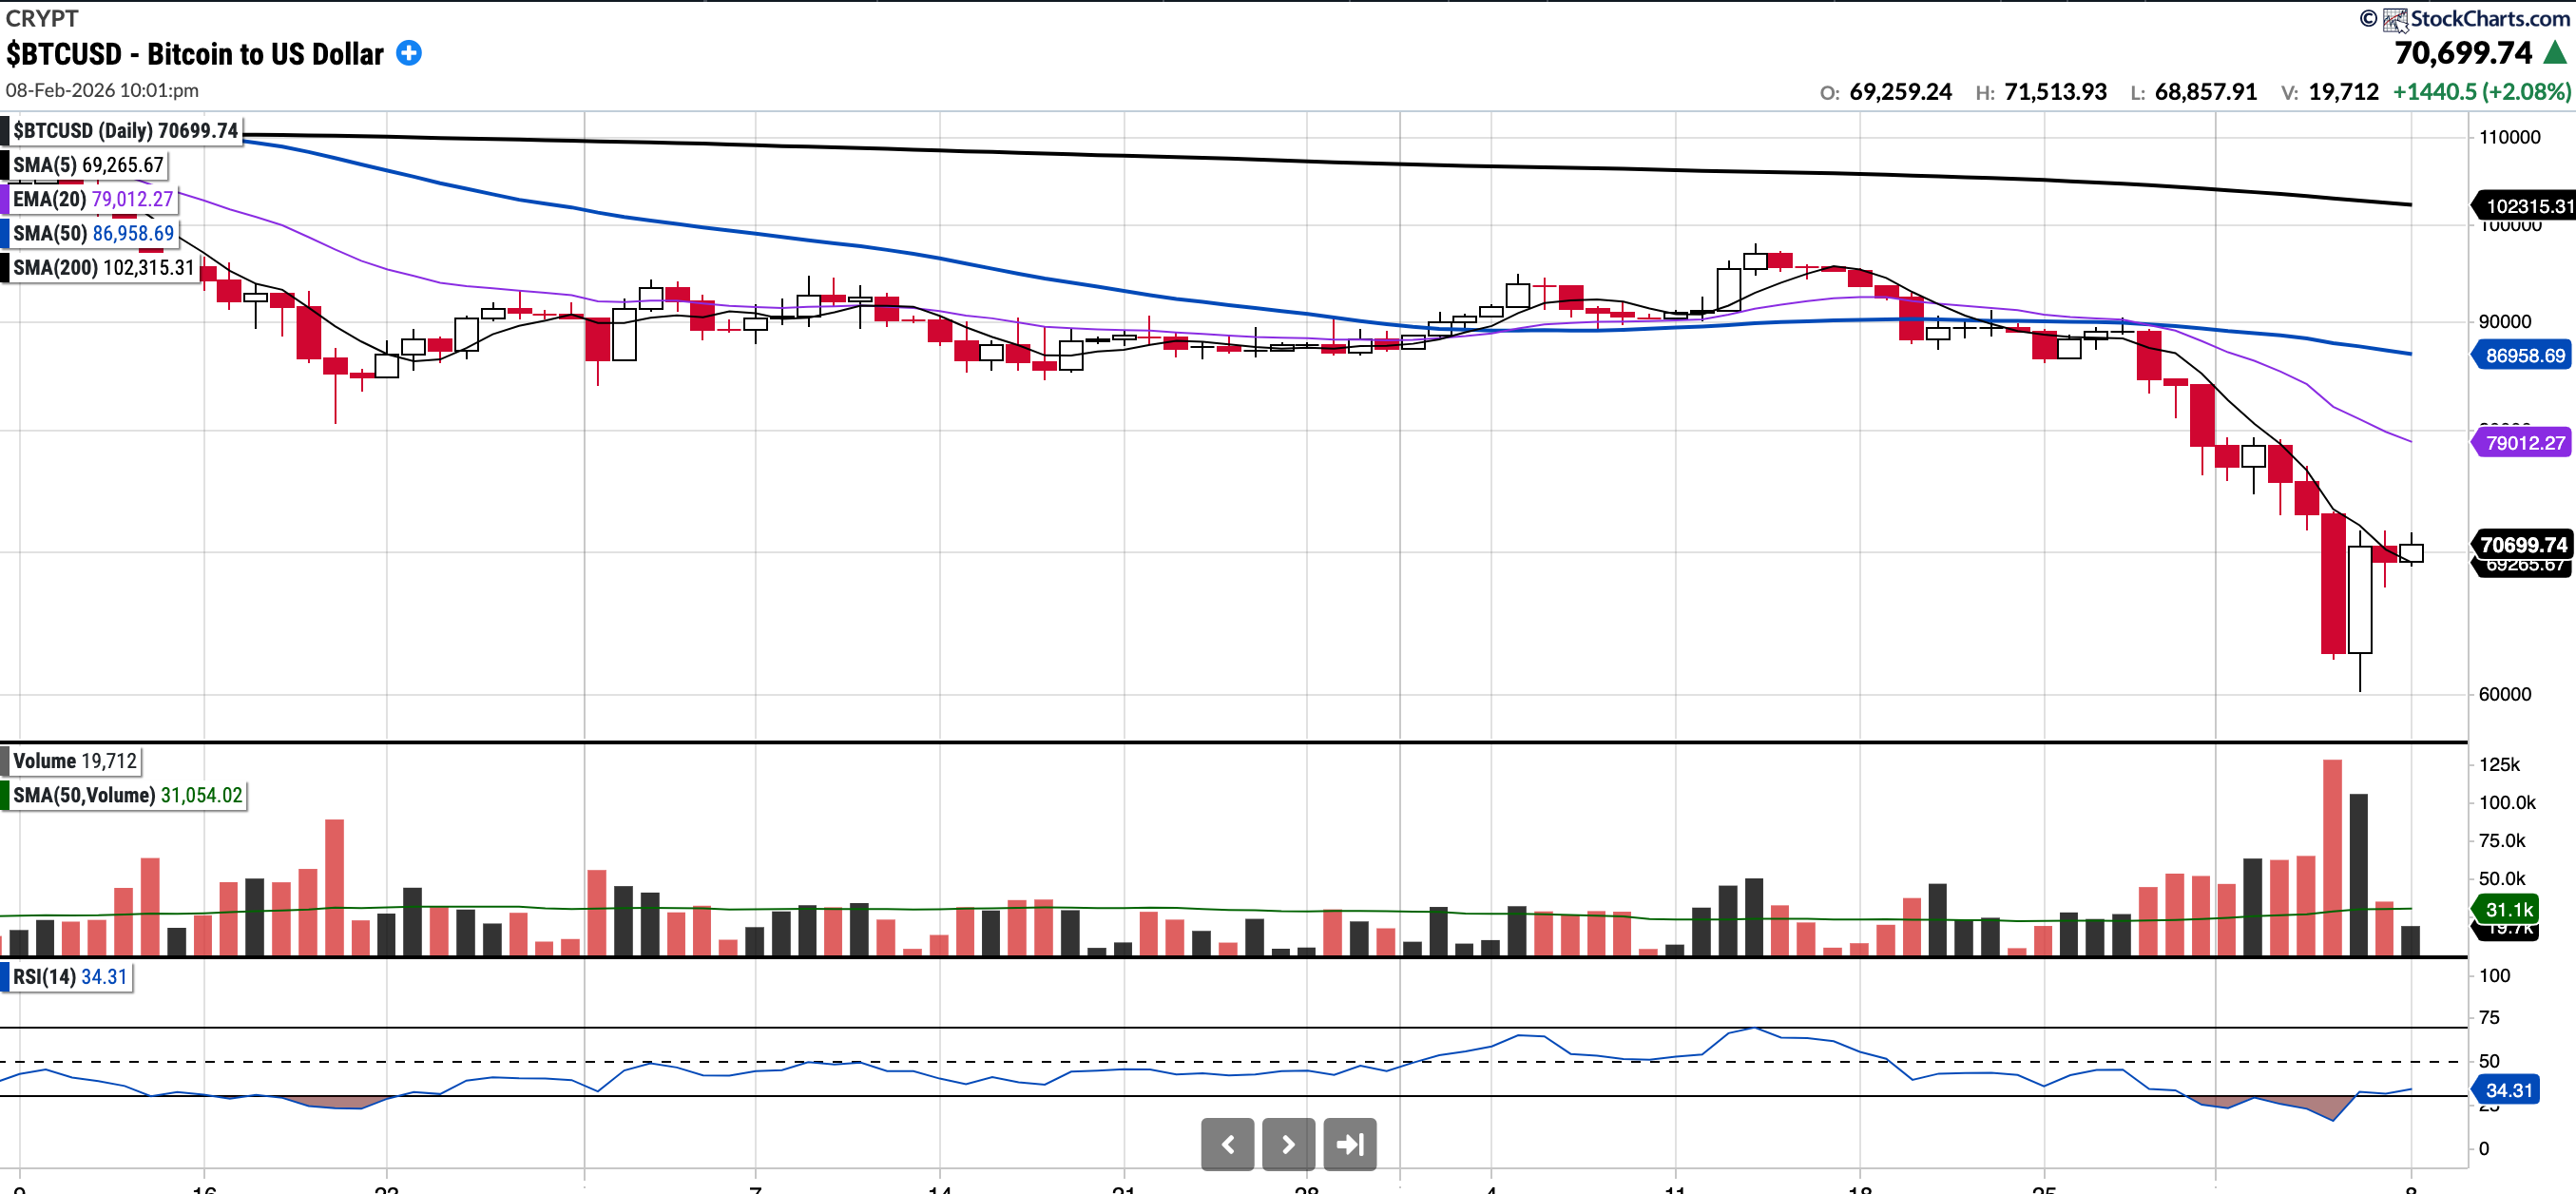
The weekly chart shows that Bitcoin did re-test the 200wk MA for the first time this cycle.
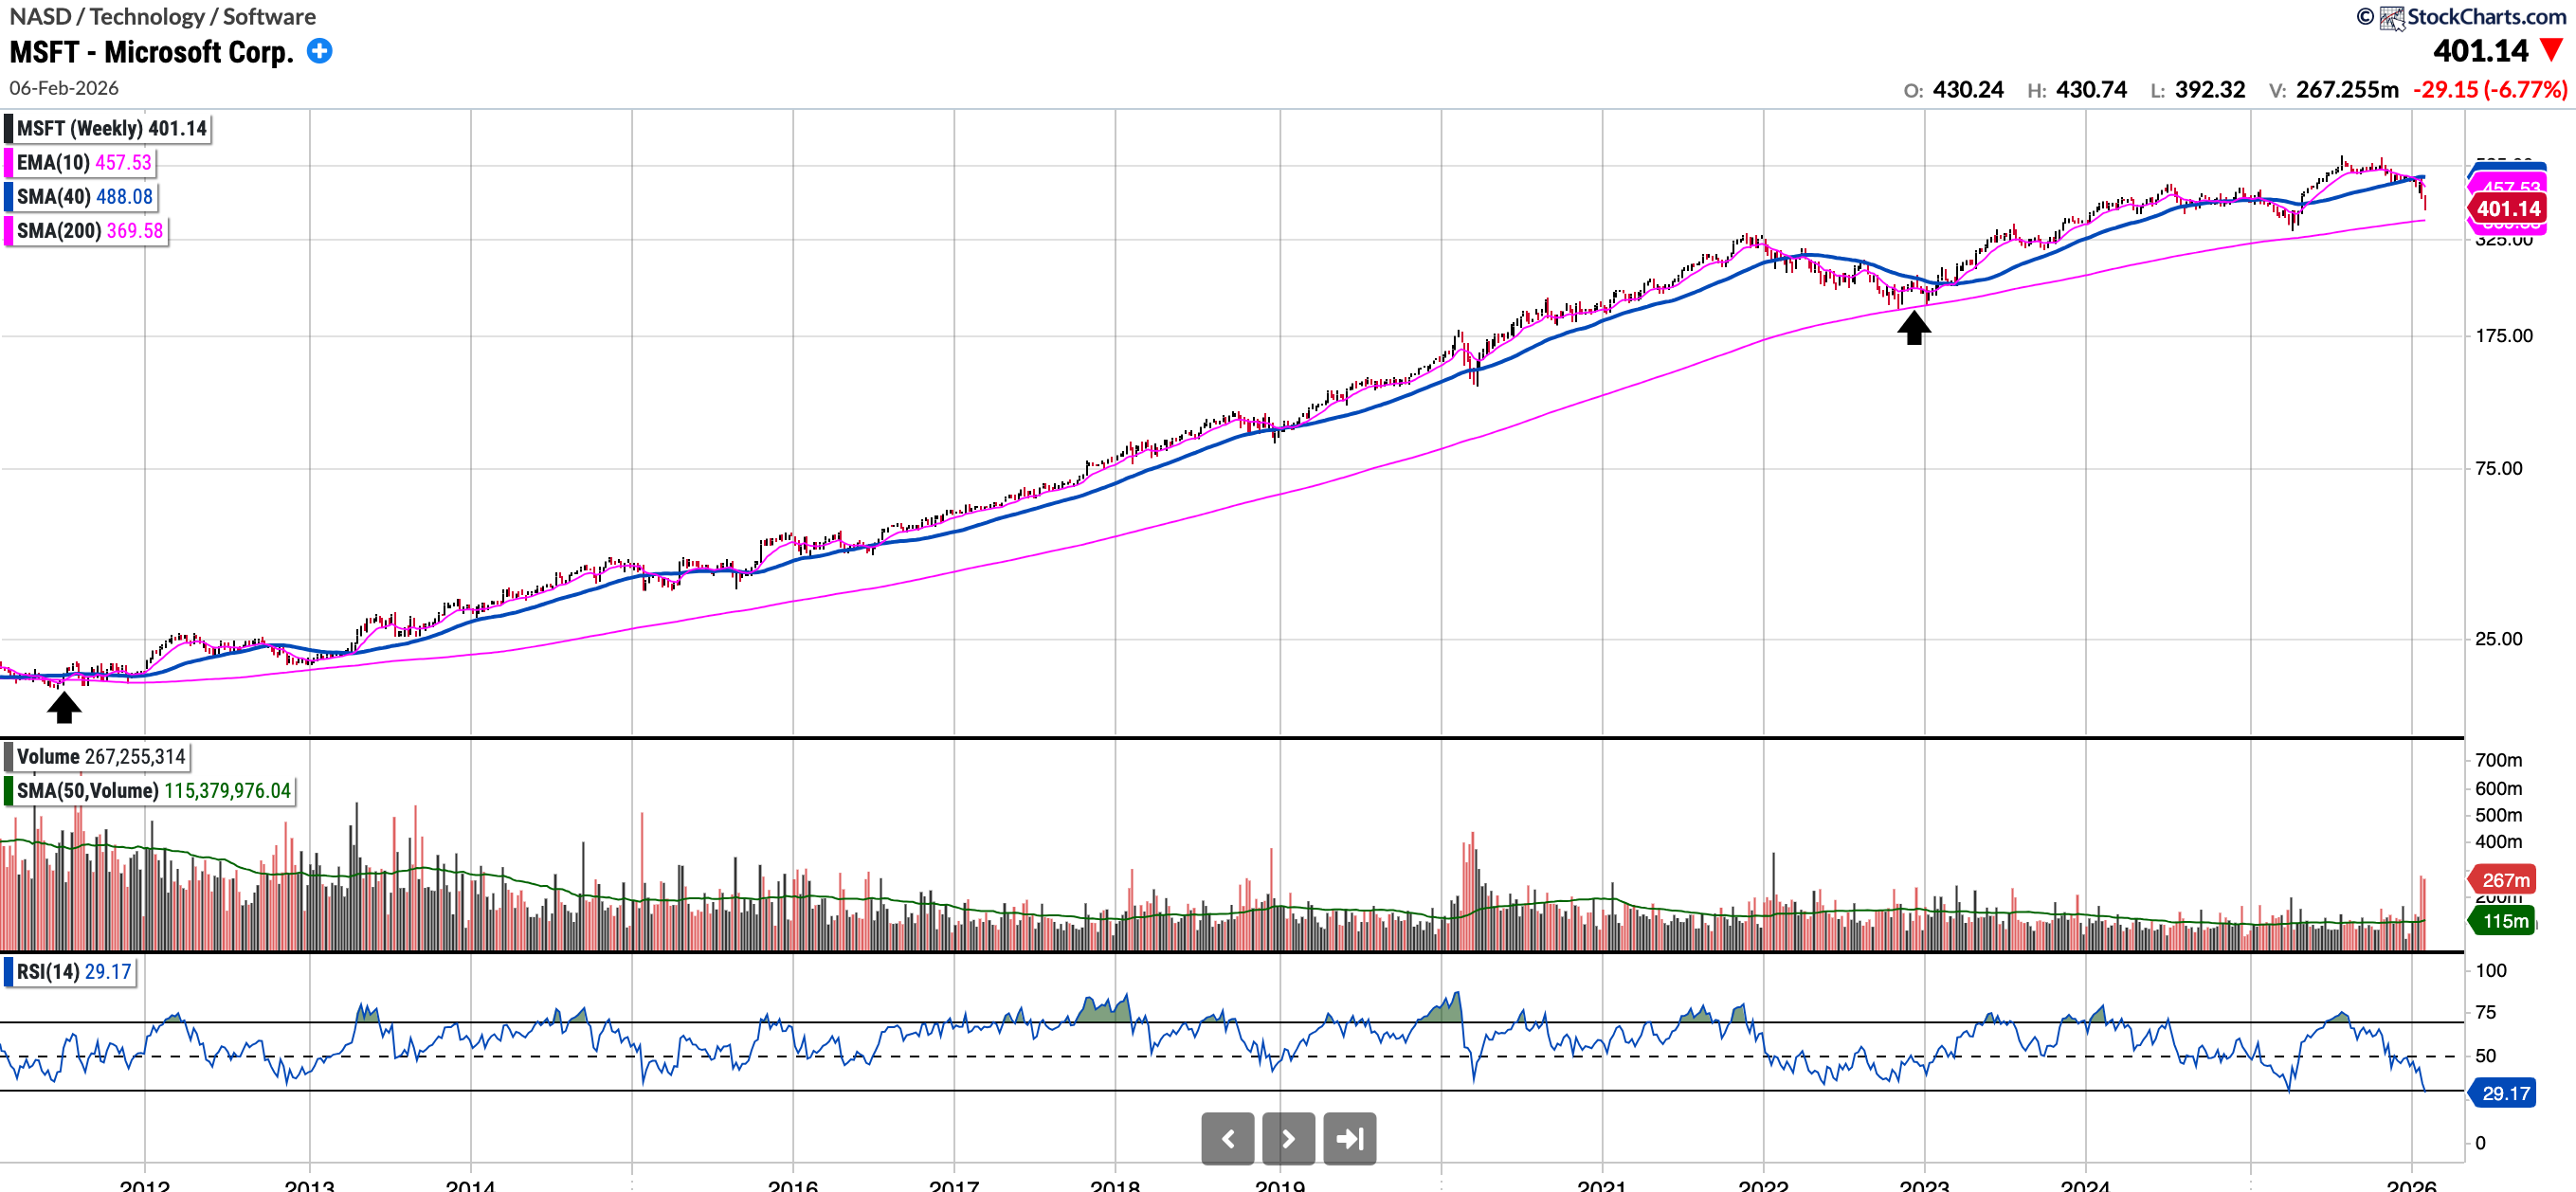
MSFT (currently Long)
Currently trades at $401.14, 14.45% below the 50SMA and 17.43% below the 200SMA.
RSI 29.13
-15.18% YTD.
Below is the MSFT weekly chart. It shows that the stock is more oversold than at any point since the GFC. During that timeframe, it has only tested the 200-week Moving Average a handful of times, and it may do so again soon if it reaches the $370 level.
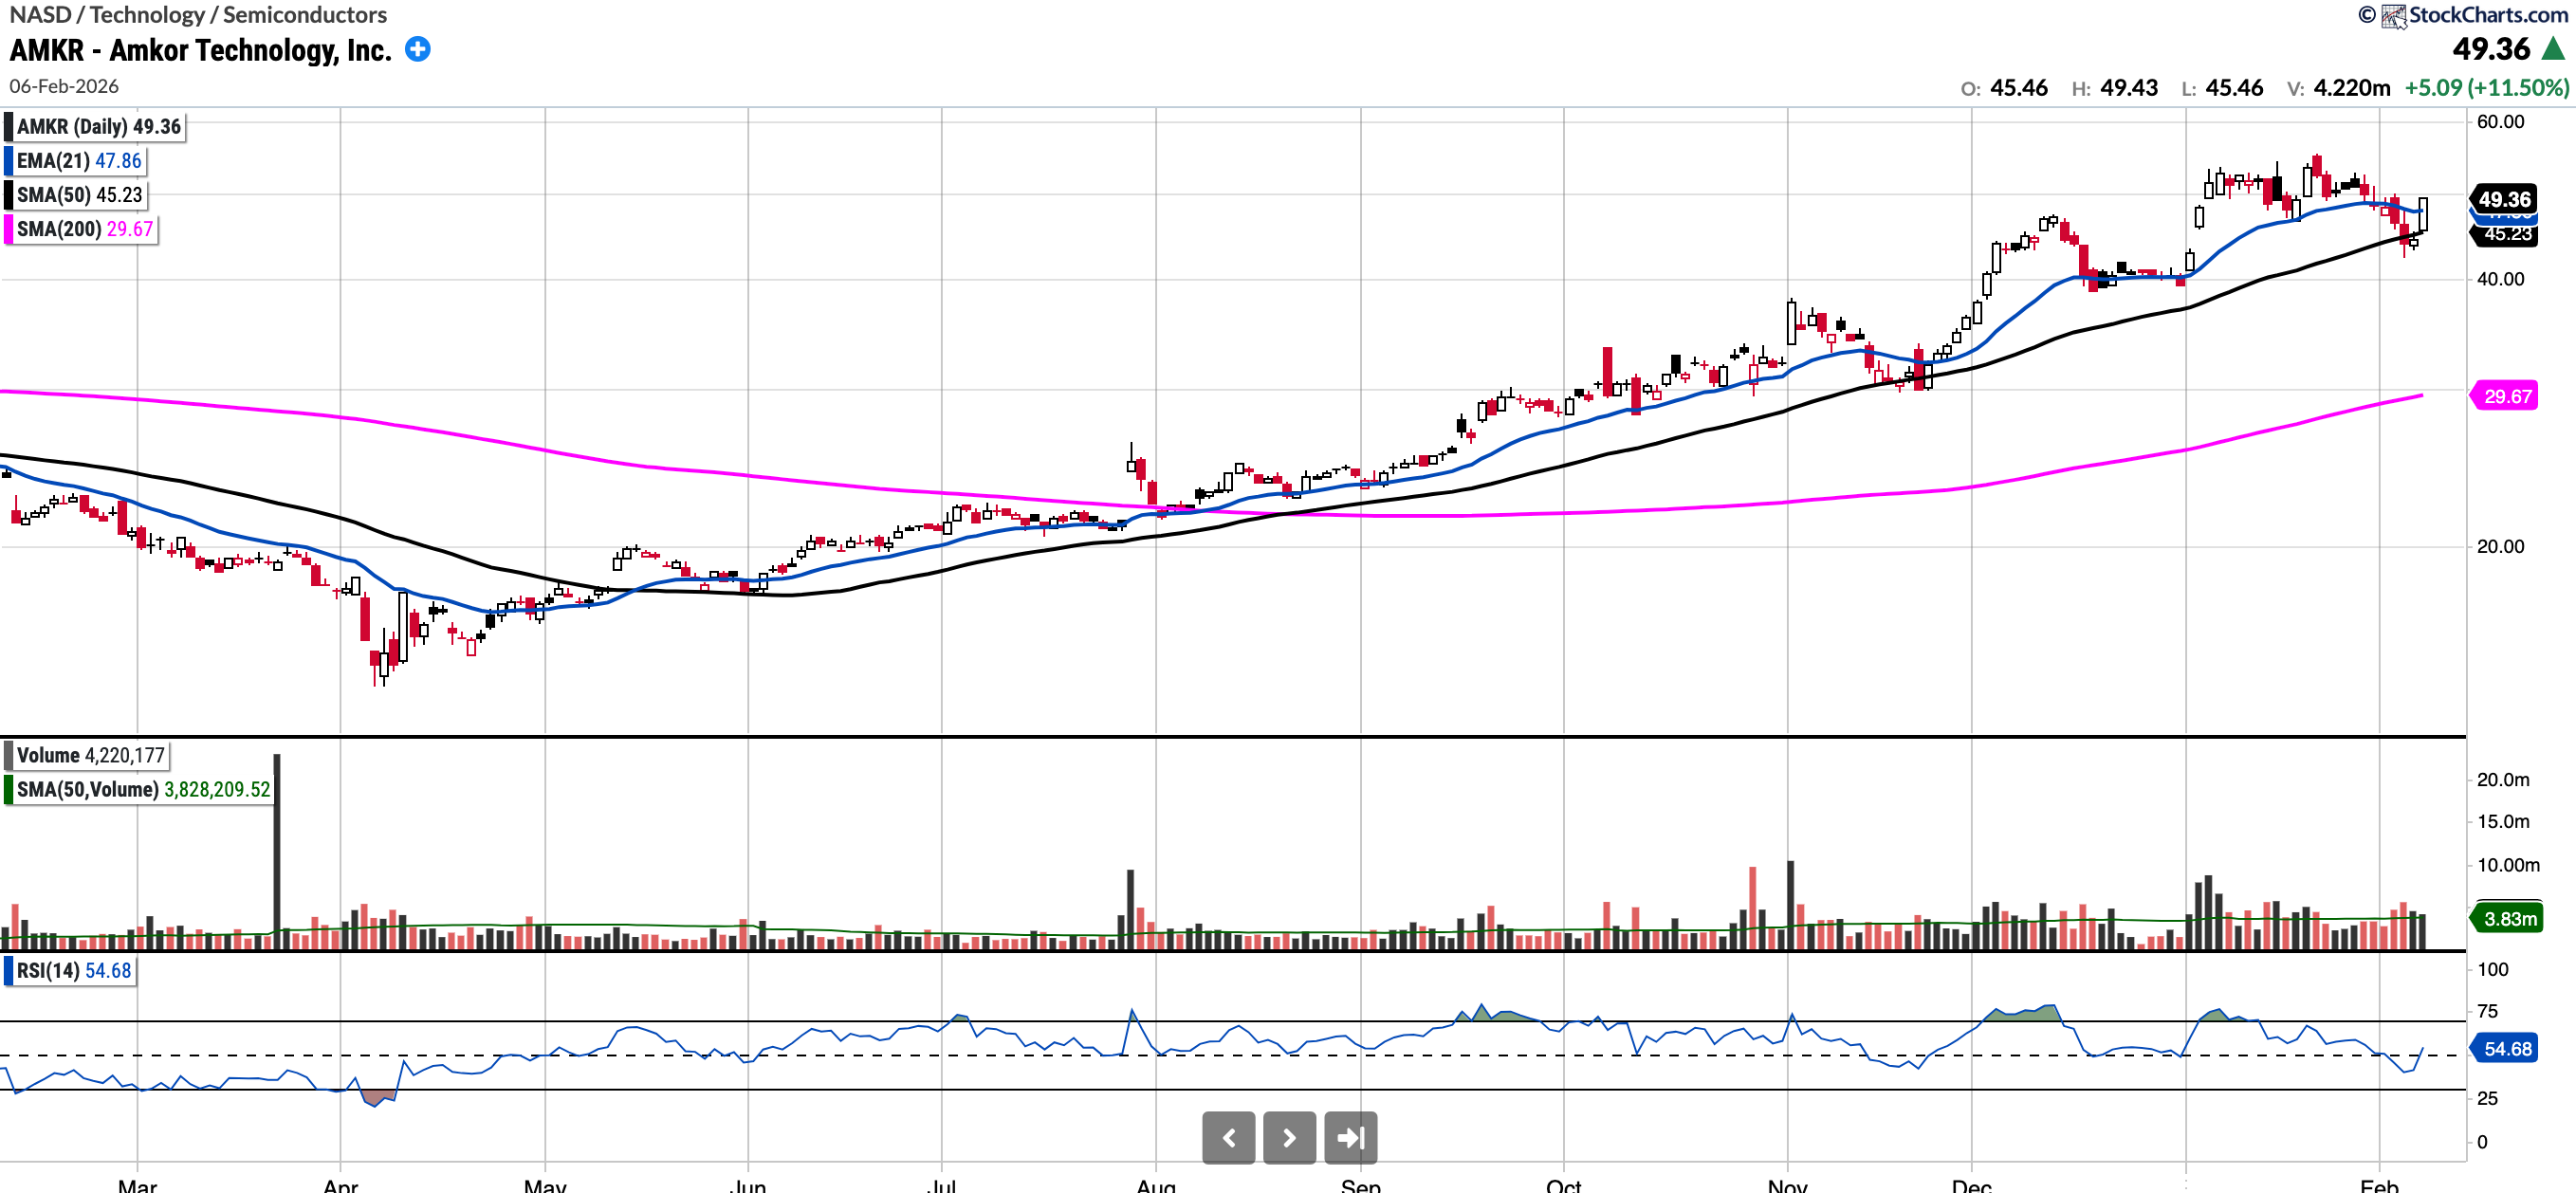
AMKR (No position)
Currently trades at $49.36, 9.13% above the 50SMA and 66.38% above the 200SMA.
RSI 54.68
15.00% YTD.
AMKR is a company I wrote about with TickerTango when the stock was $33 (see attached write-up). It has held up remarkably well during the November pullback and also amidst this volatility. Most recently, it re-tested and held the 50-day SMA. Doing so while the Nasdaq was down nearly 2% last week is a significant show of relative strength. They report after-hours tomorrow.

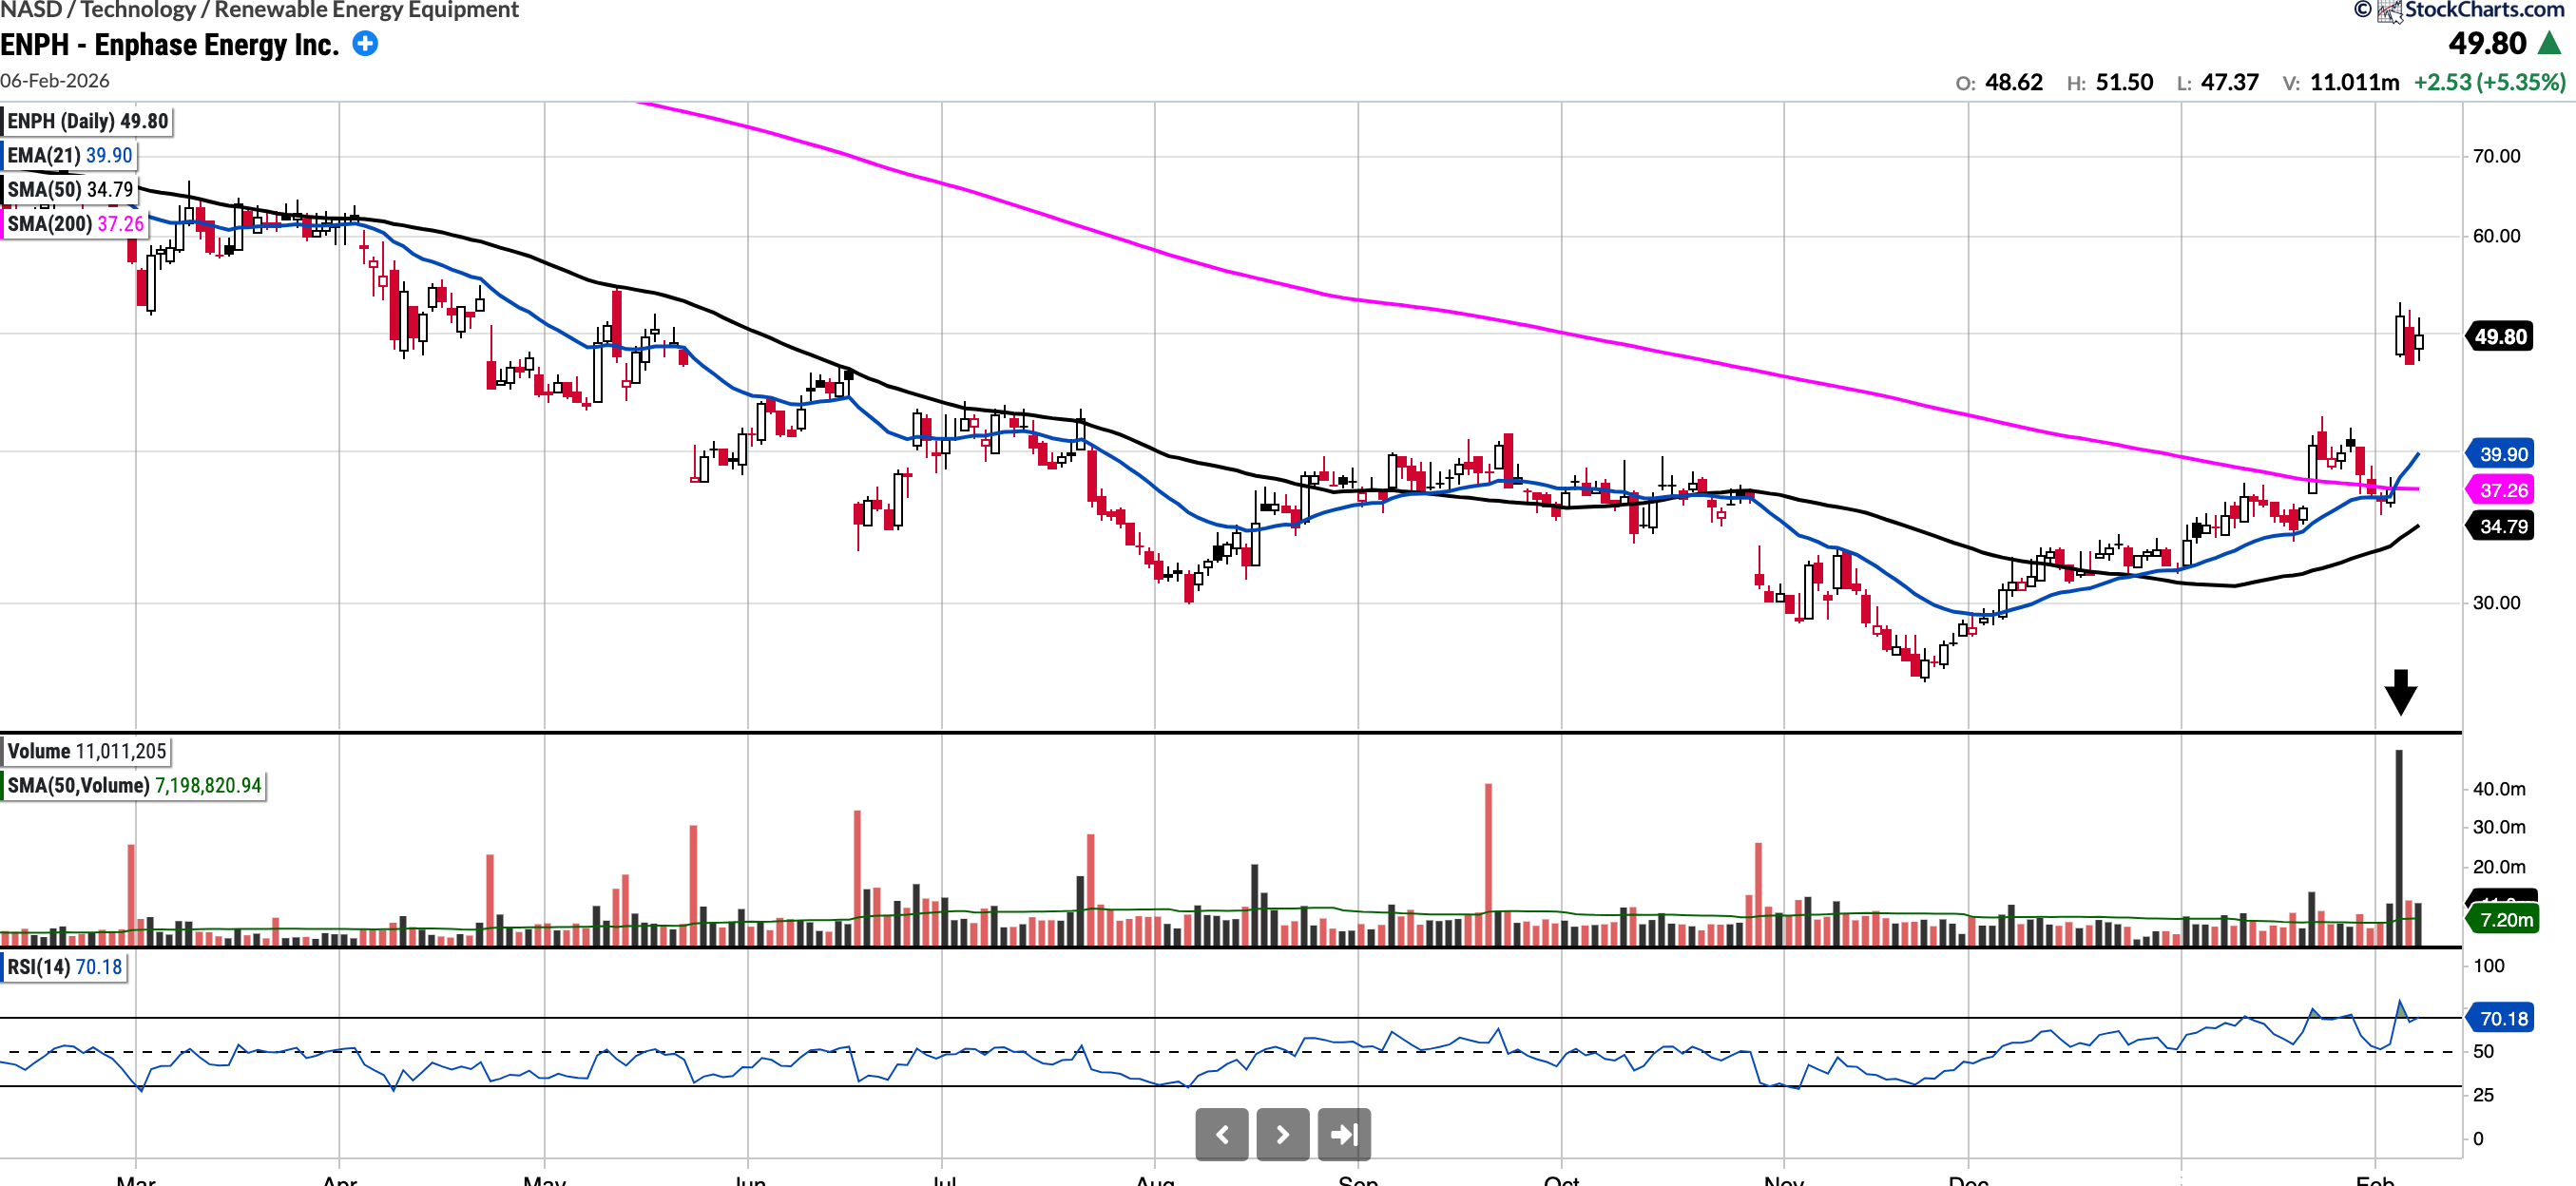
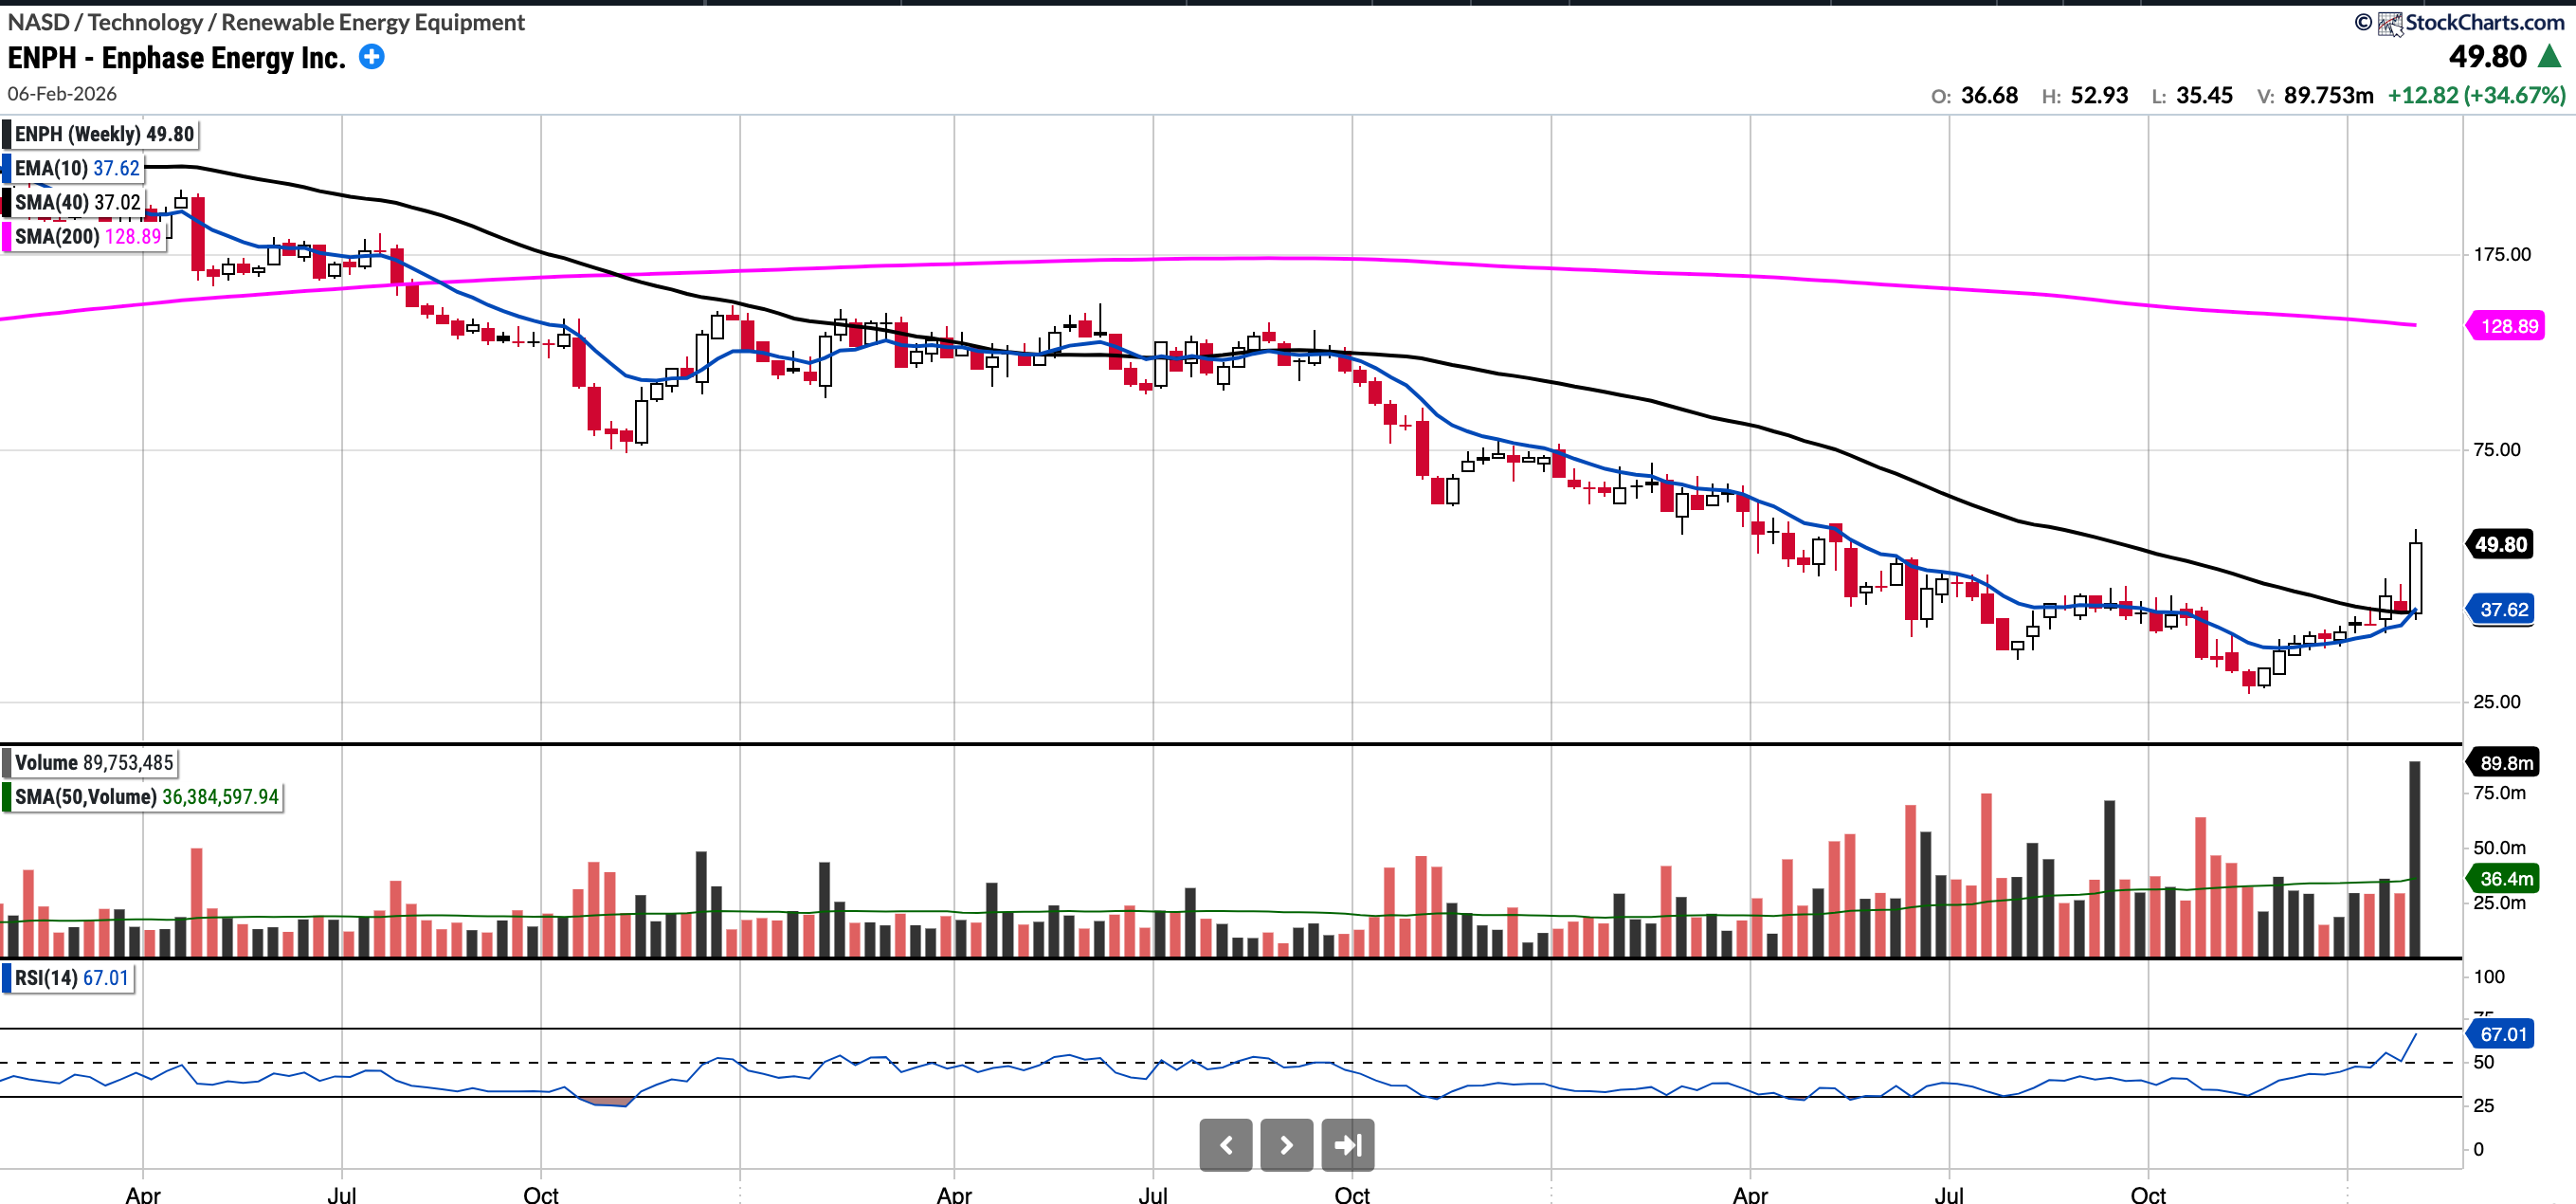
ENPH (No position)
Currently trades at $49.8, 43.14% above the 50SMA and 33.67% above the 200SMA.
RSI 54.68
47.56% YTD.
Enphase reported earnings last week and delivered a double beat. The stock surged more than 20% on high volume following news of inventory normalisation and stronger-than-expected guidance. US demand is at it’s highest for the last 2 years.
The stock has had several counter rallies in the last 12-18 months but this potentially could be a change in trend given on the weekly chart the 10EMA has crossed above the SMA 40 also. I have added this name to my trading watchlist.
Notable portfolio changes in previous week (all updated live in subscriber channels):
