
Preview of the Week Ahead
W/C December 29, 2025

Hope you all are having a good weekend. Below we will be previewing the upcoming week and providing a portfolio update as usual.
Format for what is covered in this weekly preview:
A look at the indices
Key upcoming economic events
Upcoming earnings reports
Charts
Notable portfolio changes from the previous week
Current Portfolio Holdings (Position size, cost basis, and commentary on each holding regarding the intended holding period and any planned activity)
Closing Thoughts
I highly recommend checking out the latest Monthly Portfolio and Performance Update (TWR +392.9% since Jan ‘23), as well as my post below covering the stocks and setups I like heading into 2026.


If it is your first time here, read the below post on how to navigate the SixSigmaCapital Website and subscribe to the option that suits.

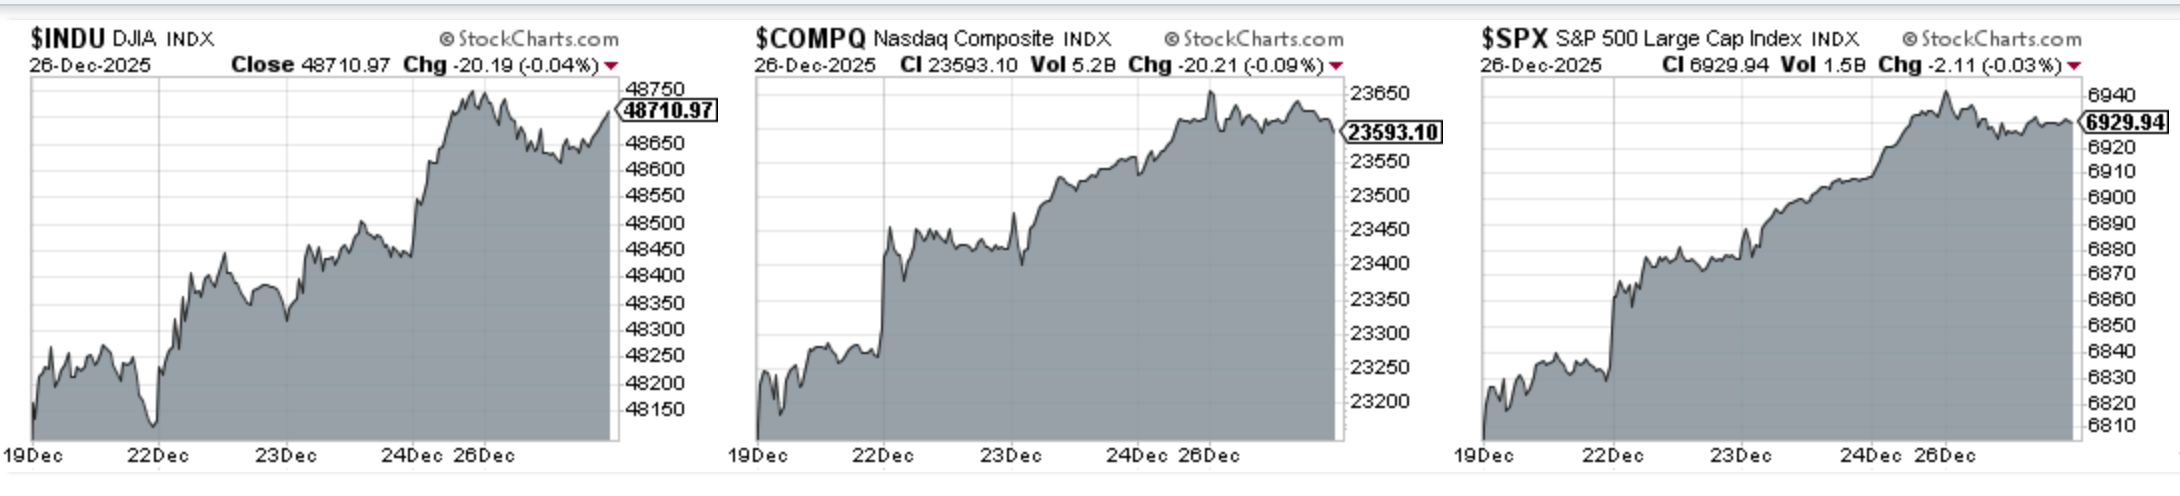
Indices
Dow Jones advanced 1.06% in the last week
S&P 500 advanced 1.75% in the last week
Nasdaq Composite advanced 1.87% in the last week
IWM advanced 0.35% in the last week
Key upcoming economic events:
Monday, Dec 29
Pending Home Sales (Nov)
Dallas Fed Manufacturing Index (Dec)
Advance International Trade in Goods (Nov)
Tuesday, Dec 30
S&P Case-Shiller Home Price Index (Oct)
FOMC Meeting Minutes (Dec Meeting)
Wednesday, Dec 31 (New Year’s Eve)
Weekly Jobless Claims
Thursday, Jan 1 (New Year’s Day)
Markets Closed
Friday, Jan 2
ISM Manufacturing PMI (Dec)
Construction Spending (Nov)
Global Supply Chain Pressure Index
Upcoming Earnings
There is no company of note reporting. Below is the infographic by Earnings Whispers:

Charts
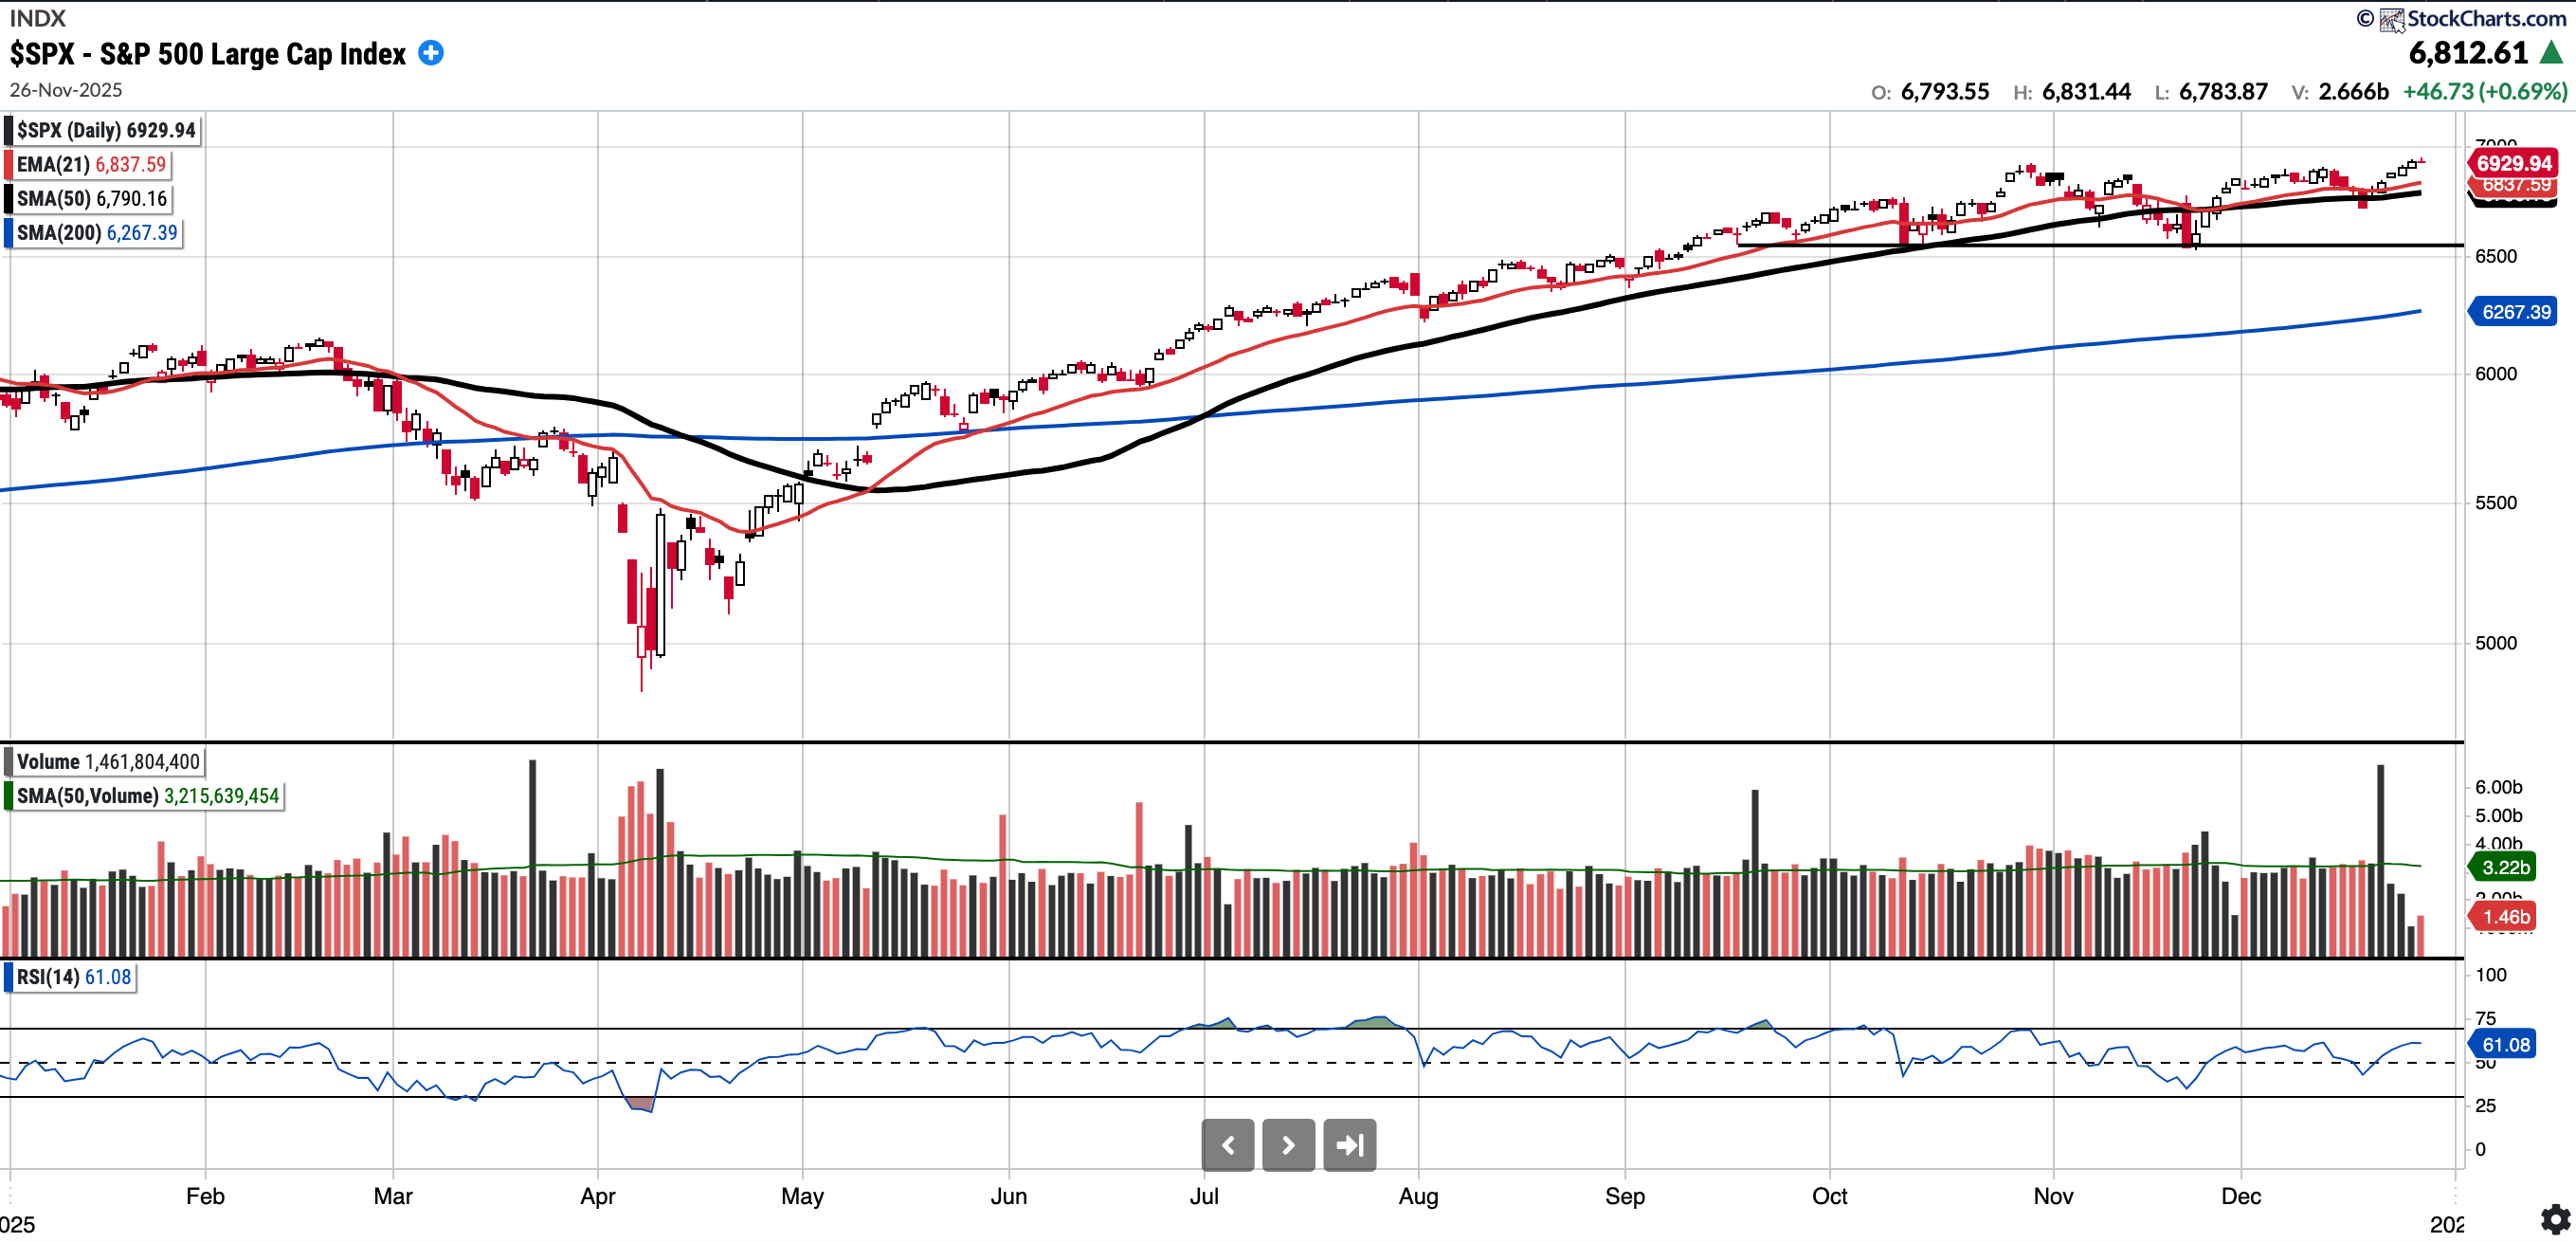
SPX
Currently trades at 6929.94, 2.06% above a rising 50SMA and 10.57% above the 200SMA.
RSI 61.08
18.09% YTD
Distribution days in the last week: 0
Notably, the SPX printed a new ATH on Friday of 6,945.77.
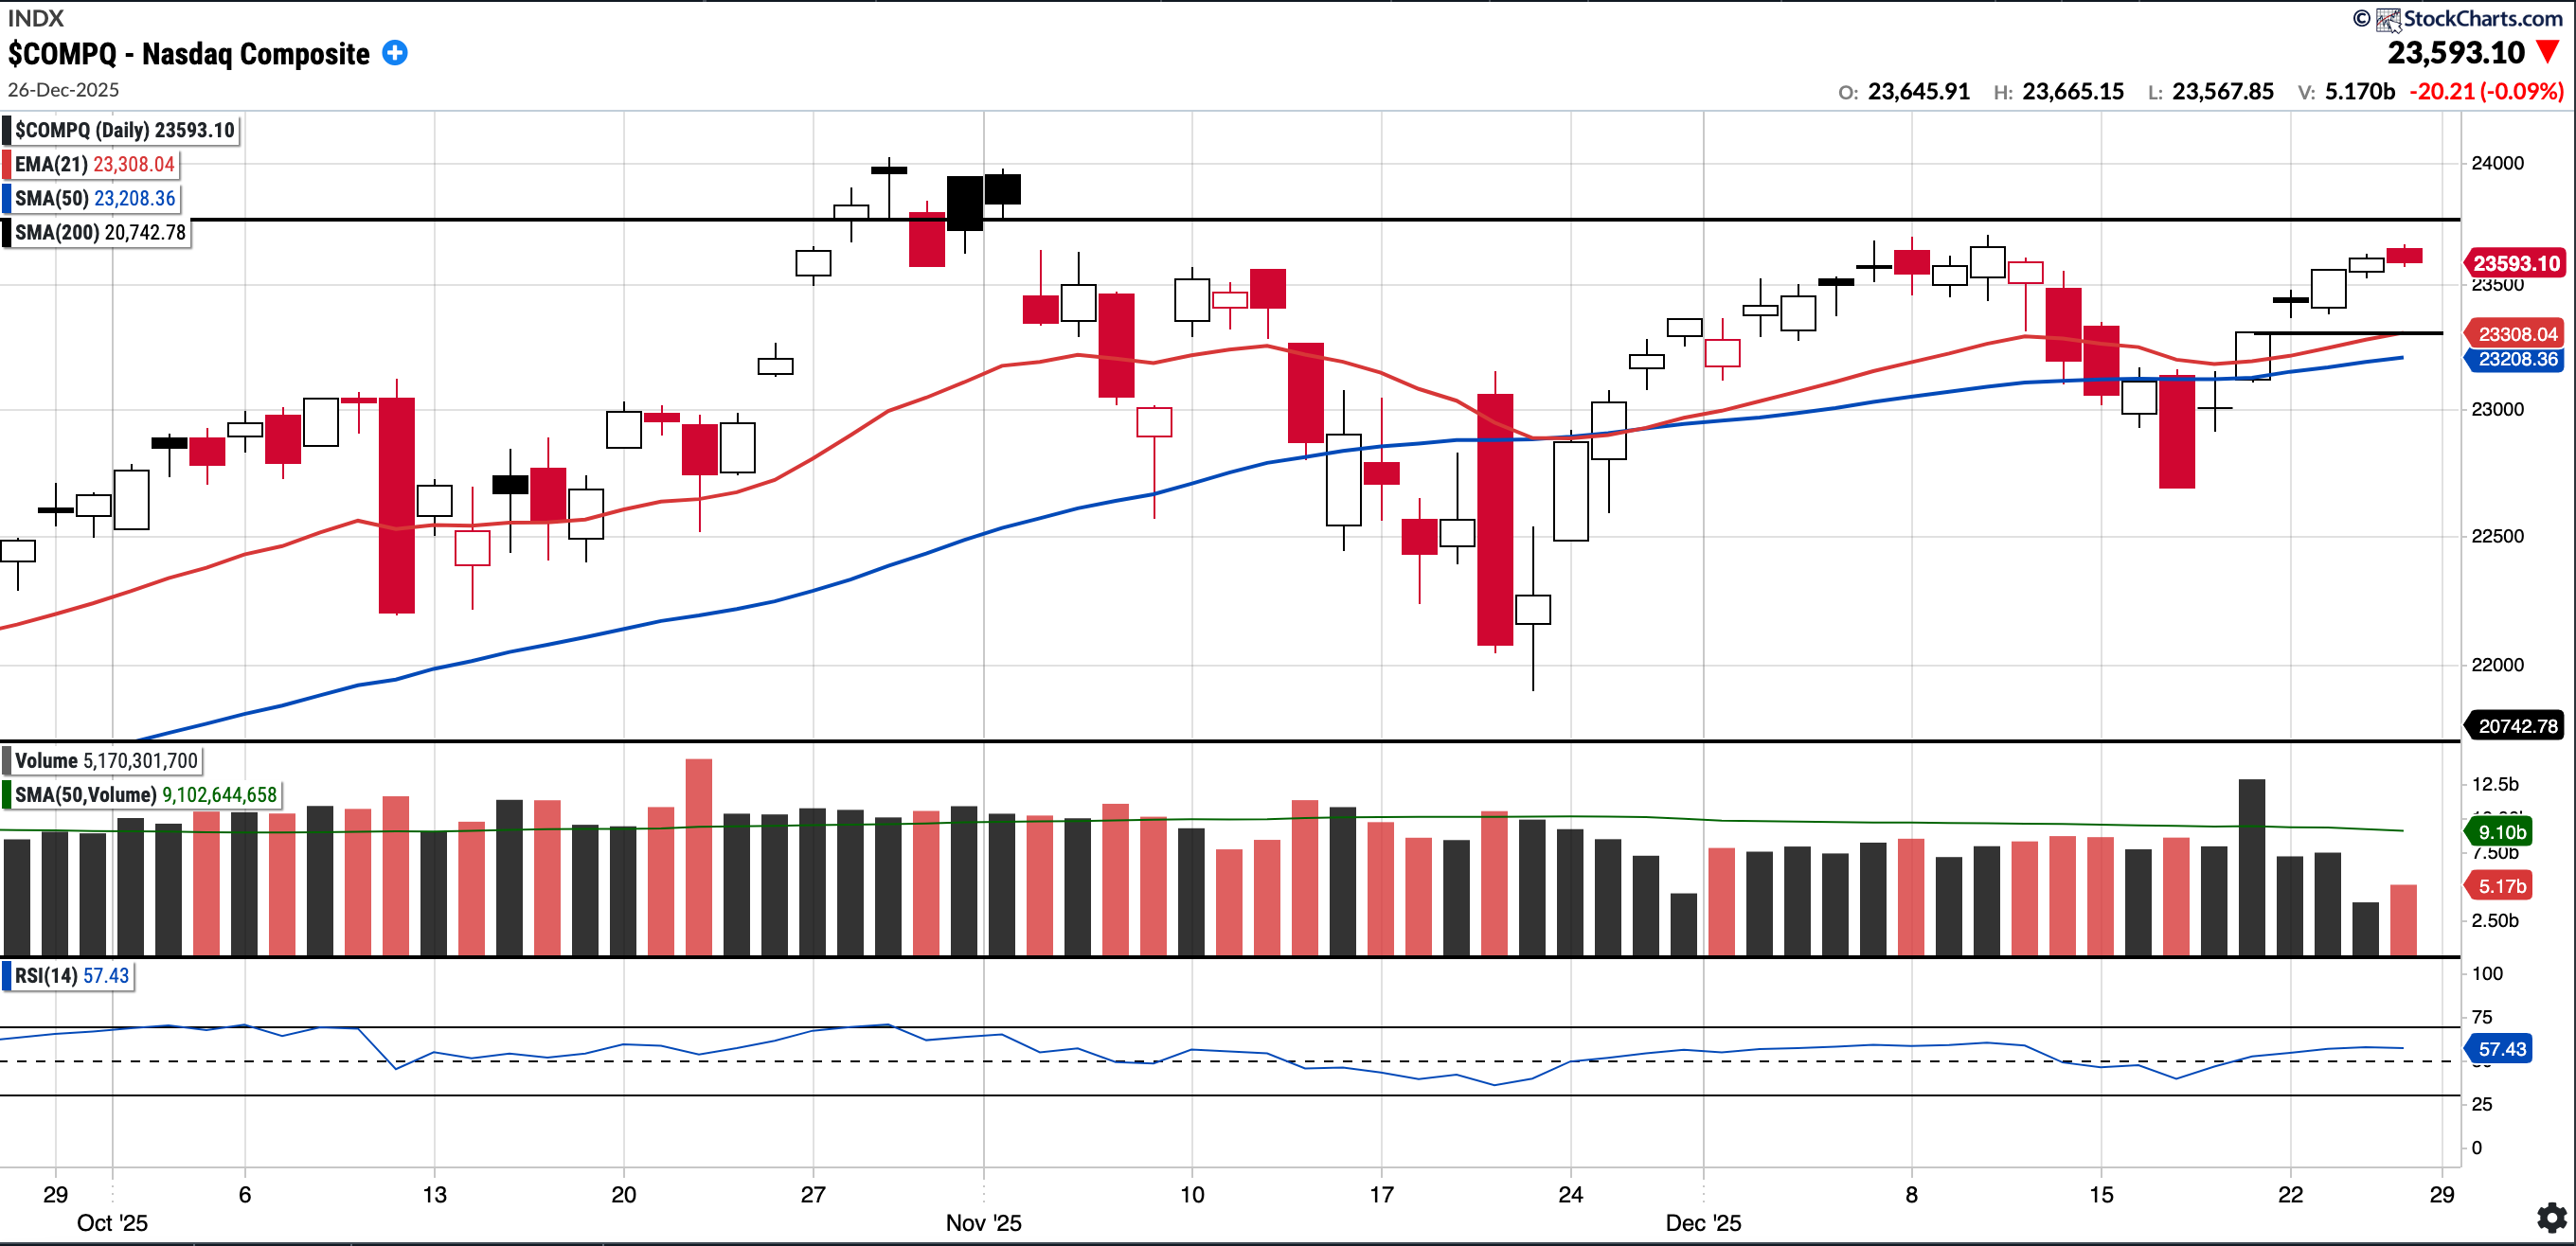
COMPQ
Currently trades at 23,593.1, 1.66% above a rising 50SMA and 13.74% above 200SMA.
RSI 57.43
22.37% YTD
Distribution days in the last week: 0
The Nasdaq Composite had a positive week and remains above both the EMA 21 and SMA 50.
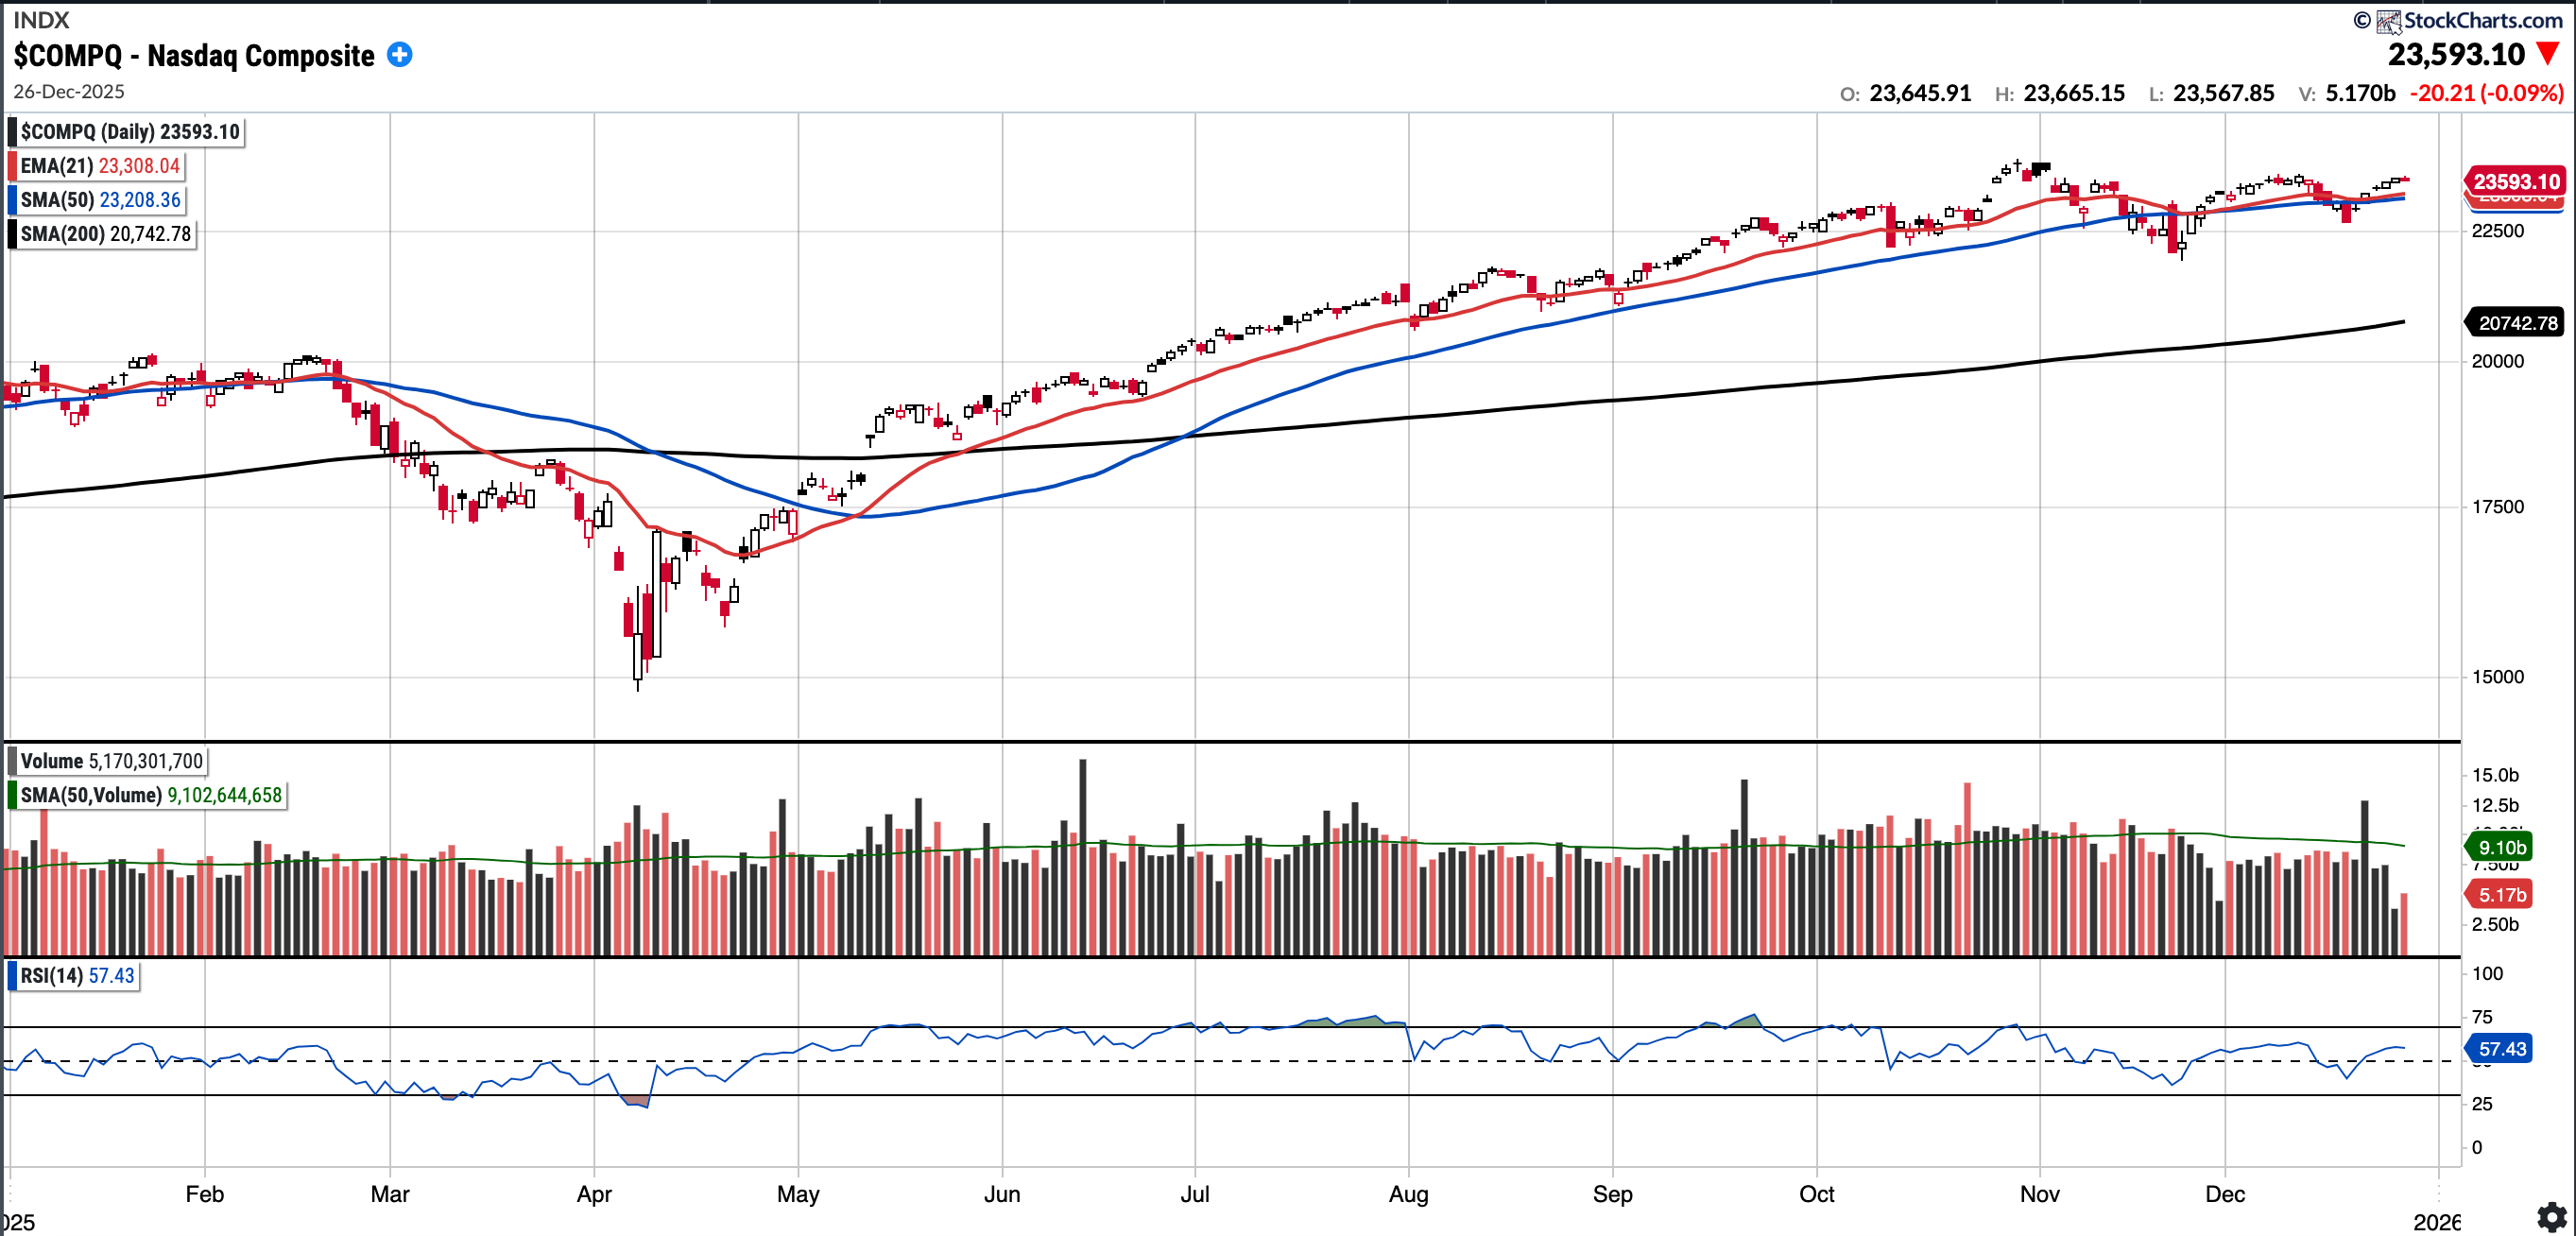
There are unfilled gaps to the upside (23,760) and the downside (23,306) that may be tested.
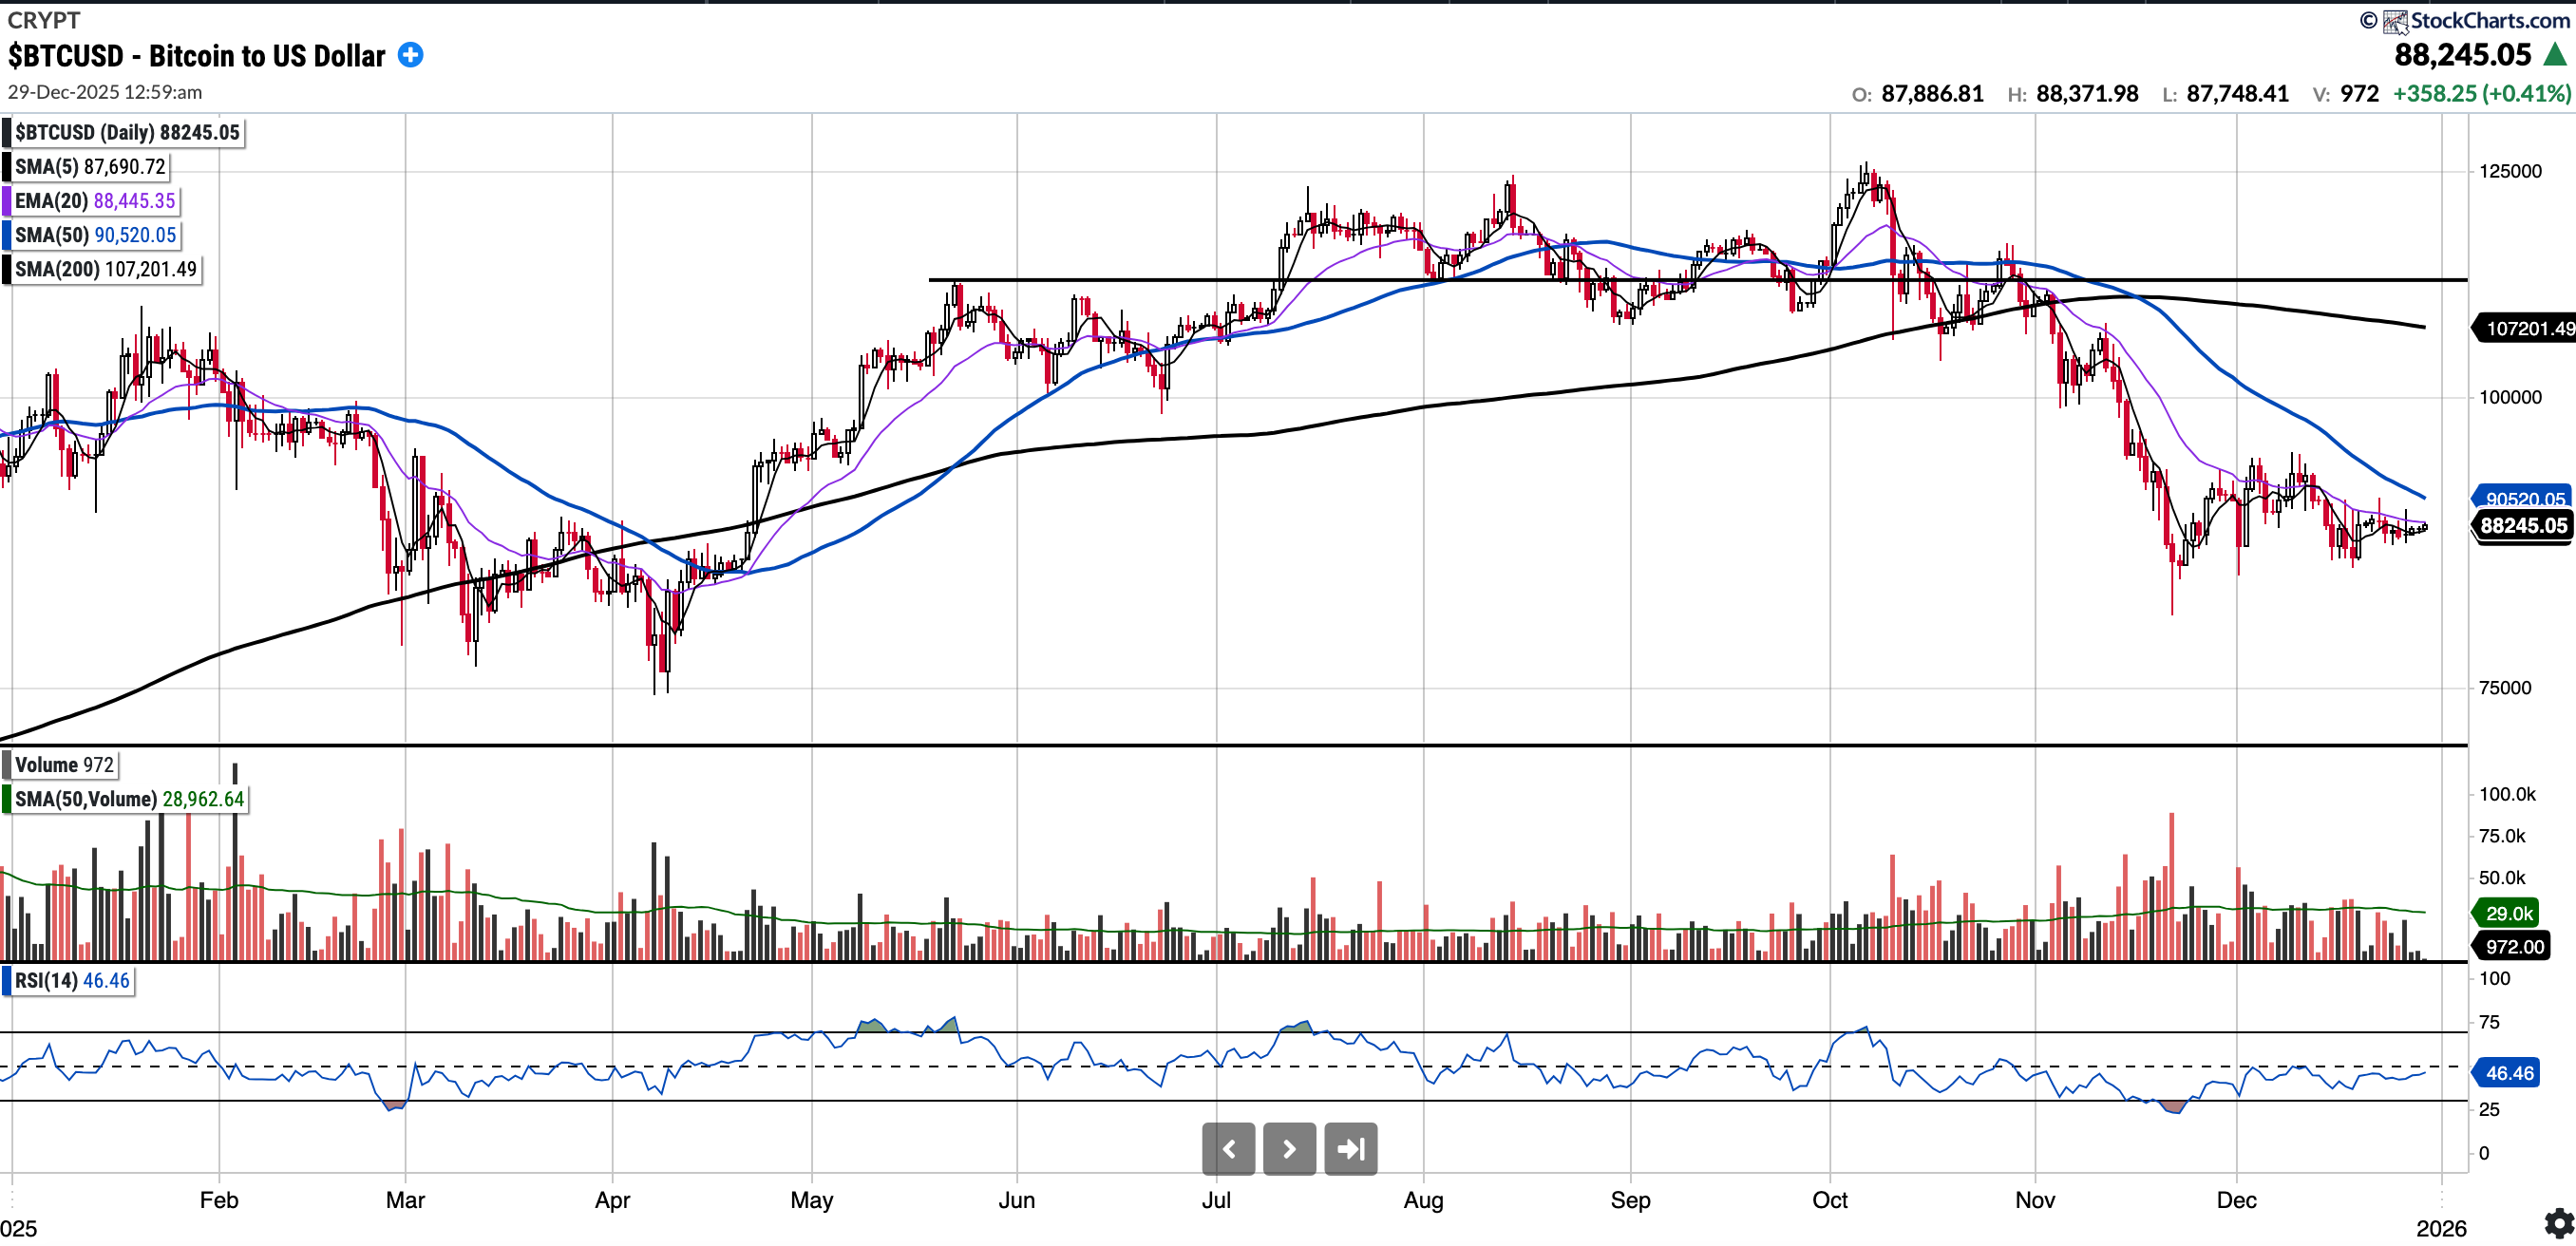
BTC (currently Long)
Currently trades at $88,245.05, ~2.4% below the 50SMA and 17.50% below the 200SMA.
RSI 46.46
-6.5% YTD.
BTC is pretty flat on the week but continues to perform poorly since the liquidation event on October 10th. It remains firmly below all key moving averages.
Needless to say, the BTC chart requires significant time and work to look constructive again.
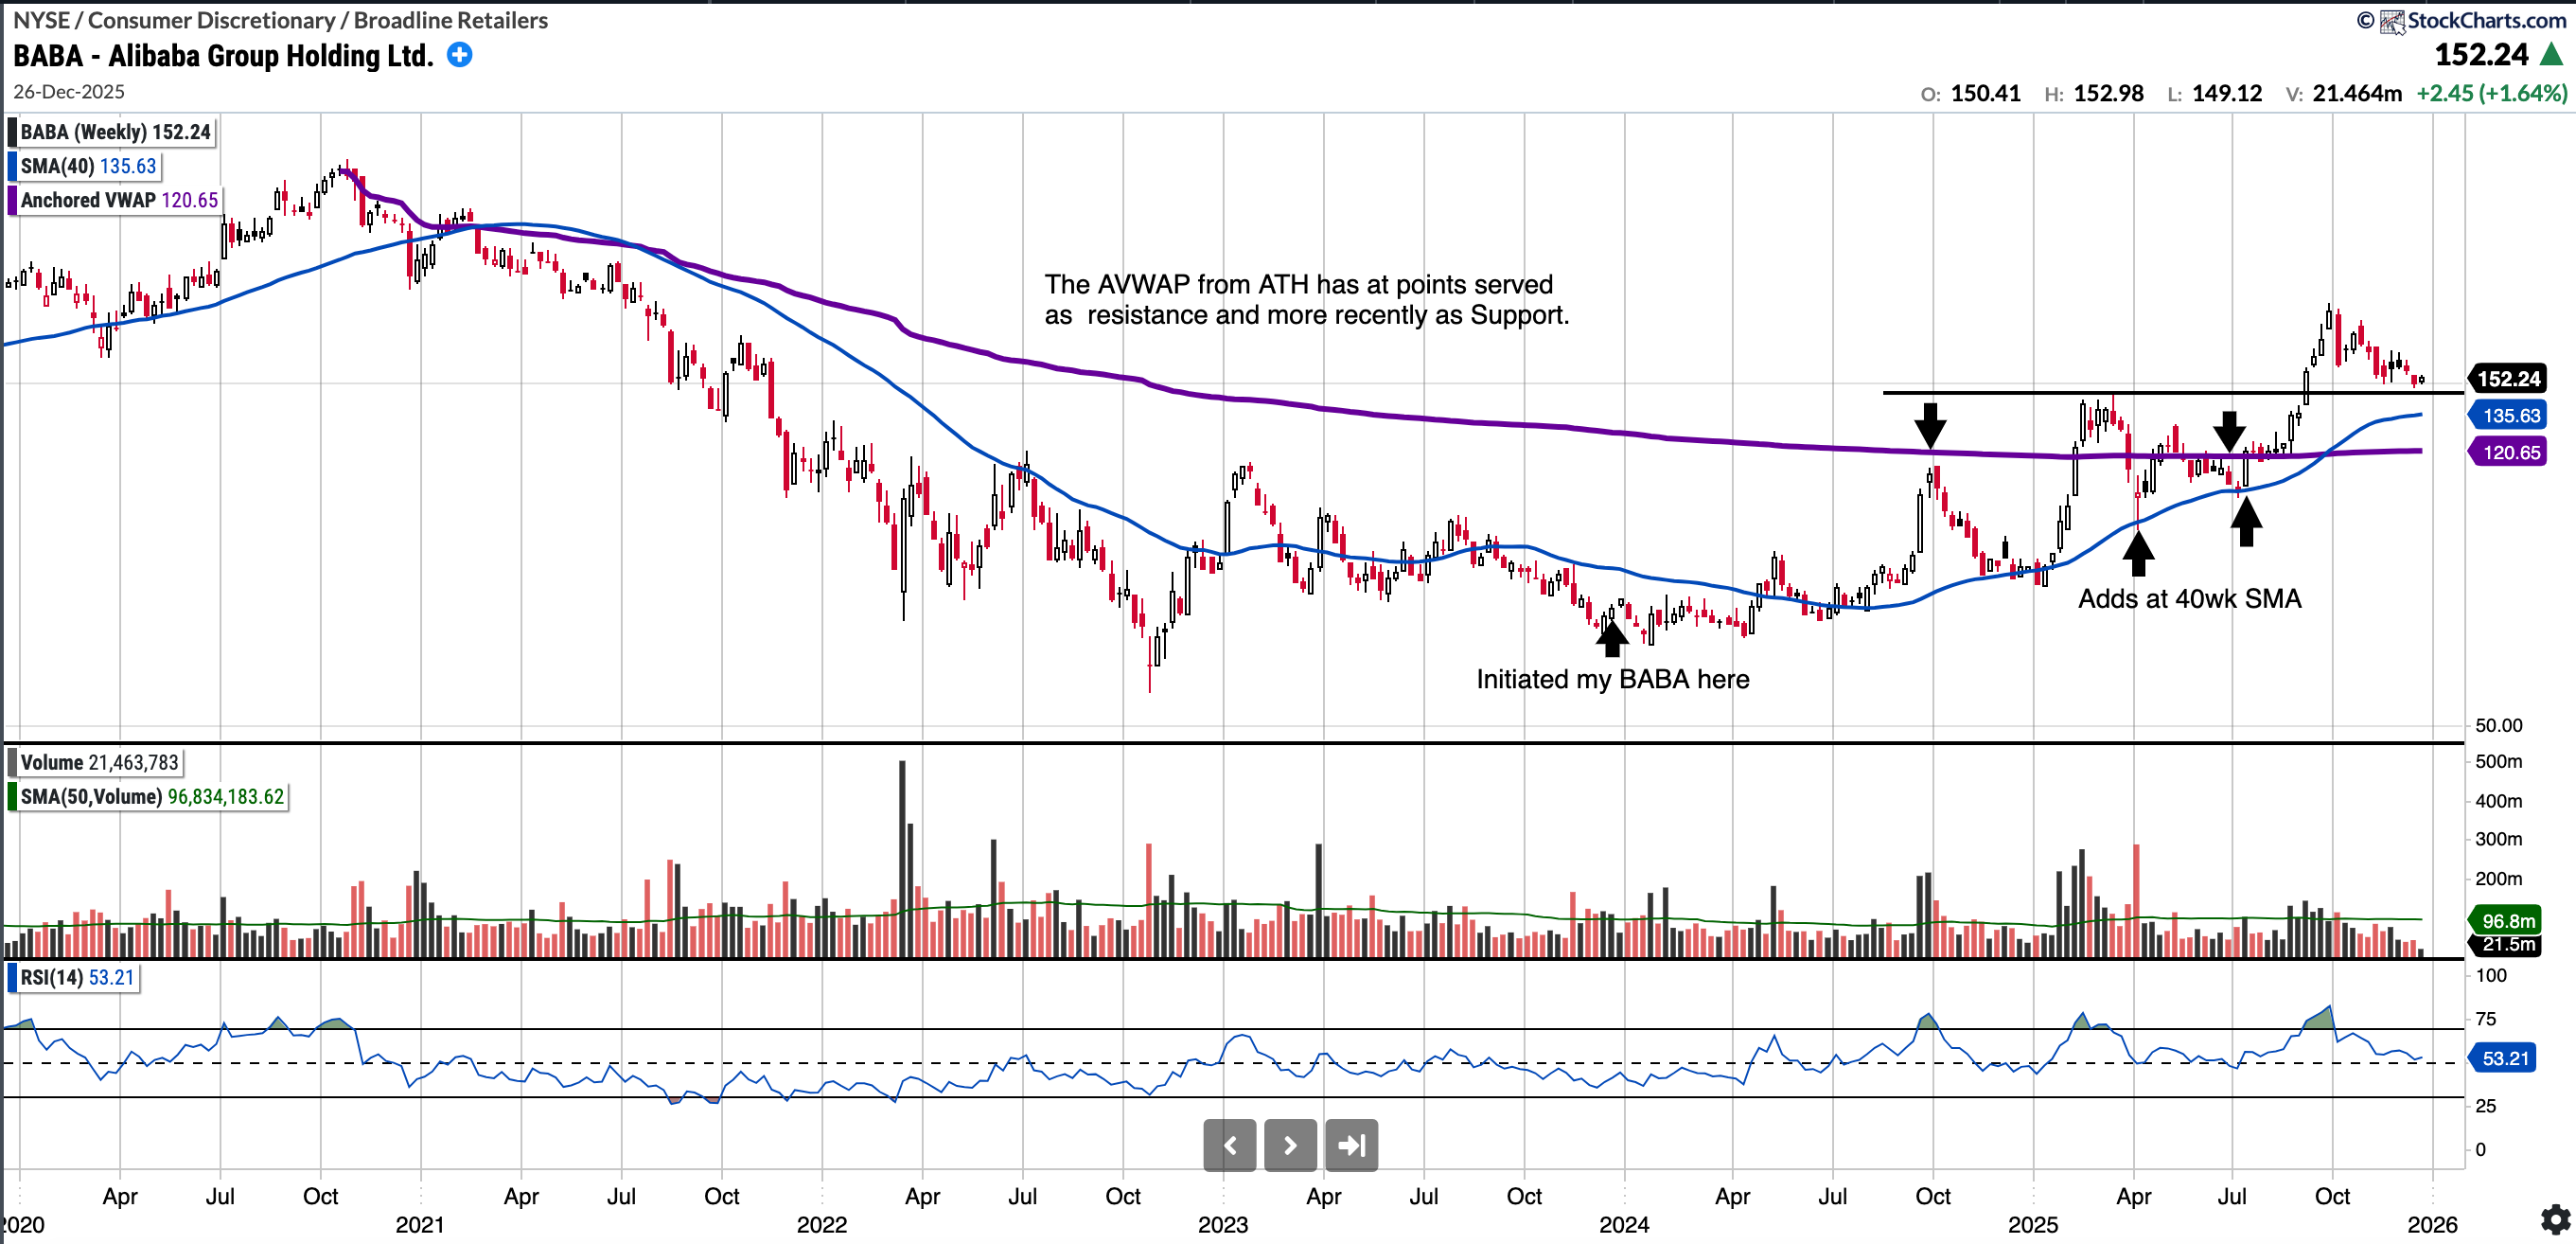
BABA (currently Long)
Currently trades at $152.24, 5.35% below the 50SMA and 11.53% above the 200SMA.
RSI 45.04 (daily chart)
+76.33% YTD
I continue to feature BABA because I like the way BABA stock is consolidating with price compression above the 145 breakout level. I will be looking to see if it can hold the $145 support level, below that the SMA 200 and the AVWAP from ATH which has more more recently served as support. The AVWAP sits at 120.65. I am looking to slowly accumulate more.
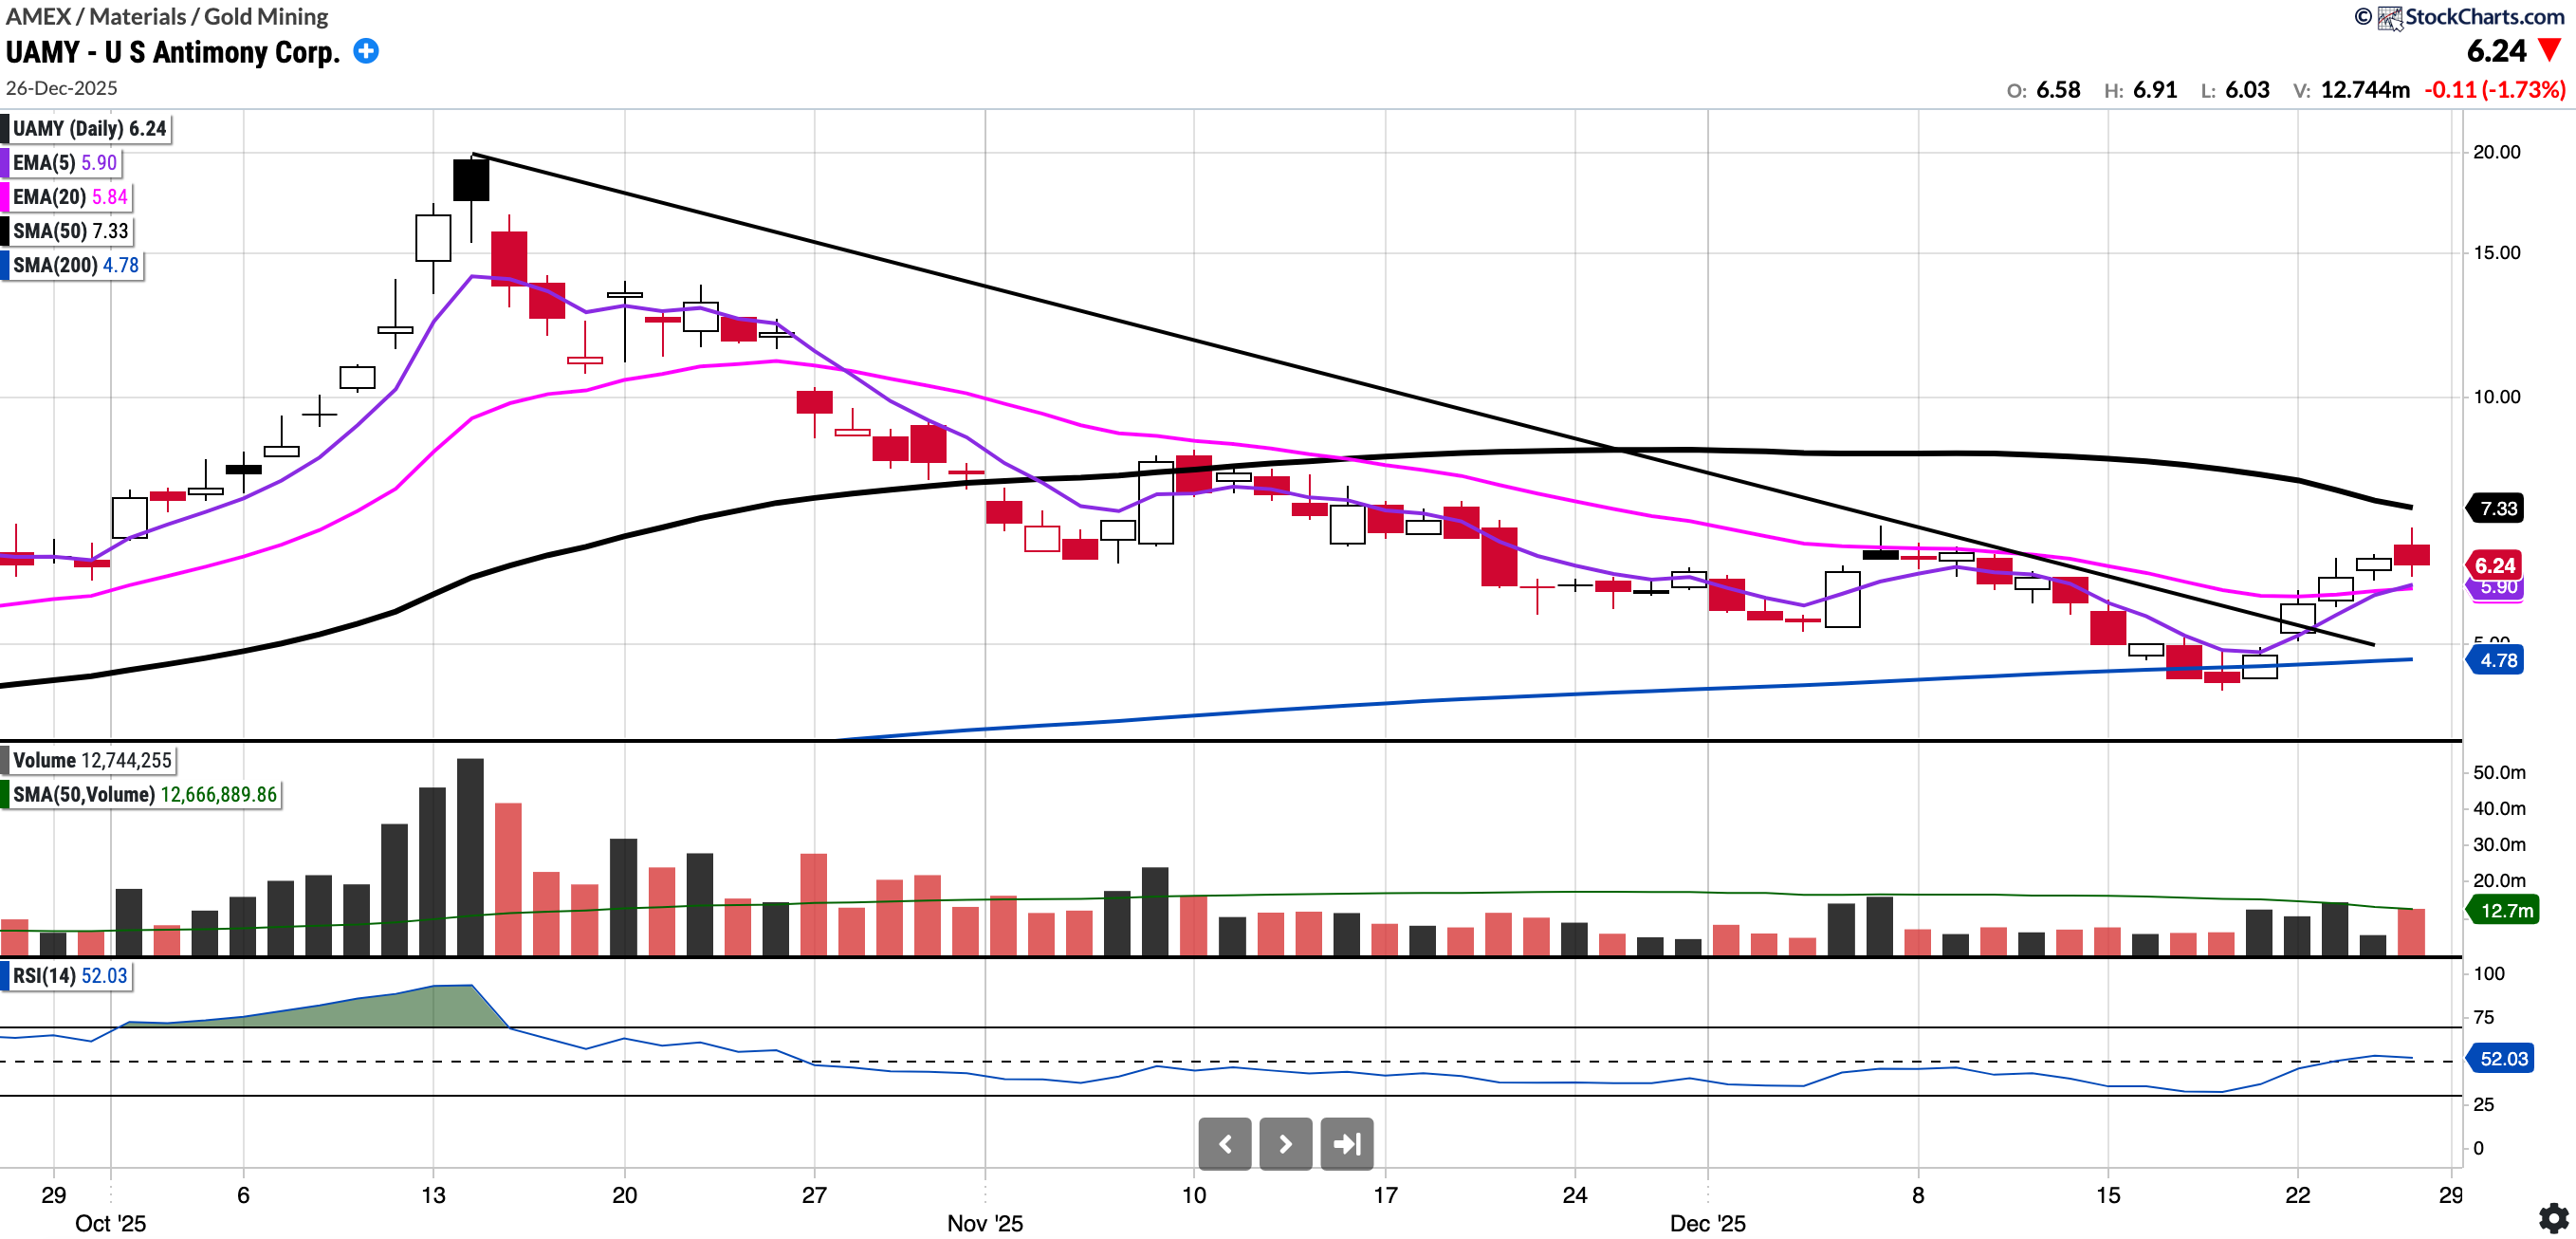
UAMY
Currently trades at $6.24, 14.89% below the 50SMA and 30.57% above the 200SMA.
RSI 52.03 (daily chart)
+260.69% YTD
UAMY (US Antimony Corp) is the only fully integrated antimony producer and smelter in North America. They restarted domestic mining this year.
They recently secured two five-year contracts. These include a $245M deal with the Defense Logistics Agency (DLA) for high-purity antimony and a $107M commercial agreement for industrial antimony trioxide.
Part of the bull case is on the US government continuing to prioritise domestic mineral independence in coming years. If they meet their $125M revenue target for 2026, the current valuation could be a decent entry point. This is one to have on the watchlist.
Notable portfolio changes in previous week (all updated live in subscriber channels):
