
Preview of the Week Ahead
W/C Jan 5, 2026

Hope you all are having a good weekend. Below we will be previewing the upcoming week and providing a portfolio update as usual.
Format for what is covered in this weekly preview:
A look at the indices
Key upcoming economic events
Upcoming earnings reports
Charts
Notable portfolio changes from the previous week
Current Portfolio Holdings (Position size, cost basis, and commentary on each holding regarding the intended holding period and any planned activity)
Closing Thoughts
I highly recommend checking out the latest Monthly Portfolio and Performance Update (TWR +390.37% since Jan ‘23), as well as my post below covering the stocks and setups I like heading into 2026.


Note, taking on board the feedback from the Six Sigma Research poll, I have extended a discount on the annual membership (long term games with long term people).
This saves approximately 30% compared to the monthly rate and is more than 45% cheaper than the Substack app price. This offer will be available for the next month.
Click below to claim :
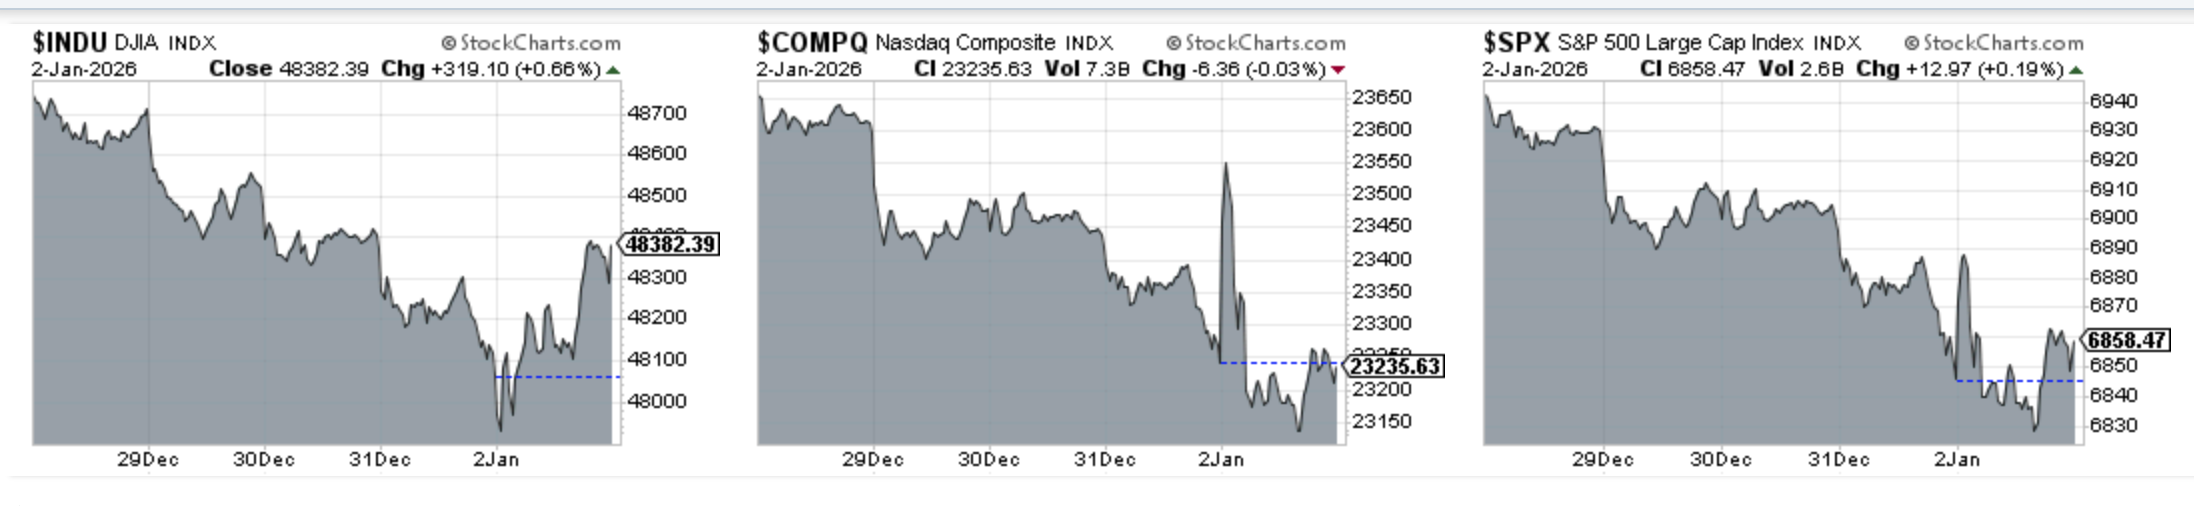
Indices
Dow Jones declined 0.64% in the last week
S&P 500 declined 1.16% in the last week
Nasdaq Composite declined 1.74% in the last week
IWM declined 1.12% in the last week
Key upcoming economic events:
Monday, January 5
ISM Manufacturing PMI (10:00 AM ET)
Richmond Fed President Tom Barkin Speech (8:00 AM ET)
Total Vehicle Sales
Tuesday, January 6
Fed President Barkin Speaks (1:00 PM ET)
API Weekly Crude Oil Stock (4:30 PM ET)
Wednesday, January 7
ADP Employment Change (8:15 AM ET)
ISM Services PMI (10:00 AM ET)
JOLTS Job Openings (10:00 AM ET)
MBA Mortgage Applications (7:00 AM ET)
Thursday, January 8
Weekly Initial Jobless Claims (8:30 AM ET)
U.S. Trade Balance (8:30 AM ET): (Delayed October data)
Wholesale Inventories (10:00 AM ET)
Friday, January 9
December Employment Situation -Jobs Report (8:30 AM ET):
Consensus: ~55,000 jobs created.
Unemployment Rate: Expected to edge down slightly to 4.5%.
University of Michigan Consumer Sentiment (10:00 AM ET)
Housing Starts & Building Permits (8:30 AM ET)
The CES is also on this week in Las Vegas between the 6th of Jan and 9th of Jan.
Upcoming Earnings
There is no company in my portfolio or watchlist reporting this week. Below is the infographic by Earnings Whispers:

Charts
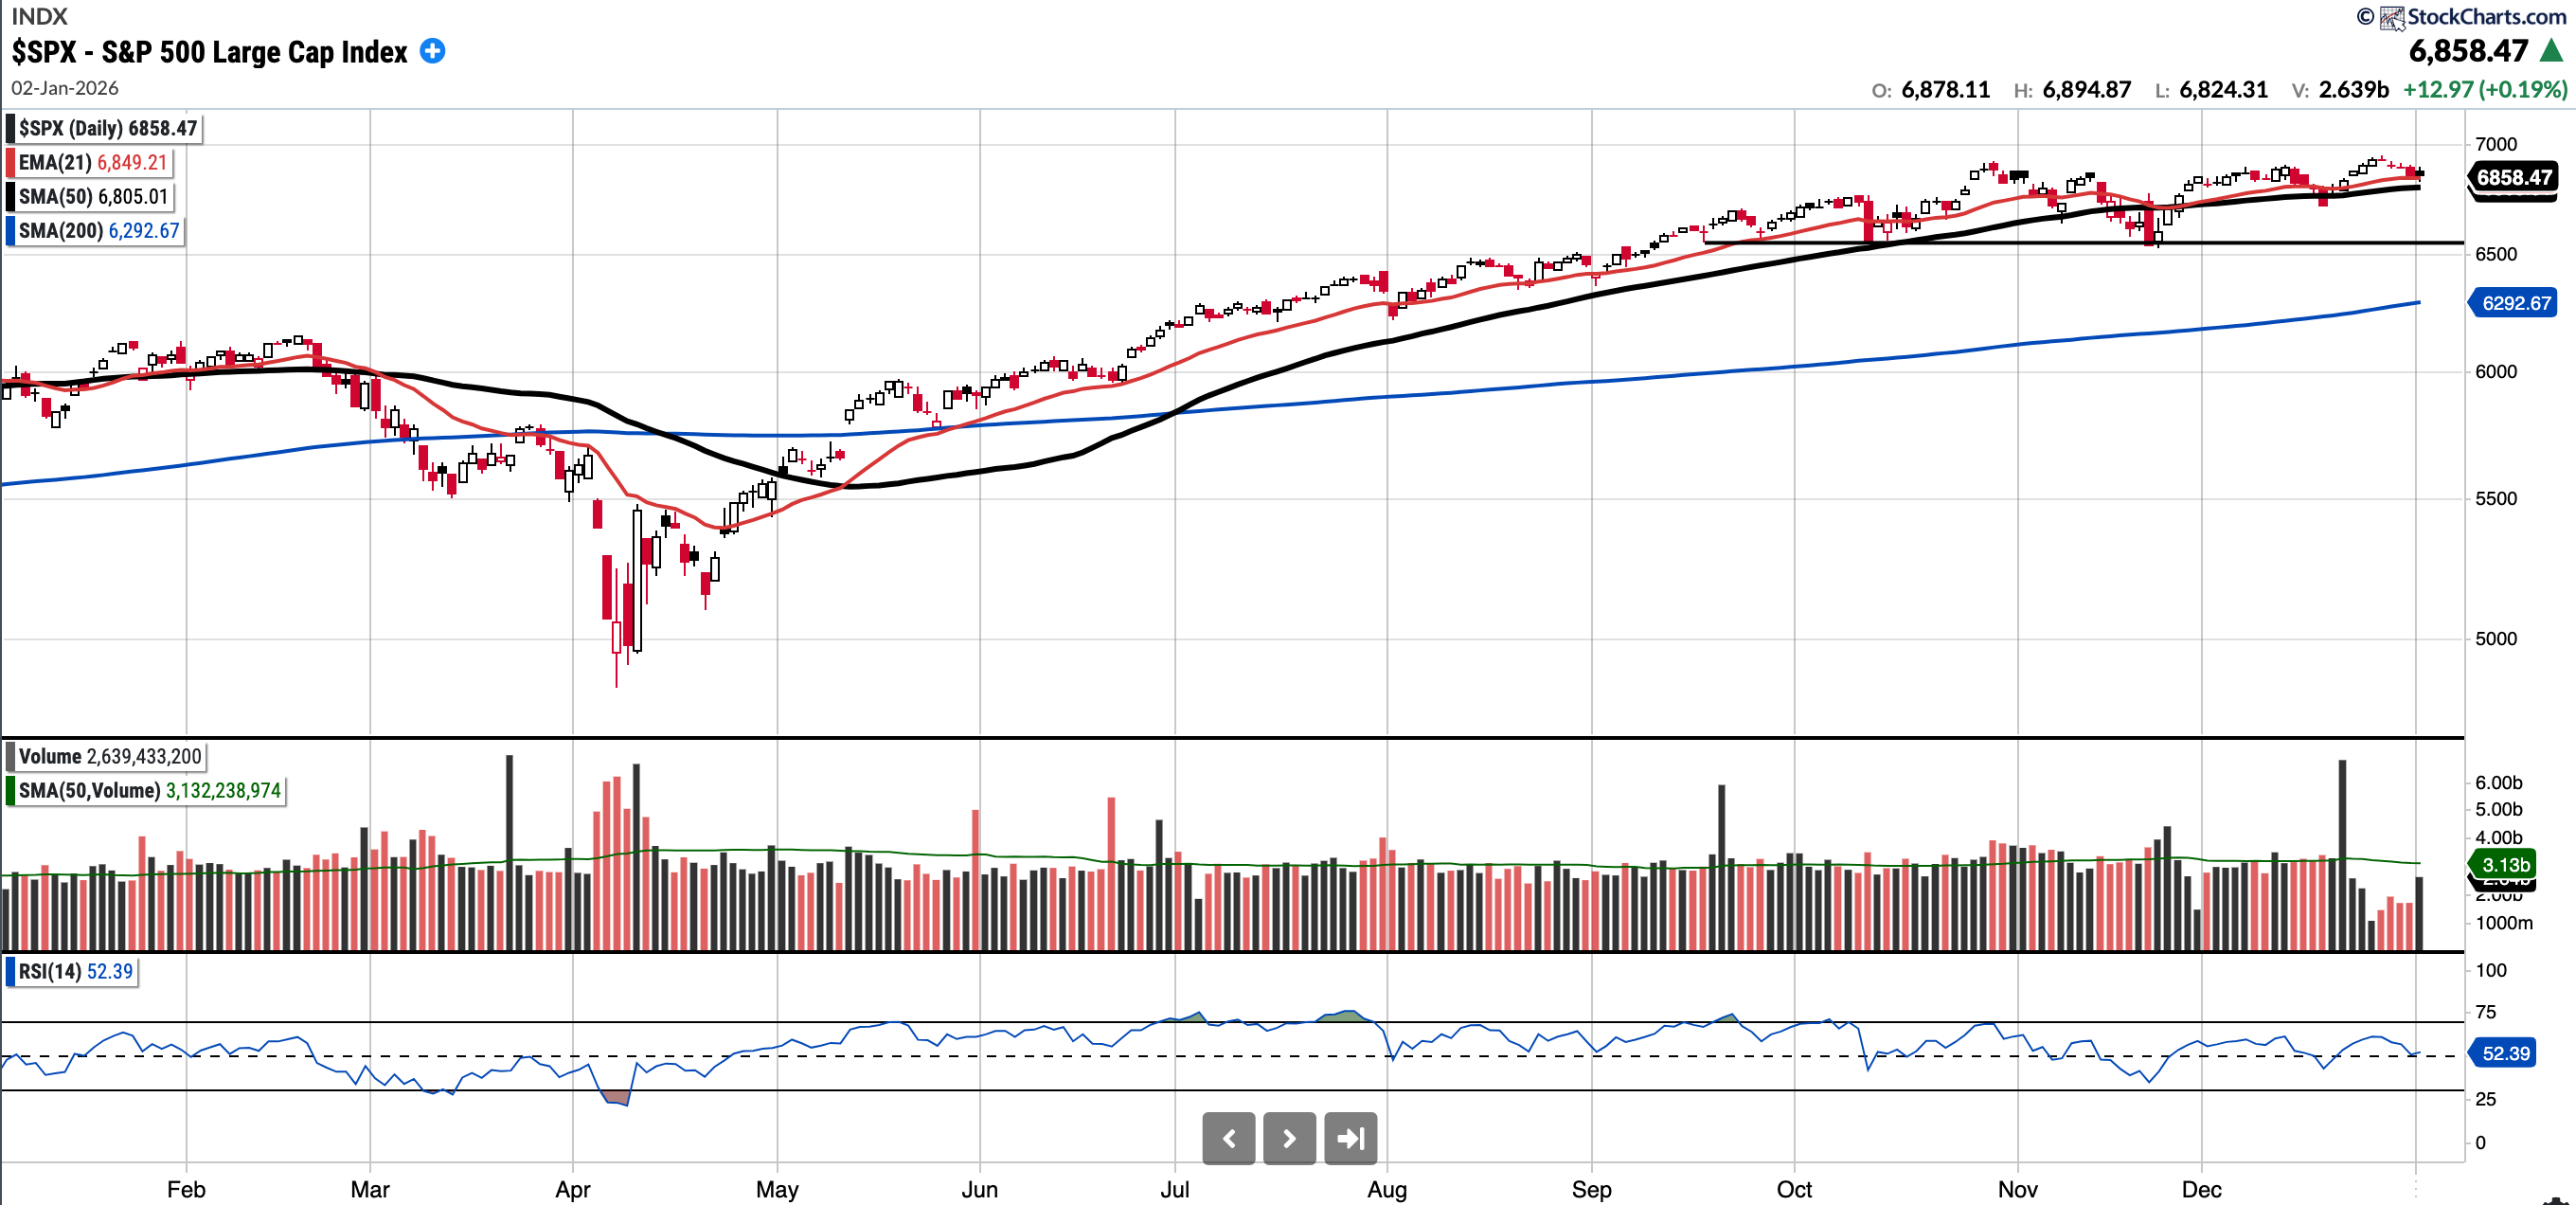
SPX
Currently trades at 6858.47, 0.79% above a rising 50SMA and 8.99% above the 200SMA.
RSI 52.39
-0.29% YTD
Distribution days in the last week: 0
The SPX remains above all key MA’s and did reclaim the EMA 21 to end the week.
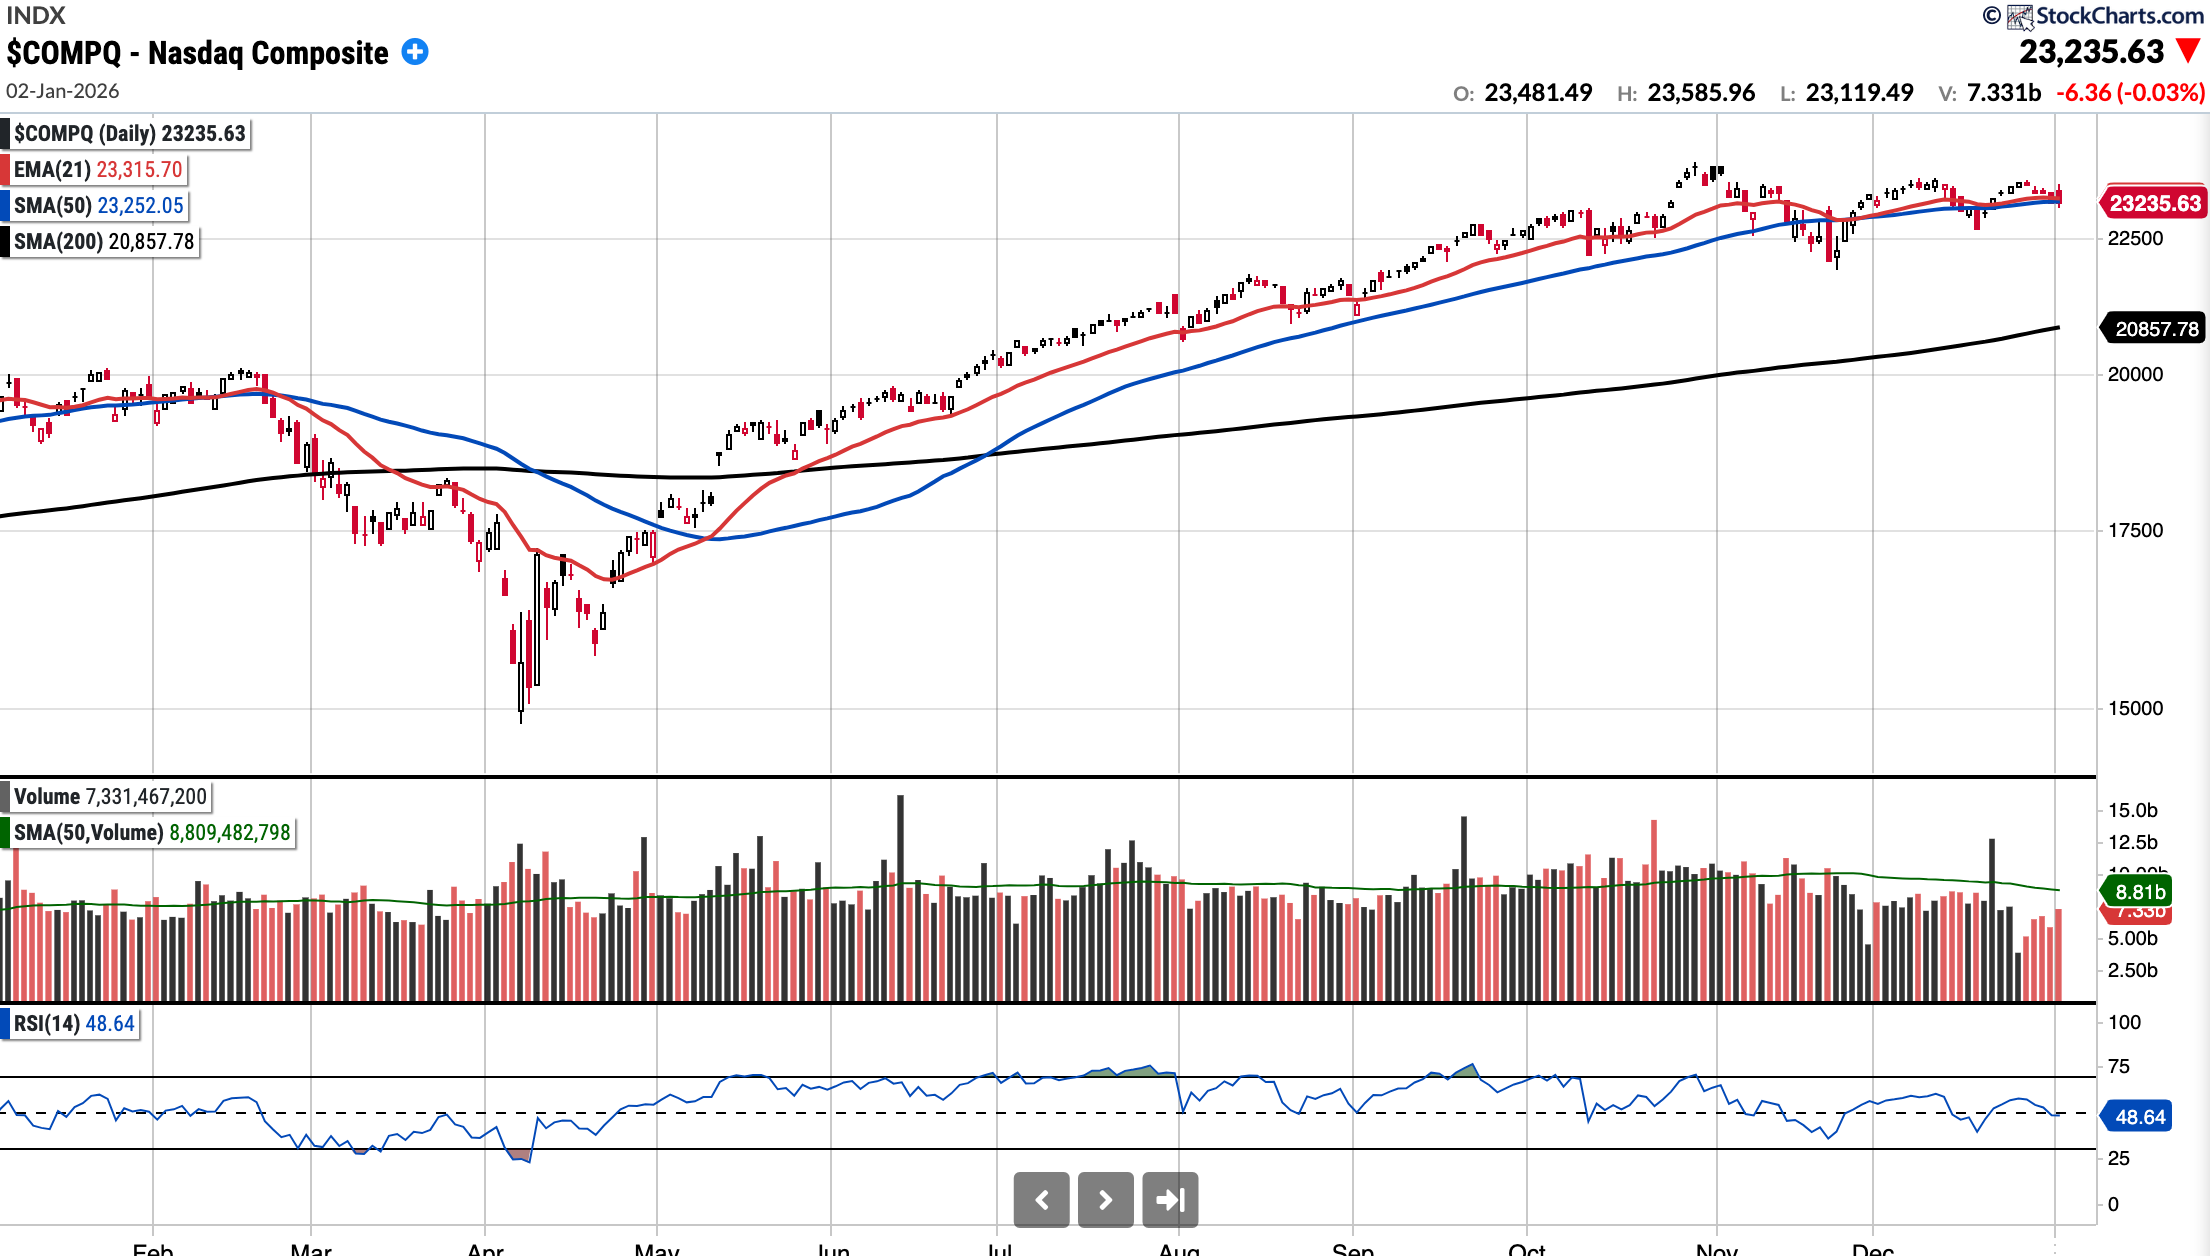
COMPQ
Currently trades at 23,235.63, 0.07% above a rising 50SMA and 11.40% above 200SMA.
RSI 48.64
-1.05% YTD
Distribution days in the last week: 0
Whilst the the Nasdaq Composite remains above key MA’s, it has just logged 5 red days in a row. Furthermore, last week I had mentioned there are unfilled gaps to the upside (23,760) and the downside (23,306) that may be tested. The downside gap was filled this week.
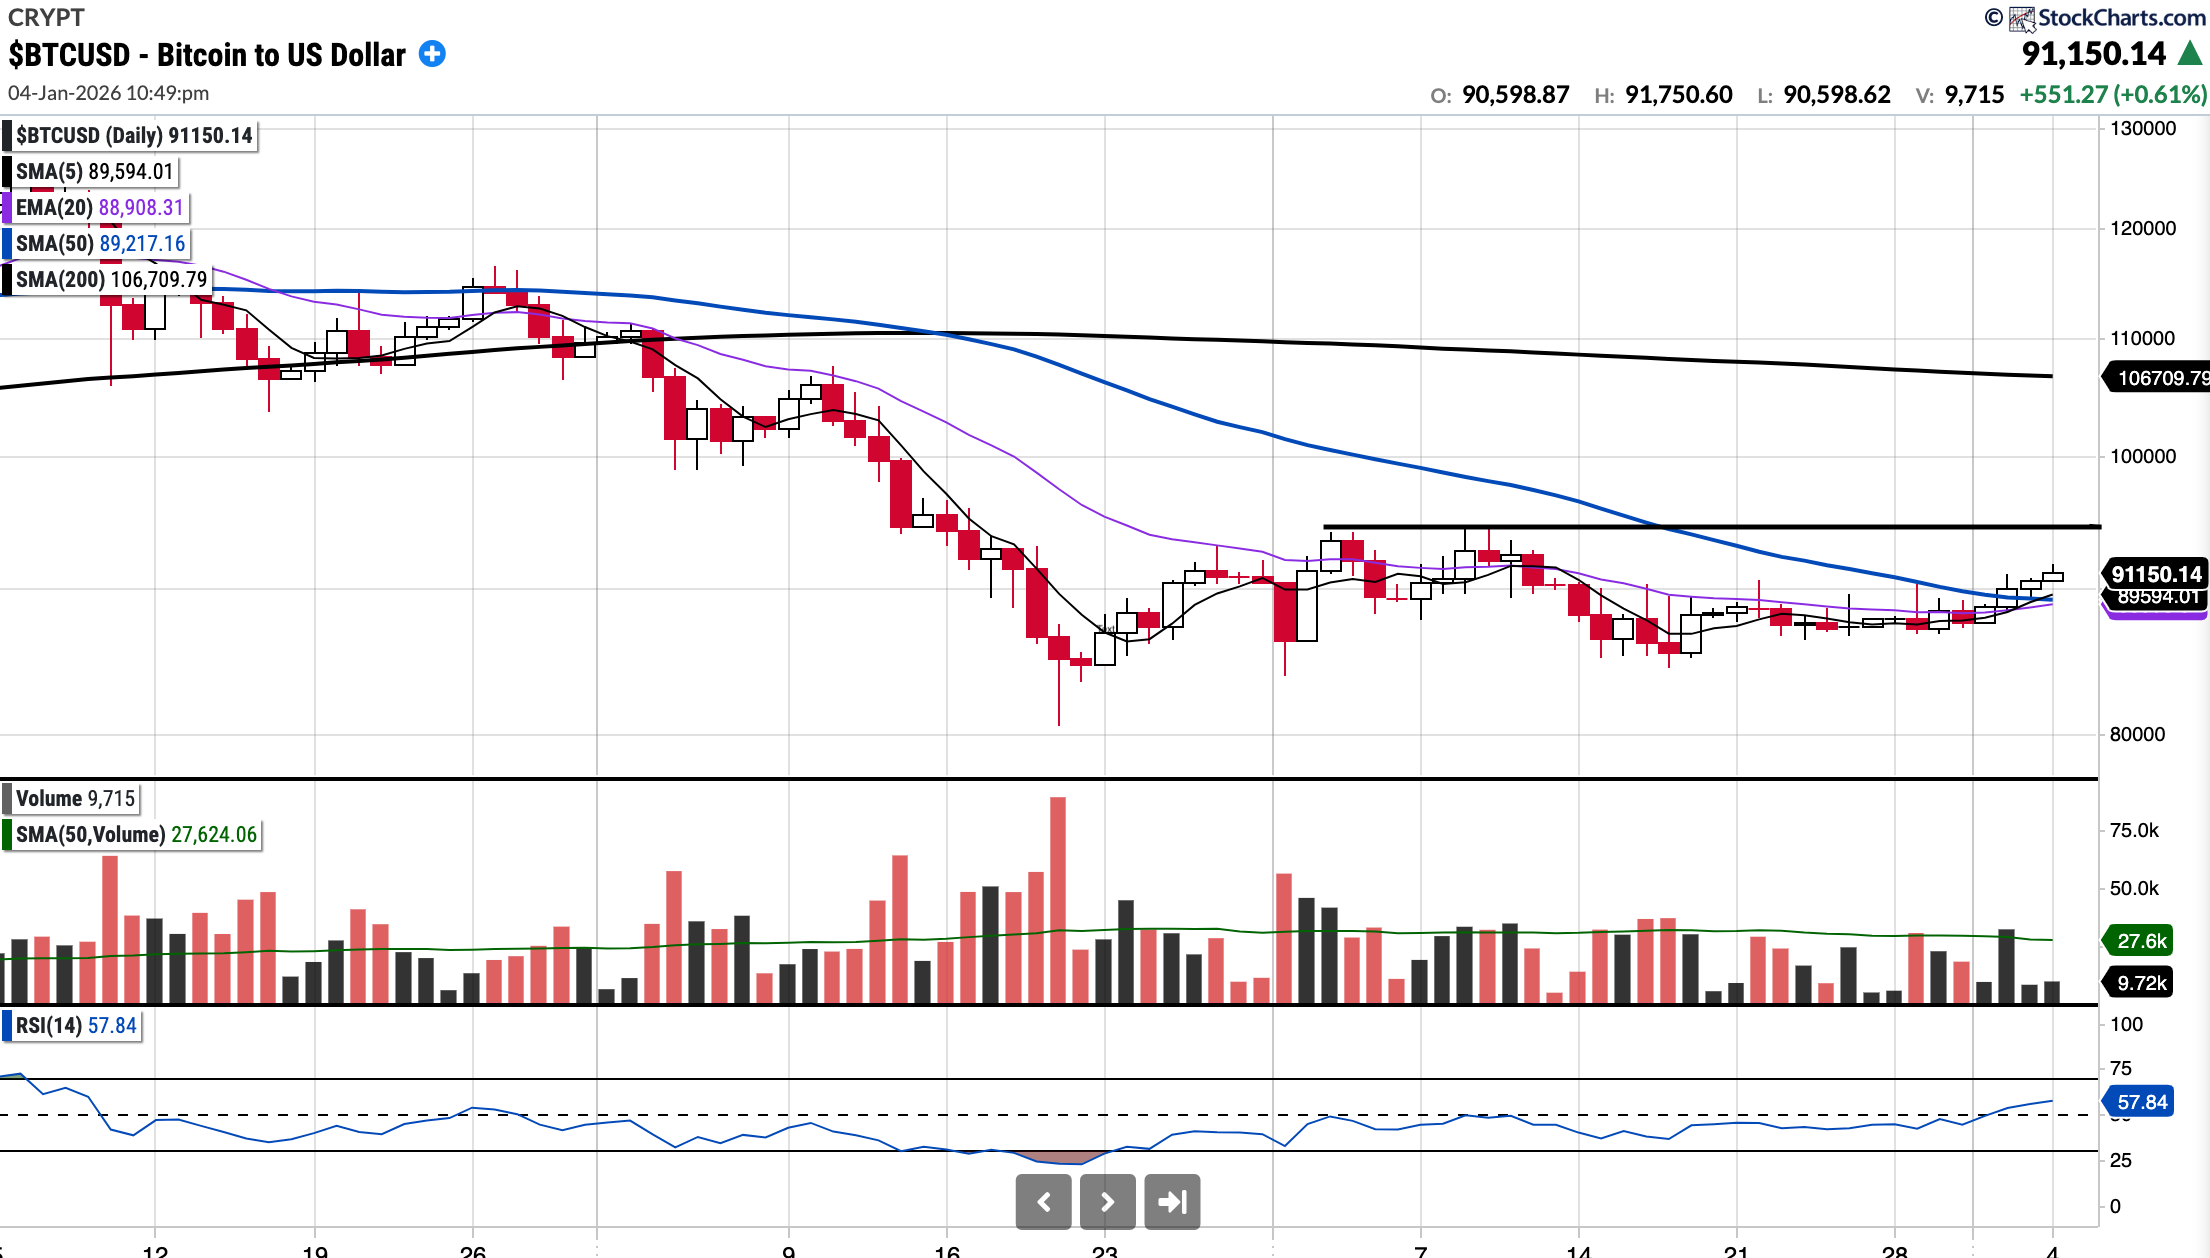
BTC (currently Long)
Currently trades at $91,150.14, 2.17% above the 50SMA and 14.58% below the 200SMA.
RSI 47.84
-6.5% YTD.
BTC is up 3% or so on the week and is starting to look a little more constructive as has reclaimed the SMA 50 and the 5EMA has turned above the 20EMA. Above 94.5k it gets really interesting.
Not holding my breath as the pattern has been such that after any small run, leveraged longs have gotten liquidated.
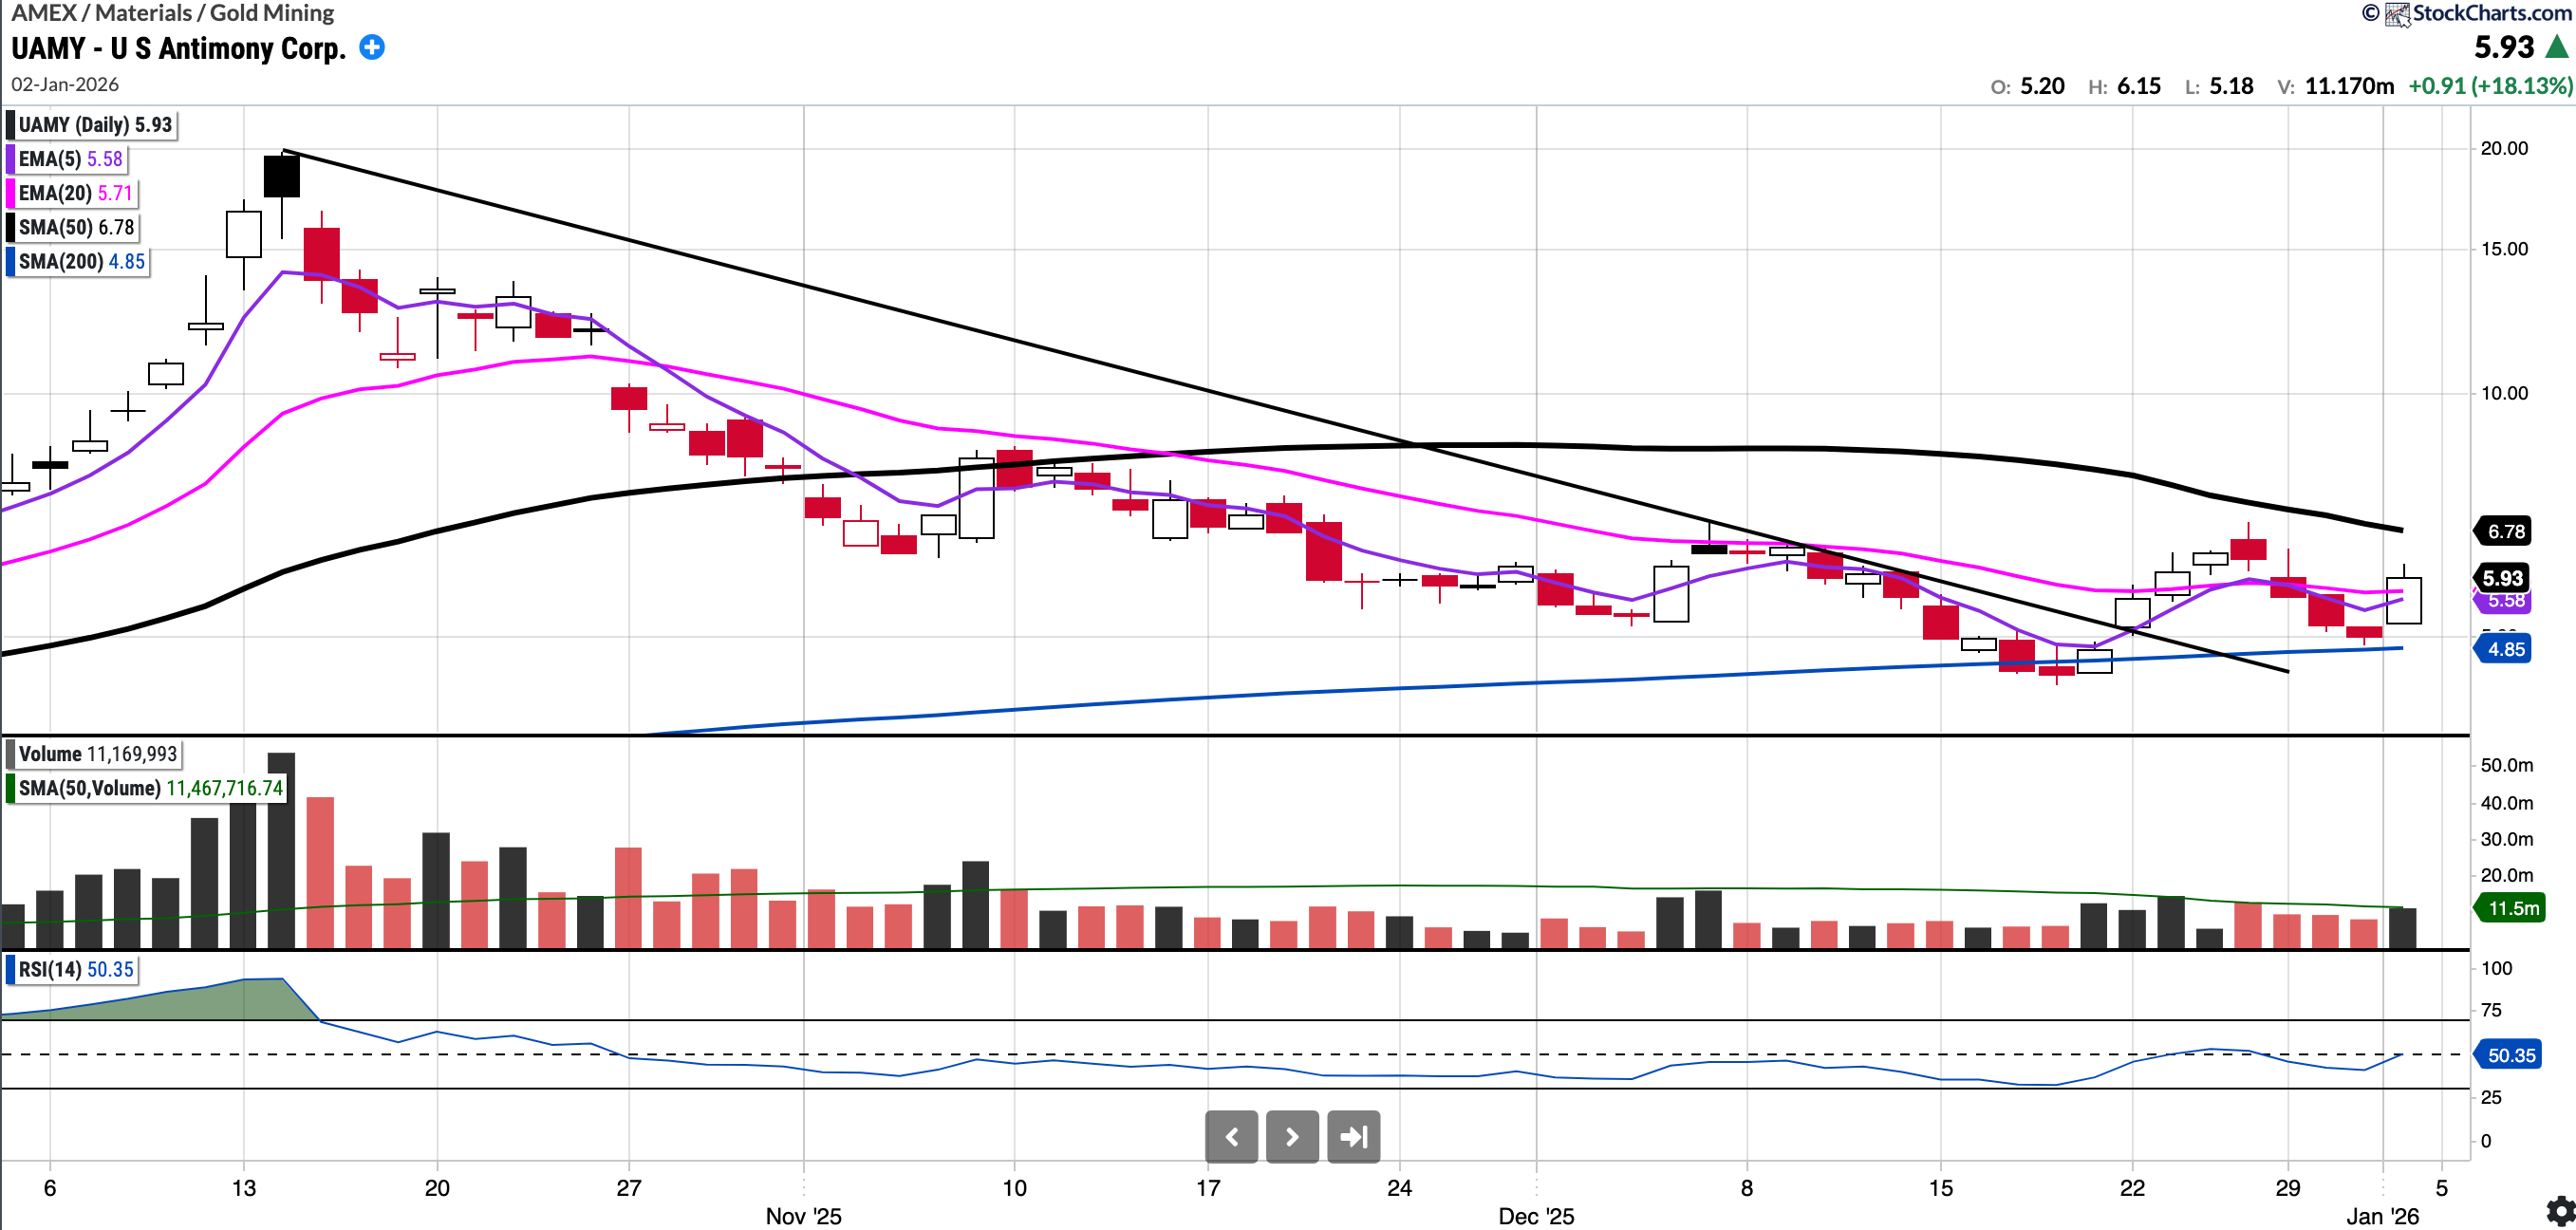
UAMY
Currently trades at $5.93, 12.47% below the 50SMA and 22.16% above the 200SMA.
RSI 50.35 (daily chart)
+18.13% YTD
UAMY (US Antimony Corp) is the only fully integrated antimony producer and smelter in North America. They restarted domestic mining this year.
They have recently secured two five-year contracts one of which includes a $245M deal with the Defense Logistics Agency (DLA) for high-purity antimony, and a $107M commercial agreement for industrial antimony trioxide.
The bull case for this stock is built on the U.S. government’s continued prioritization of domestic mineral independence. Given the recent capture of Maduro in Venezuela and President Trump’s repeated emphasis on rare earth security, this remains a compelling stock for the watchlist.
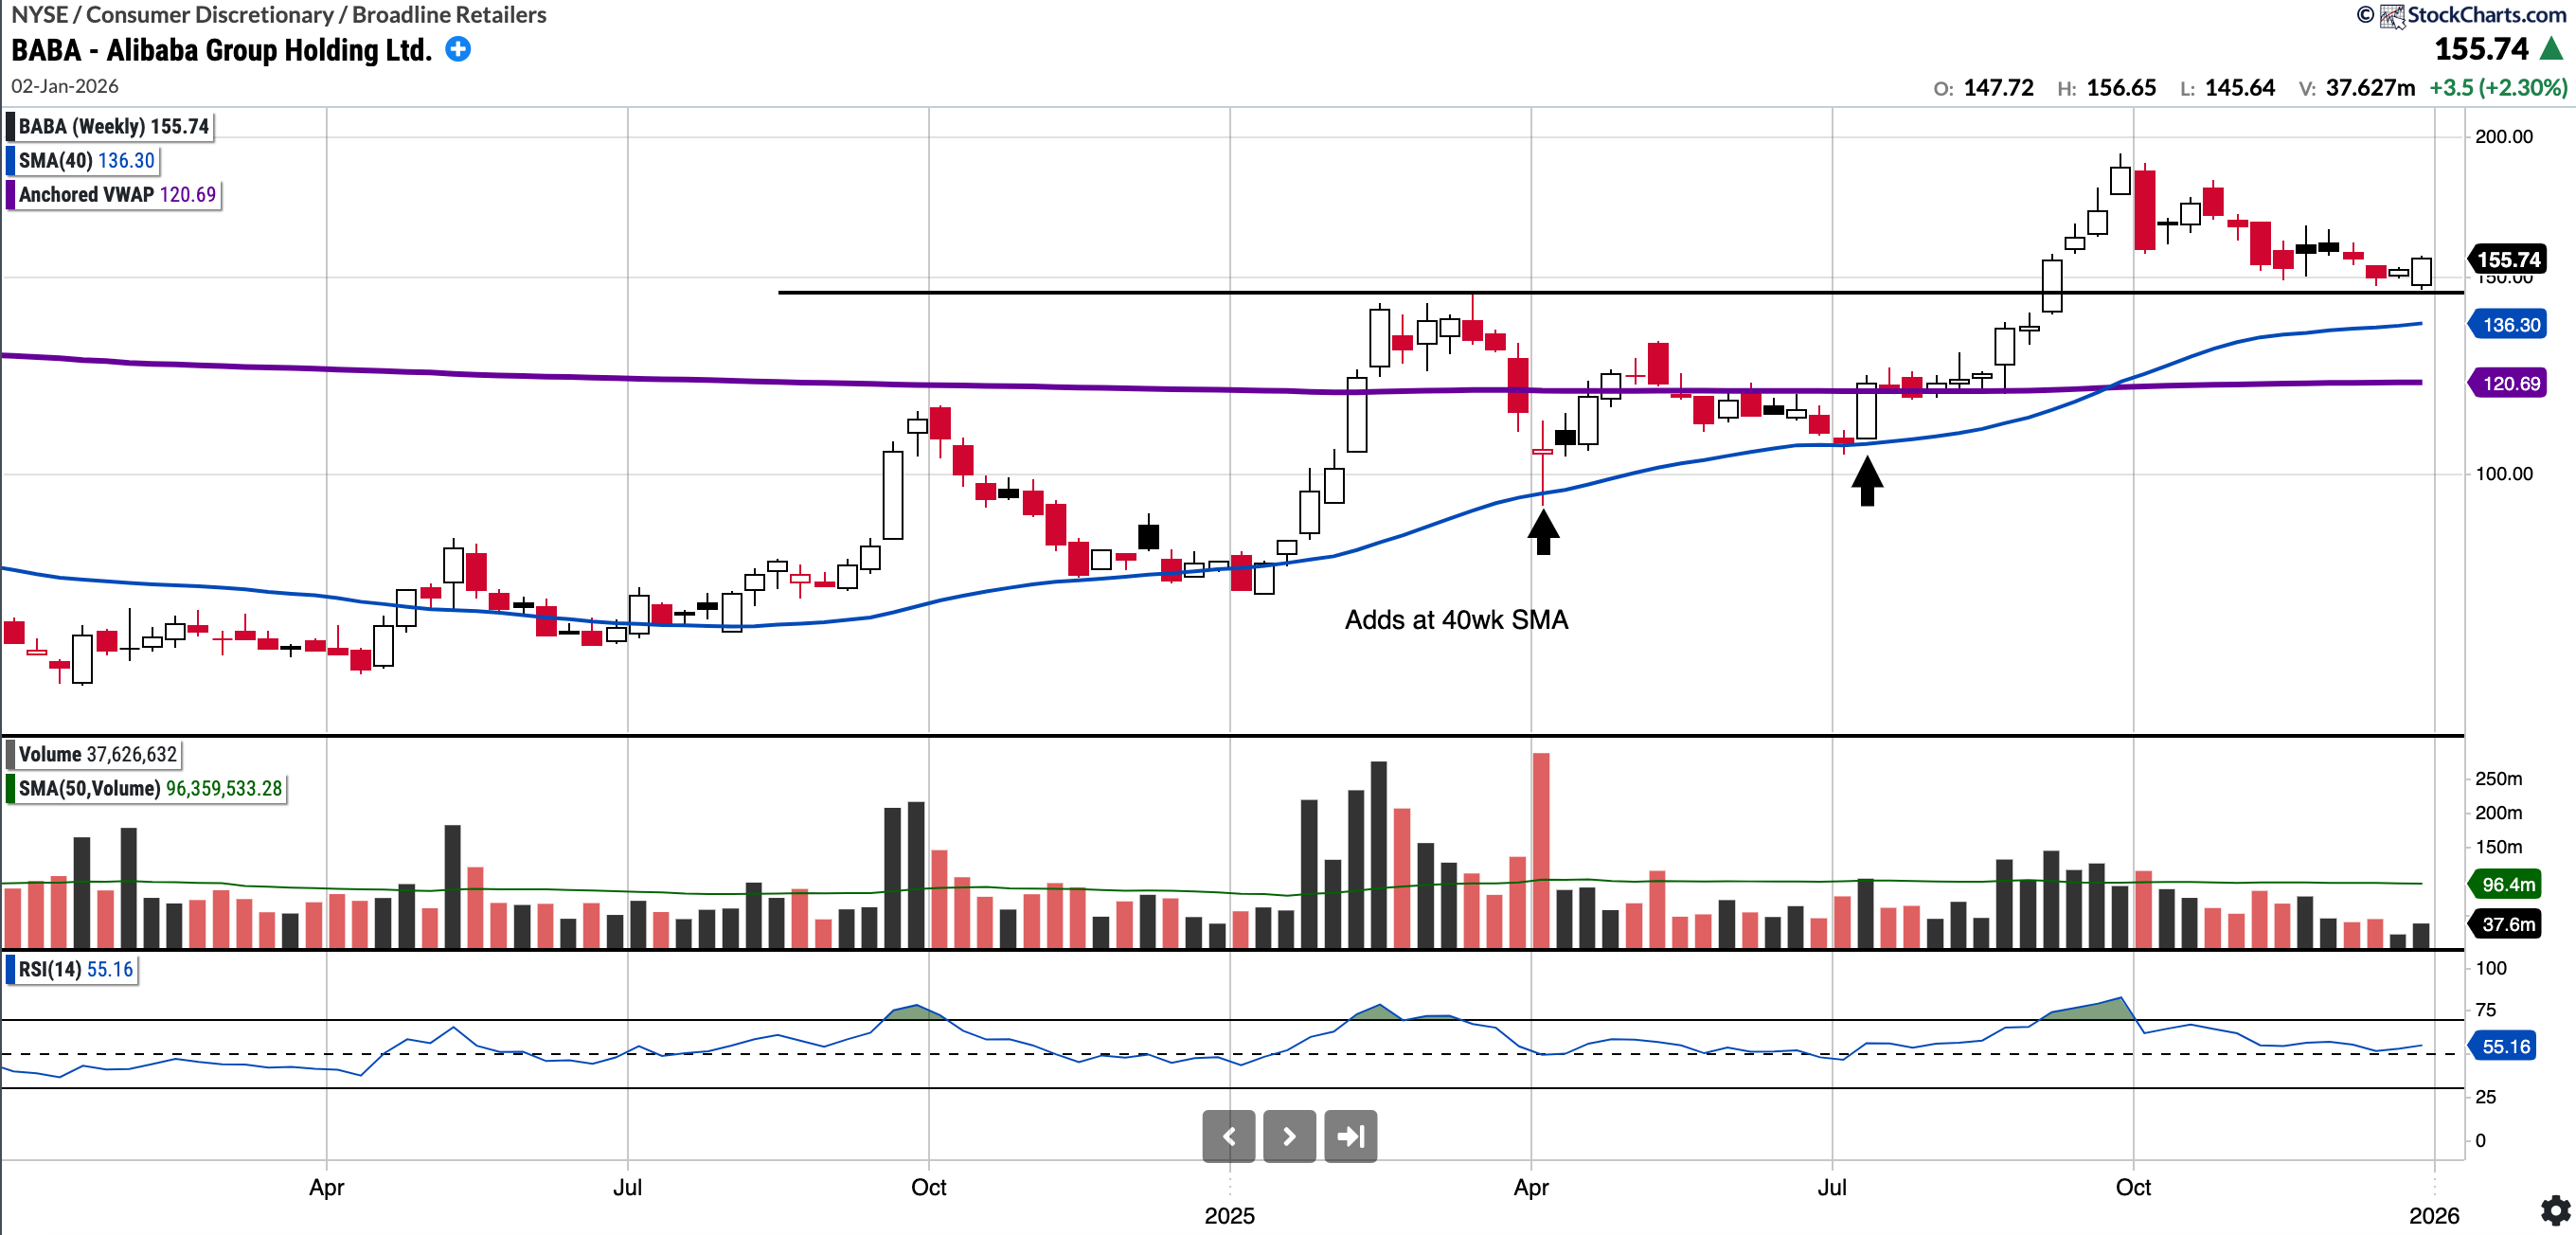
BABA (currently Long)
Currently trades at $155.74, 2.27% below the 50SMA and 13.91% above the 200SMA.
RSI 53.01 (daily chart)
+6.25% YTD
BABA held exactly where it needed to this week and I like the way BABA stock is consolidating with price compression above the 145 breakout level. I will be looking to see if it can hold the $145 support level, below that the SMA 200 and the AVWAP from ATH which has more more recently served as support. The AVWAP sits at 120.65. I am looking to slowly accumulate more.
The 160 level represents the first major resistance overhead due to the descending moving average and upper Bollinger Band. If the price breaks above this, I believe it could test 180.
Notable portfolio changes in previous week (all updated live in subscriber channels):
Nil notable changes.
Note that I have separated my accounts: my main Investment Account is shown below, alongside a separate, smaller Trading Portfolio. Read this post for more details.
Current Positions in Size Order with Cost Basis:
