Preview of the Week Ahead
W/C November 24, 2025
Hope you all are having a good weekend. Below we will be previewing the upcoming week and providing a portfolio update as usual.
Format for what is covered in this weekly preview:
A look at the indices
Key upcoming economic events
Upcoming earnings reports
Charts
Notable portfolio changes from the previous week
Current Portfolio Holdings (Position size, cost basis, and commentary on each holding regarding the intended holding period and any planned activity)
Ensure you check out the most recent Monthly Portfolio and Performance Update (including Market Overview) below if you have not done so.
If it is your first time here, read the below post on how to navigate the SixSigmaCapital Website and subscribe to the option that suits.
Indices
Dow Jones declined 1.84% in the last week
S&P 500 declined 1.83% in the last week
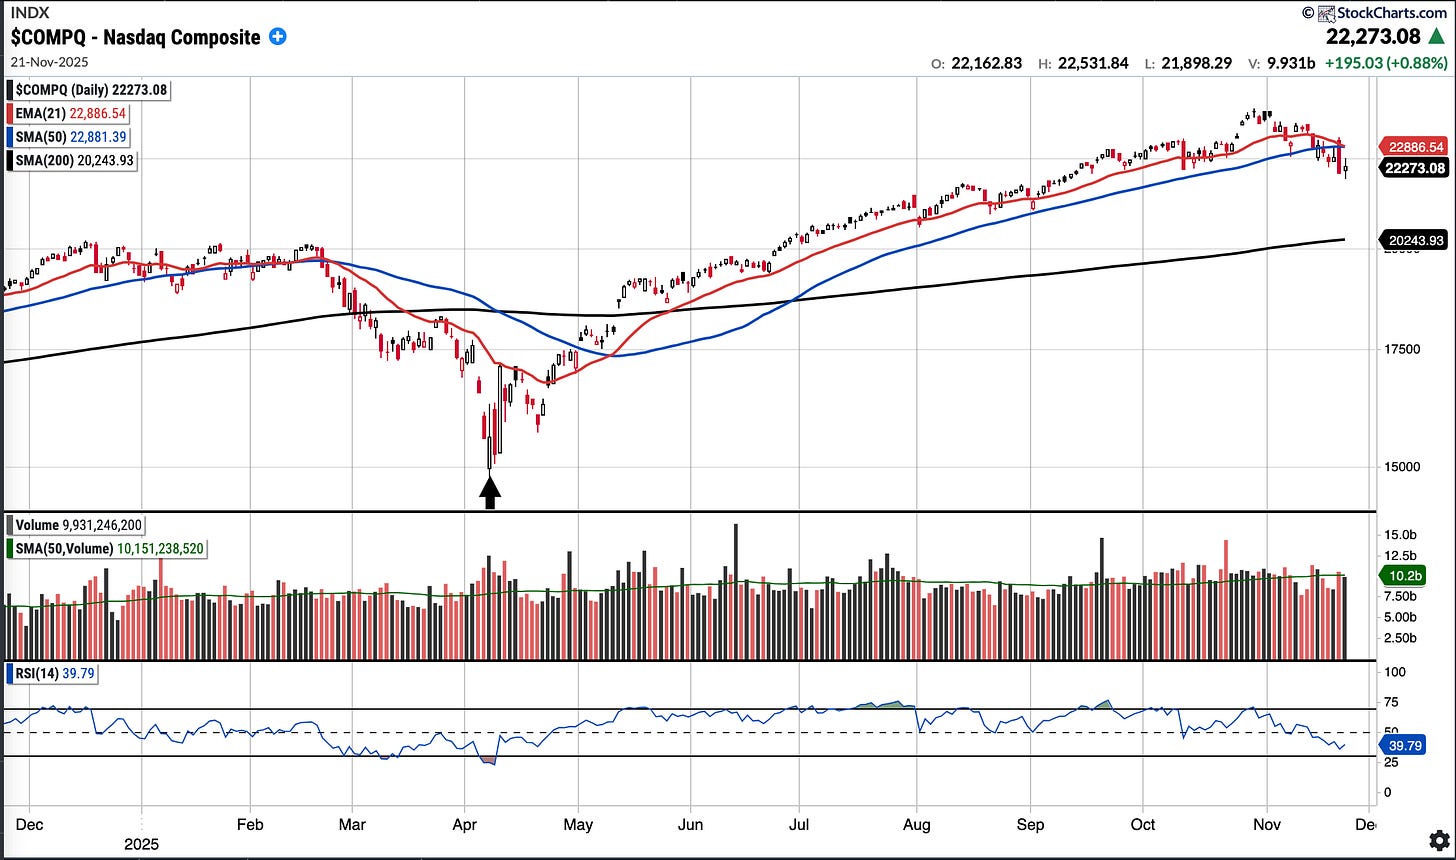
Nasdaq Composite declined 2.66% in the last week
IWM declined 0.46% in the last week
Key upcoming economic events:
Monday, November 24
Dallas Fed Manufacturing Index: A monthly survey of factory activity in Texas.
Tuesday, November 25
Consumer Confidence (Conference Board)
Pending Home Sales from the National Association of Realtors
Richmond Fed Manufacturing Index
Wednesday, November 26
Weekly Initial Jobless Claims
Chicago PMI
Events expected to be Postponed or Rescheduled:
Q3 GDP (2nd Estimate):
PCE Inflation Data
Durable Goods Orders
New Home Sales
Thursday, November 27
Thanksgiving: All US Stock and Bond markets are closed
Friday, November 28
Market closes at 1:00pm ET
Upcoming Earnings
While none of my portfolio holdings reported last week, NVDA delivered its highly anticipated results. It was a stellar quarter. See my review below:
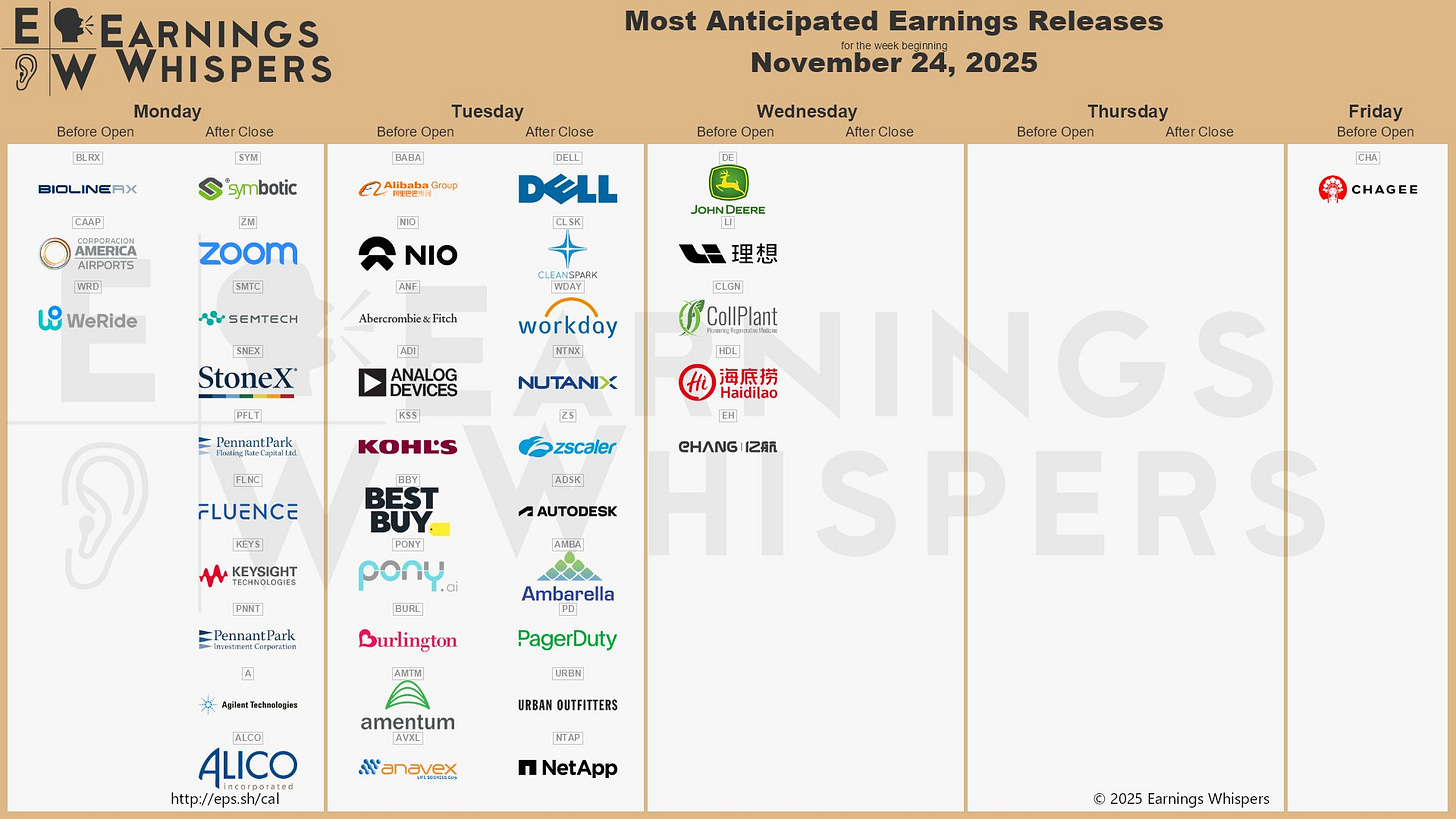
This week I only have Alibaba reporting on Tuesday.
Below is the infographic by Earnings Whispers:
Charts
SPX
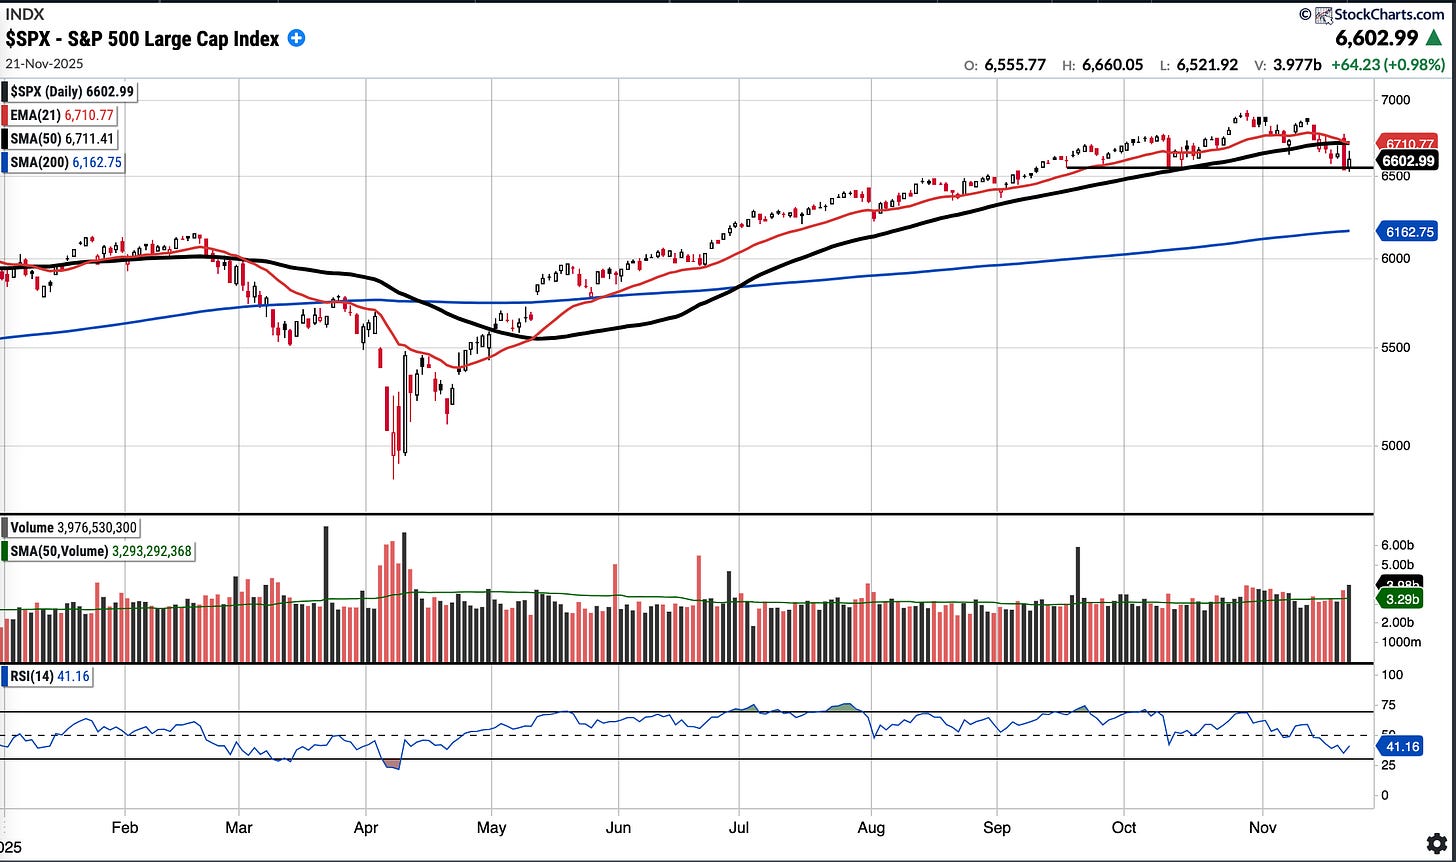
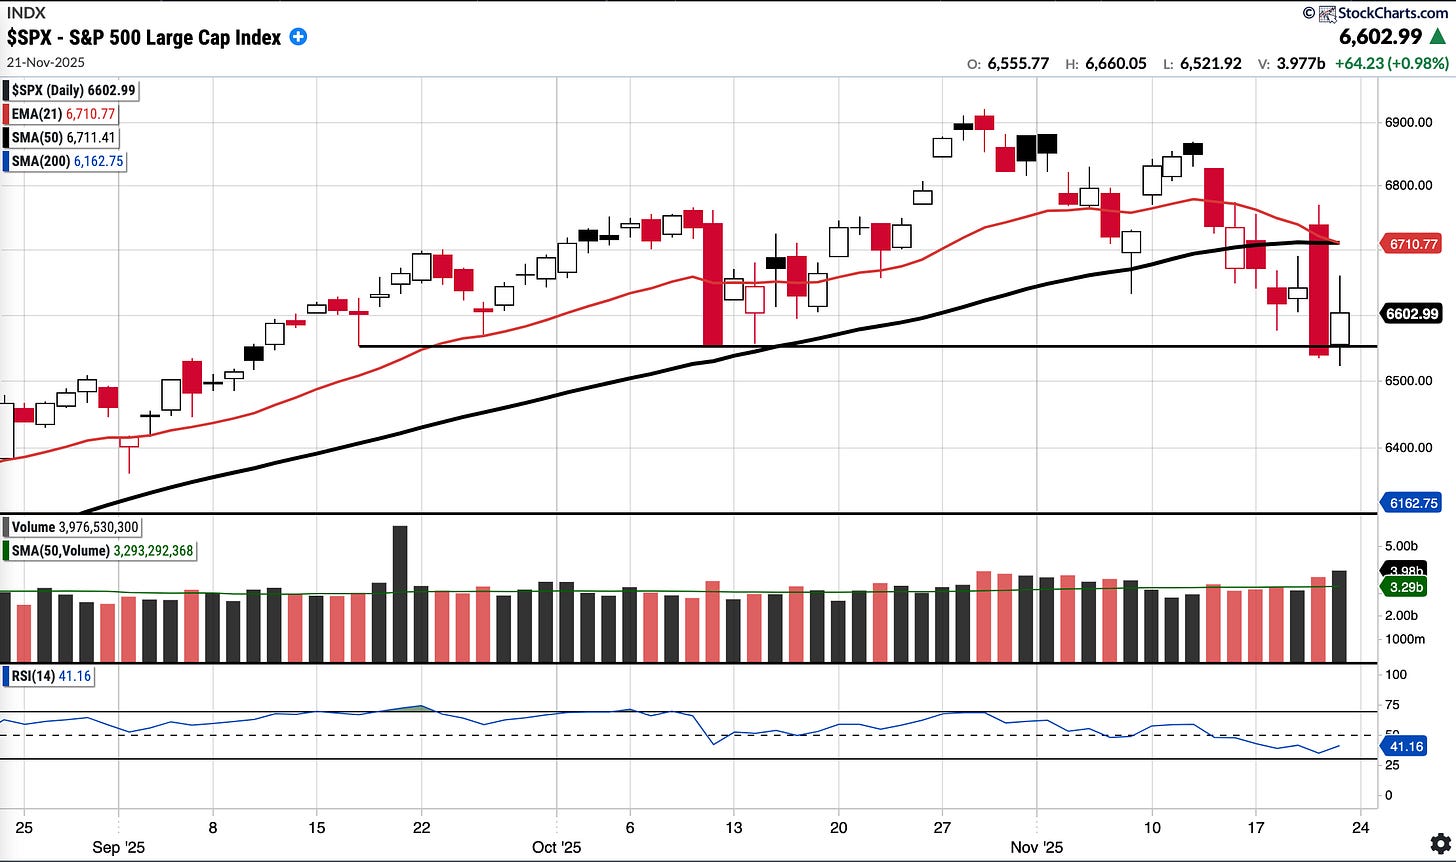
Currently trades at 6602.99, 1.62% below a rising 50SMA and 7.14% above 200SMA.
RSI 41.16
12.51% YTD
Distribution days in the last week: 2
The SPX lost the SMA 50 this week and on Thursday when the markets gapped up post NVDA’s print, it was rejected at that level. Bulls would like to see the SMA 50 being reclaimed in due course, if not it could be a long way down to the SMA 200.
The 6550 level seems like a big level on the SPX now: it was the low of the day on the 17th of September, the closing level on October 10, the low of day October 14 and where the SPX opened up on Friday.
COMPQ
Currently trades at 22,273.08, 2.66% below a rising 50SMA and 10.02% above 200SMA.
RSI 39.79
15.52% YTD
Distribution days in the last week: 1
The Nasdaq has just recorded three consecutive red weeks now and similarly to the S&P 500, the Nasdaq Composite failed to hold the SMA 50.
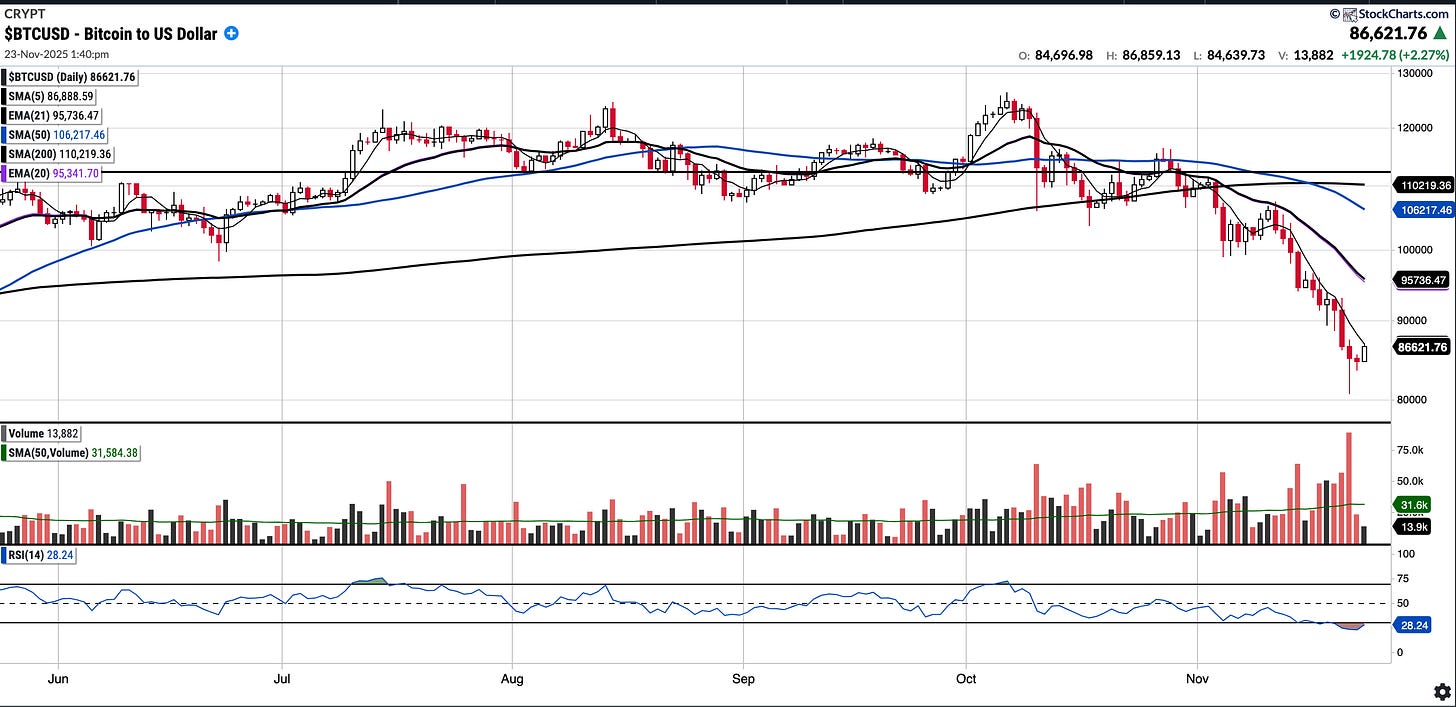
BTC (currently Long)
Currently trades at $86,625.80, 8.25% below the 50SMA and 21.40% below the 200SMA.
RSI 28.38
-8.25% YTD.
BTC has performed poorly since the liquidation event on October 10th and recently printed a death cross. It remains firmly below all key moving averages and the 112k level—a prior support that has now turned into resistance.
The BTC chart requires significant work to look constructive again. Previous bottoms have typically featured a large green candle and a small retest, followed by a subsequent move up.
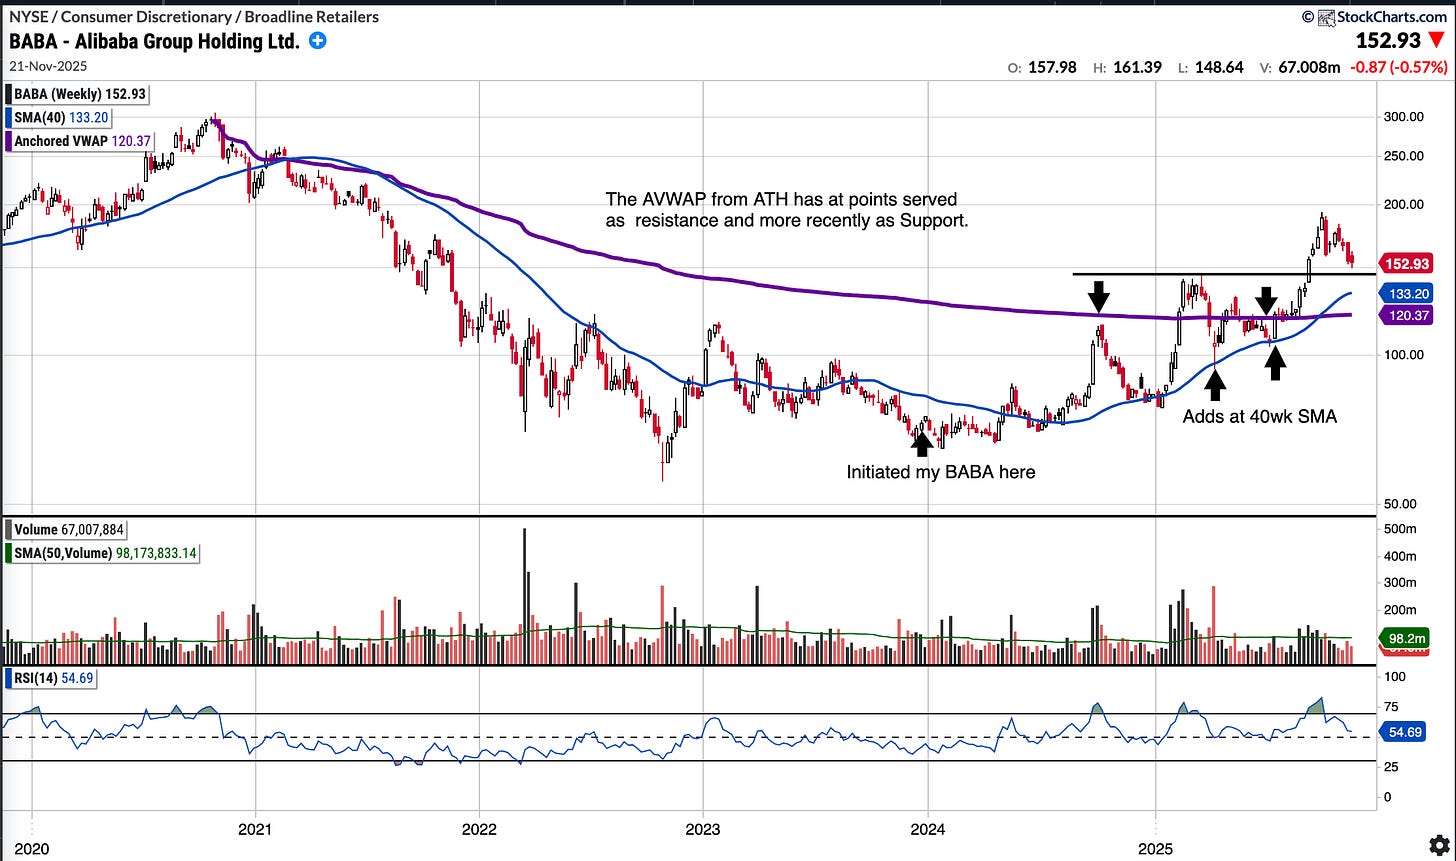
BABA (currently Long)
Currently trades at $152.93, 9.36% below the 50SMA and 13.66% above the 200SMA.
RSI 38.08
+83.07% YTD
The AVWAP from ATH has been a level of interest for the last couple of years for BABA. It has at times served as resistance and more recently as support. The AVWAP sits at 120.37. Otherwise, the 40 week SMA is a level I will likely add to my BABA holdings, especially now that I am down to a small core. Note, BABA does report on Tuesday.
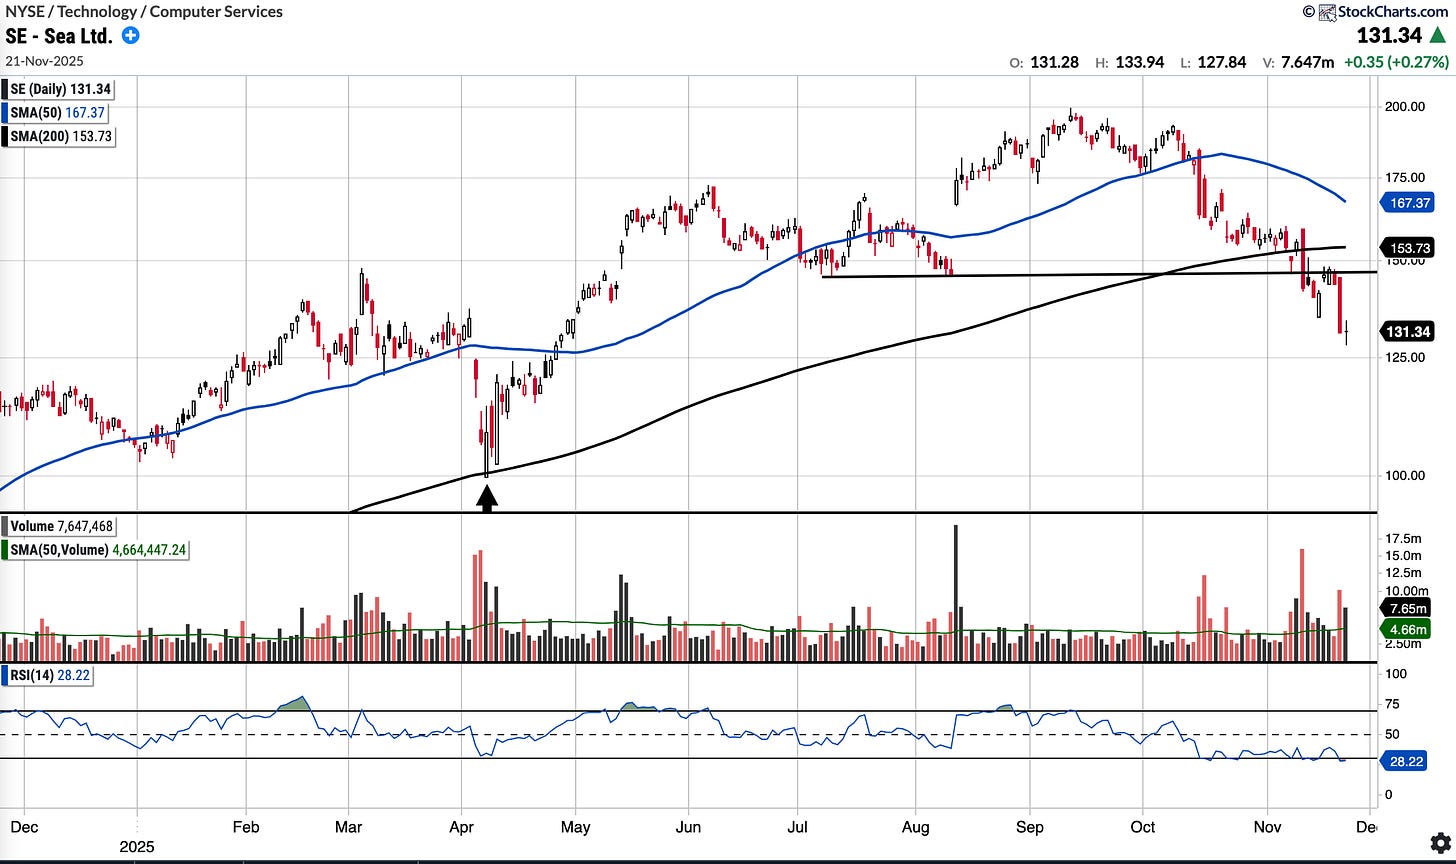
SE (currently Long)
Currently trades at $131.34, 21.53% below the 50SMA and 153.73% below the 200SMA.
RSI 28.22
+25.24% YTD
SE stock has recently lost all key moving averages and the horizontal $145 support, although buyers have tended to step in at the 129/130 level. Substantial work is required for the chart to become constructive again and one can not claim it has bottomed based on the evidence.
A reclaim of the $145 level and then the SMA 200 are the first two hurdles I will be watching. However, I have been nibbling away with some small buys for the long-term.
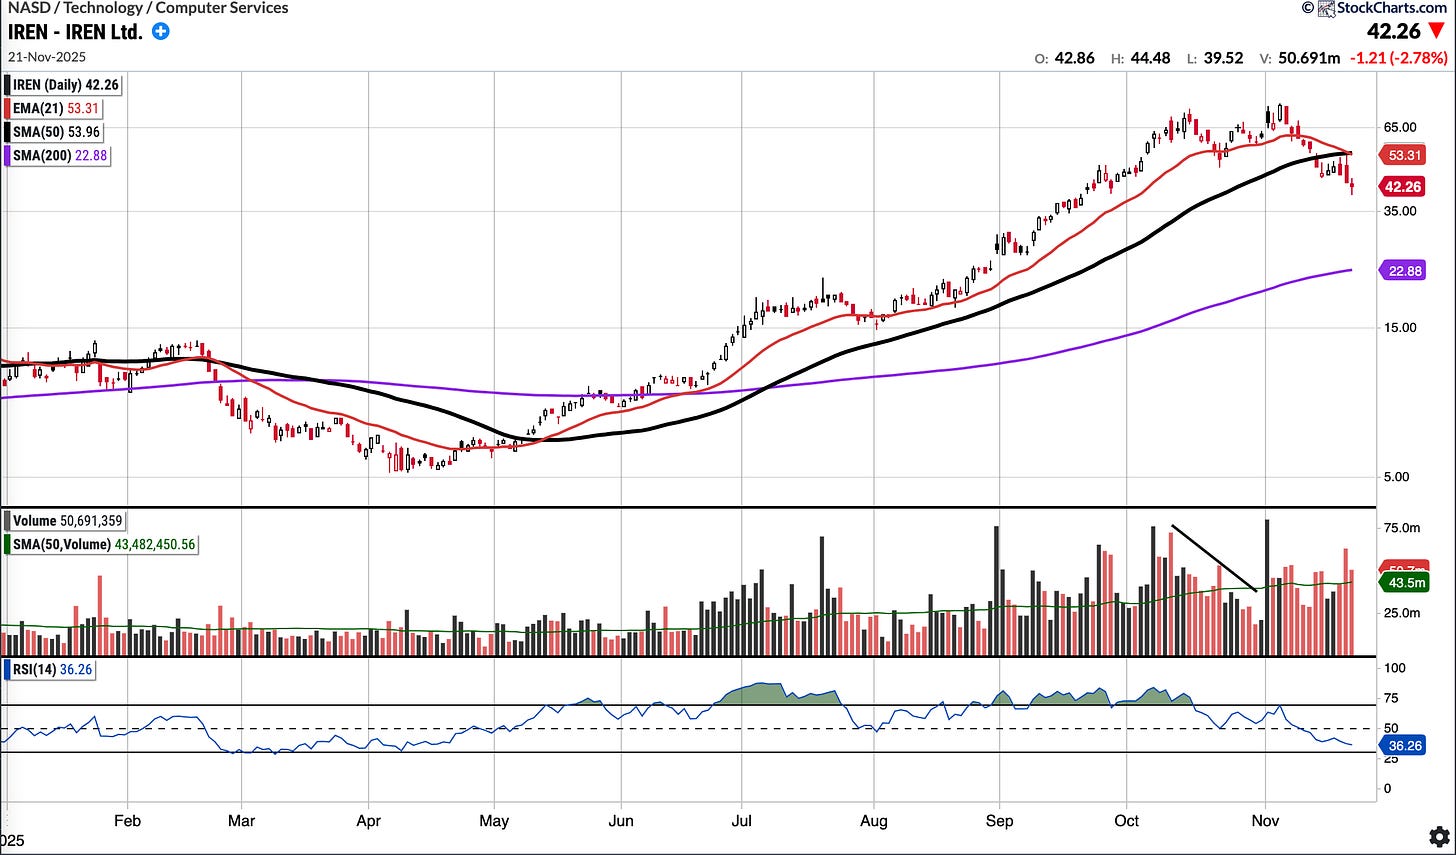
IREN (Currently Long in small size)
Currently trades at 42.26, 21.69% below a rising 50SMA and 84.68% below the 200SMA.
RSI 36.26
304.02% YTD
Like last week, IREN was red almost each day and now sits substantially below the SMA 50. Last week, I posted that a mean reversion test of the SMA 50 to the upside was ‘very likely.’ I used the opportunity on Thursday to book some gains and trim my position to a tracker size.
Bulls would like it to reclaim the EMA 21 and the SMA 50 with conviction before can feel good about a resumed uptrend. Bears remain firmly in charge for now.
Notable portfolio changes in previous week (all updated live in subscriber channels):


