

Hope you all are having a good weekend. Below, we will be previewing the upcoming week’s events and providing a portfolio update as usual.
Format for what is covered in this weekly preview:
A Look at the Indices
Key Upcoming Economic Events
Upcoming Earnings Reports
Charts
Notable Portfolio Changes from the Previous Week
Current Portfolio Holdings
Position size, cost basis, and commentary on each holding regarding the intended holding period and any planned activity
Closing Thoughts
I recommend checking out the most recent Monthly Portfolio and Performance Update below:

Also, ensure you read the free, easy-to-understand write-up on I put together with Position Journal

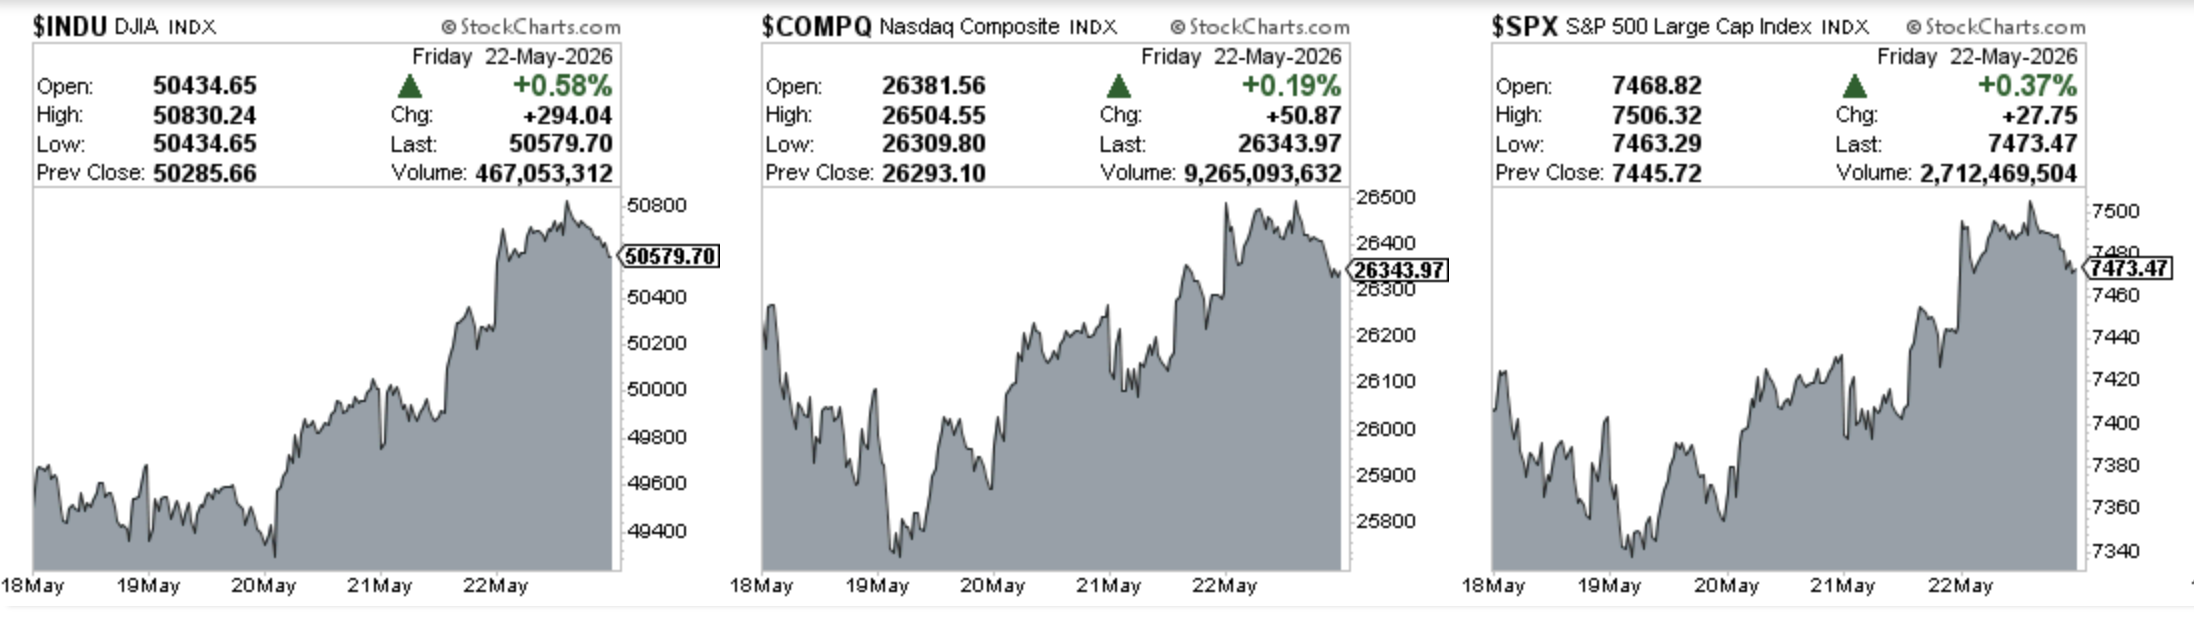
Indices
Dow Jones advanced 2.23% in the last week
S&P 500 advanced 0.95% in the last week
Nasdaq Composite advanced 0.37% in the last week
IWM advanced 2.69% in the last week
Key upcoming economic events
Tuesday, May 26
Chicago Fed National Activity Index (7:30 AM ET)
S&P/Case-Shiller Home Price Index (8:00 AM ET)
FHFA House Price Index (8:00 AM ET)
CB Consumer Confidence (10:00 AM ET)
2-Year Treasury Note Auction (12:00 PM ET)
Wednesday, May 27
MBA Mortgage Applications Index (7:00 AM ET)
Richmond Fed Manufacturing Index (10:00 AM ET)
5-Year Treasury Note Auction (1:00 PM ET)
Federal Reserve Speeches
Thursday, May 28
Initial & Continuing Jobless Claims (8:30 AM ET)
Q1 Gross Domestic Product (GDP) - Second Estimate (8:30 AM ET)
Durable Goods Orders (8:30 AM ET)
EIA Crude Oil & Natural Gas Inventories (10:30 AM / 11:00 AM ET)
7-Year Treasury Note Auction (1:00 PM ET)
Friday, May 29
Personal Income and Outlays (8:30 AM ET)
Core PCE Price Index (April) (8:30 AM ET): The main event of the week.
Chicago PMI (9:45 AM ET)
Upcoming Earnings
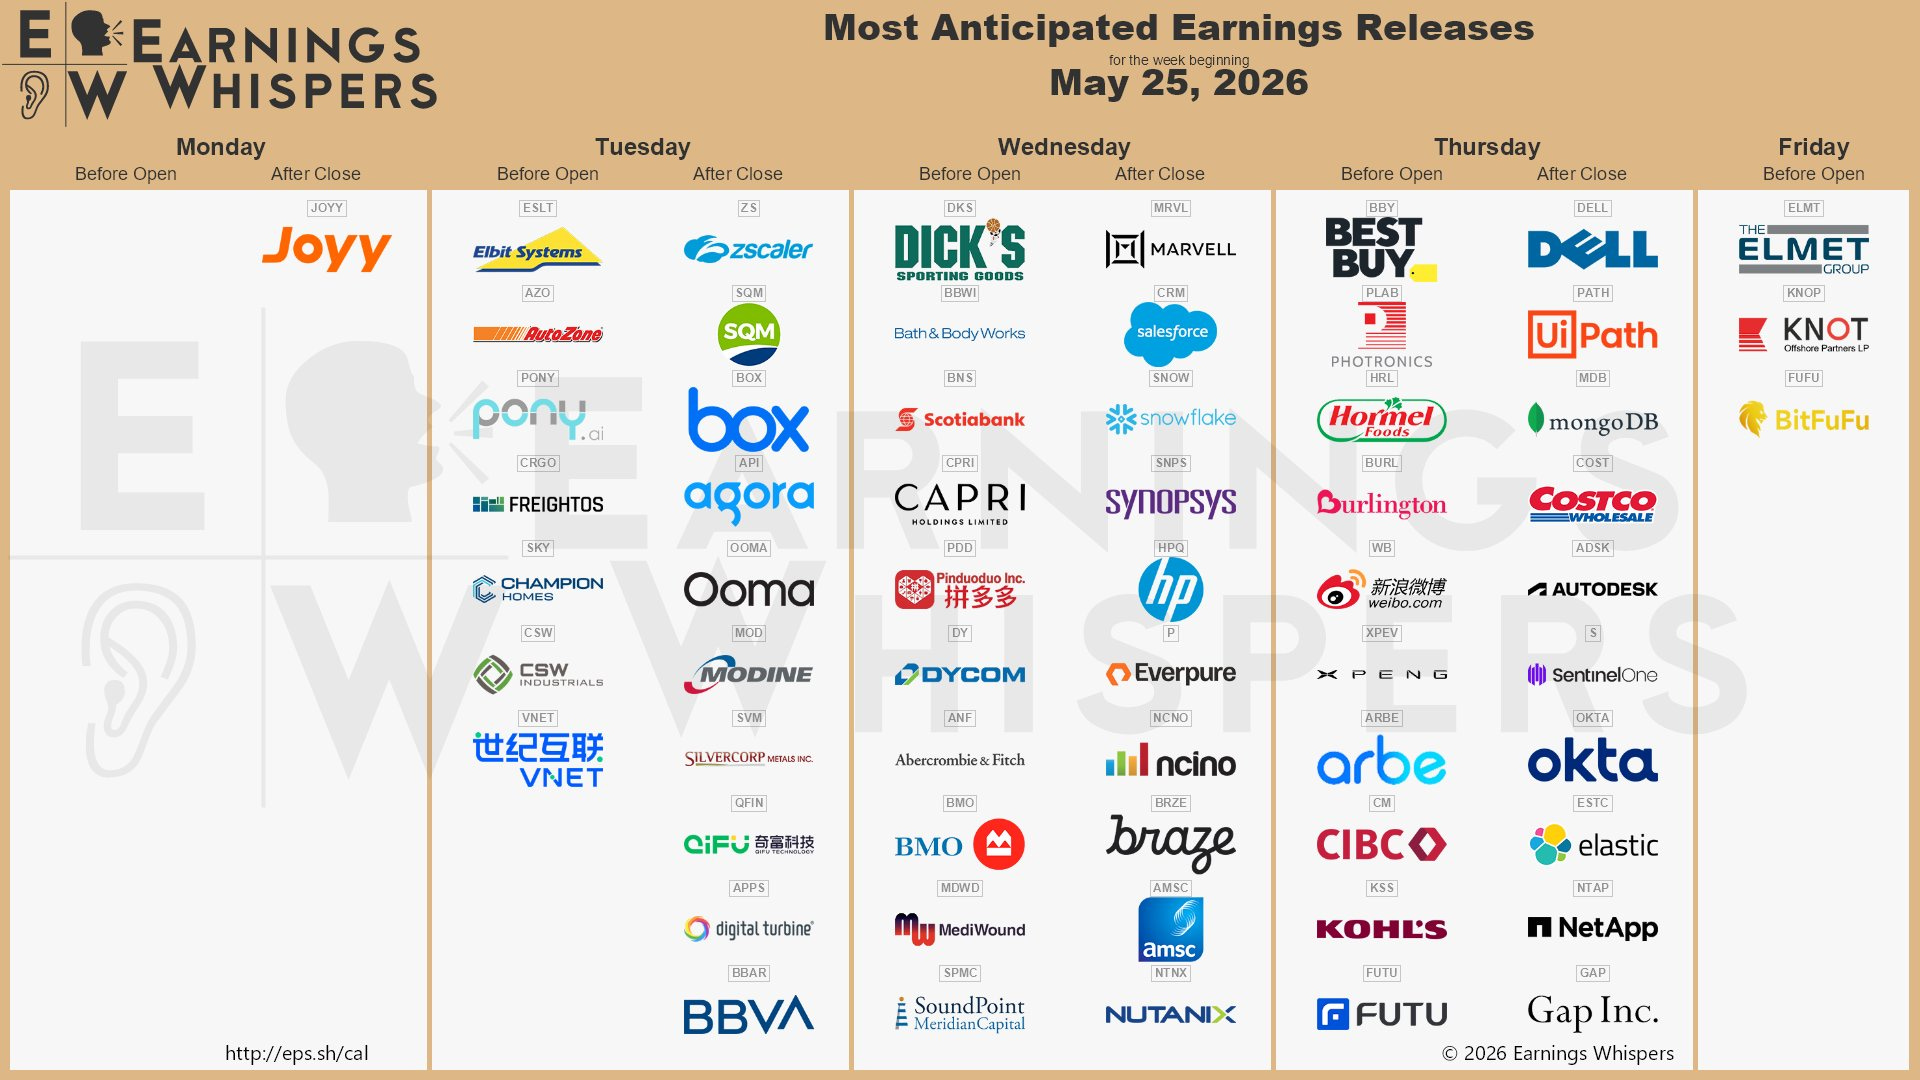
Below is the infographic by Earnings Whispers highlighting the schedule for this week:
Charts
SPX
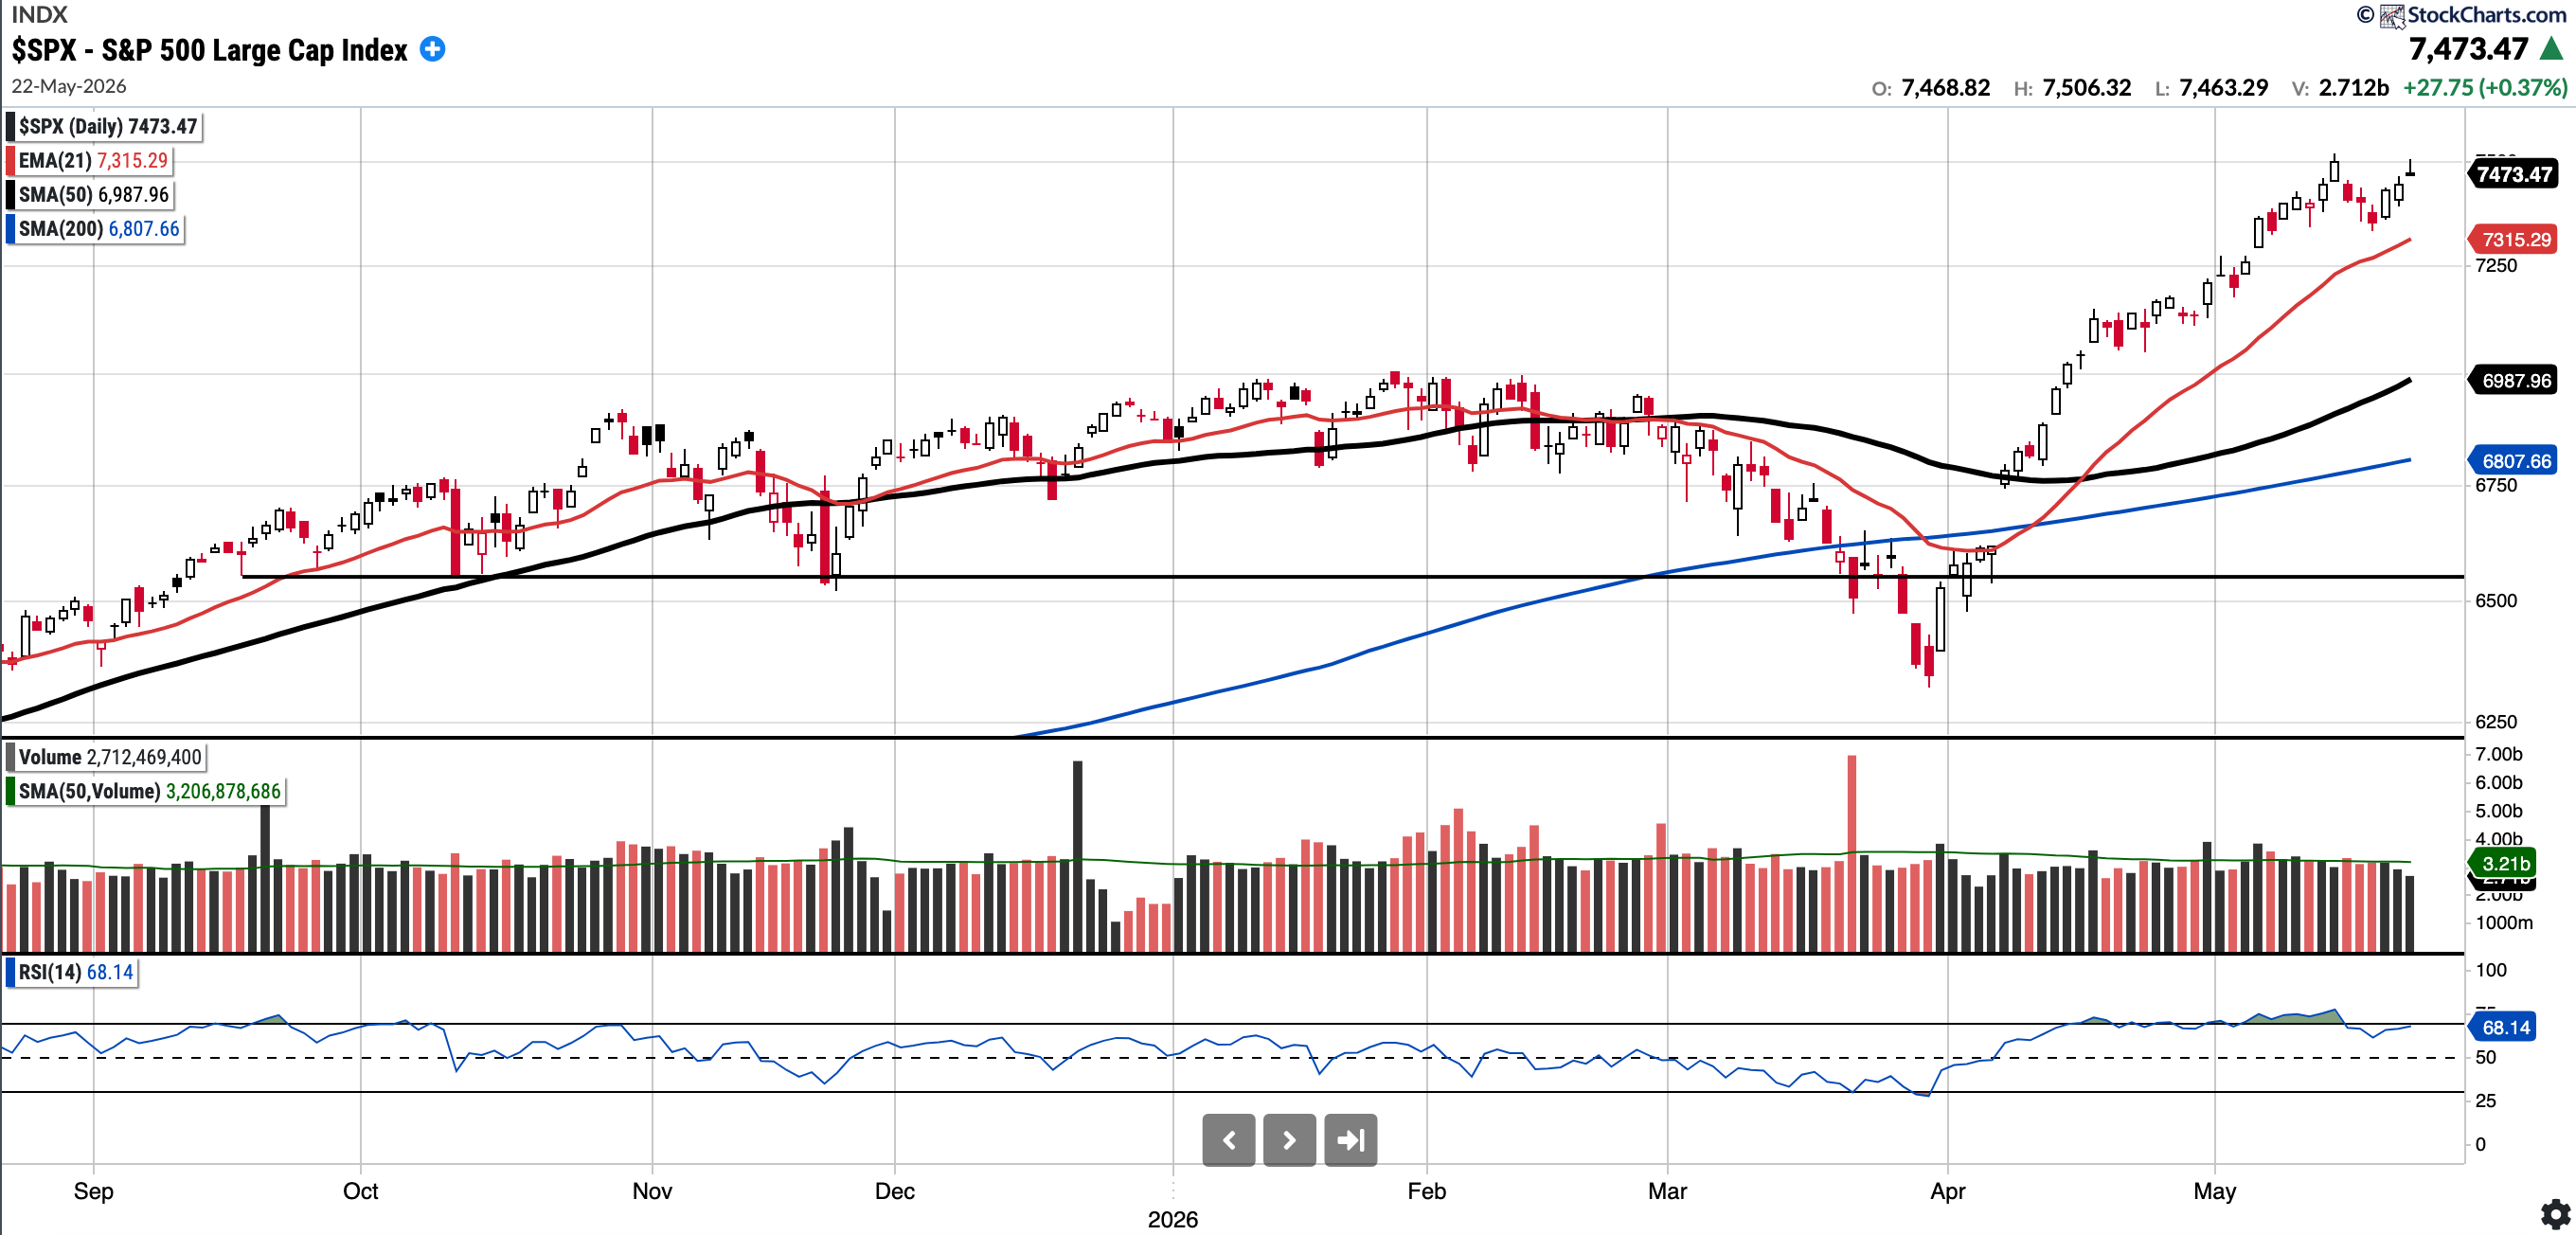
Currently trades at 7,473.47, 6.95% above the 50SMA and 9.78% above the 200SMA.
RSI 68.14
8.97% YTD
Distribution days in the last week: 1
The SPX had a strong close to the week, though it failed to make a new high. Though given how futures are looking, we are likely to open at new highs Tuesday morning. There was one distribution day this week and two in the last six days.
COMPQ
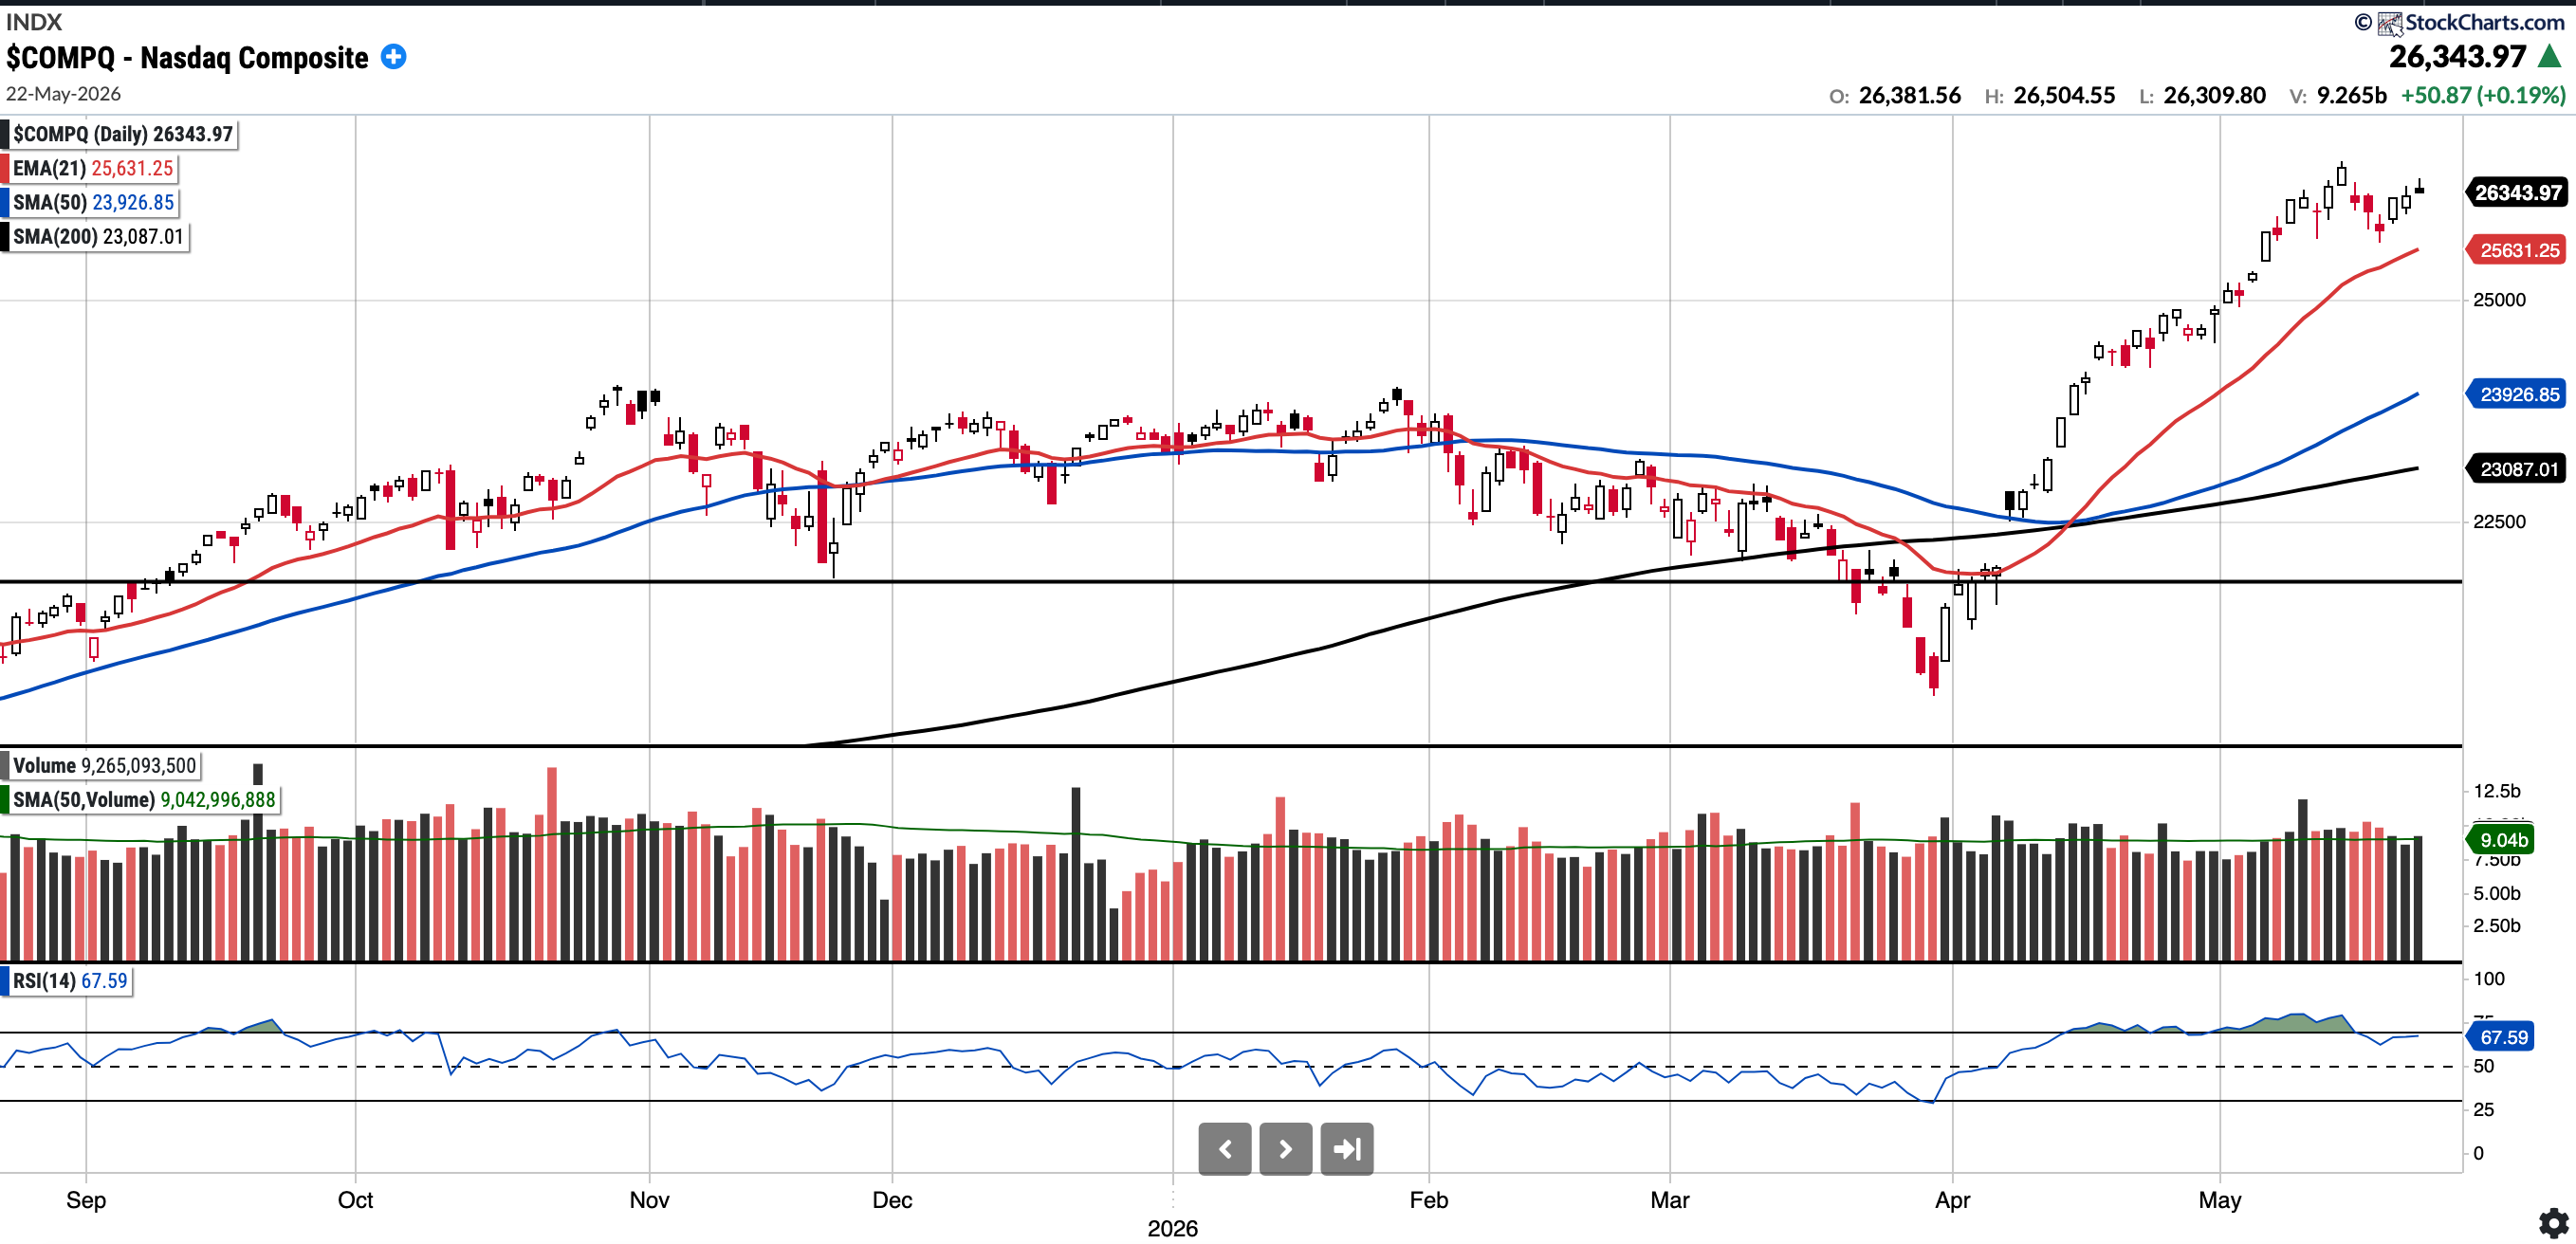
Currently trades at 26,343.97, 10.1% above the 50SMA and 14.11% above the 200SMA.
RSI 67.59
12.87% YTD
Distribution days in the last week: 1
The Nasdaq Composite remains strong, though notably there was one distribution day and three consecutive days with selling on above-average volume. Despite this, the Nasdaq remains extended, currently trading 10.1% above its 50-day SMA
BTC (currently Long)
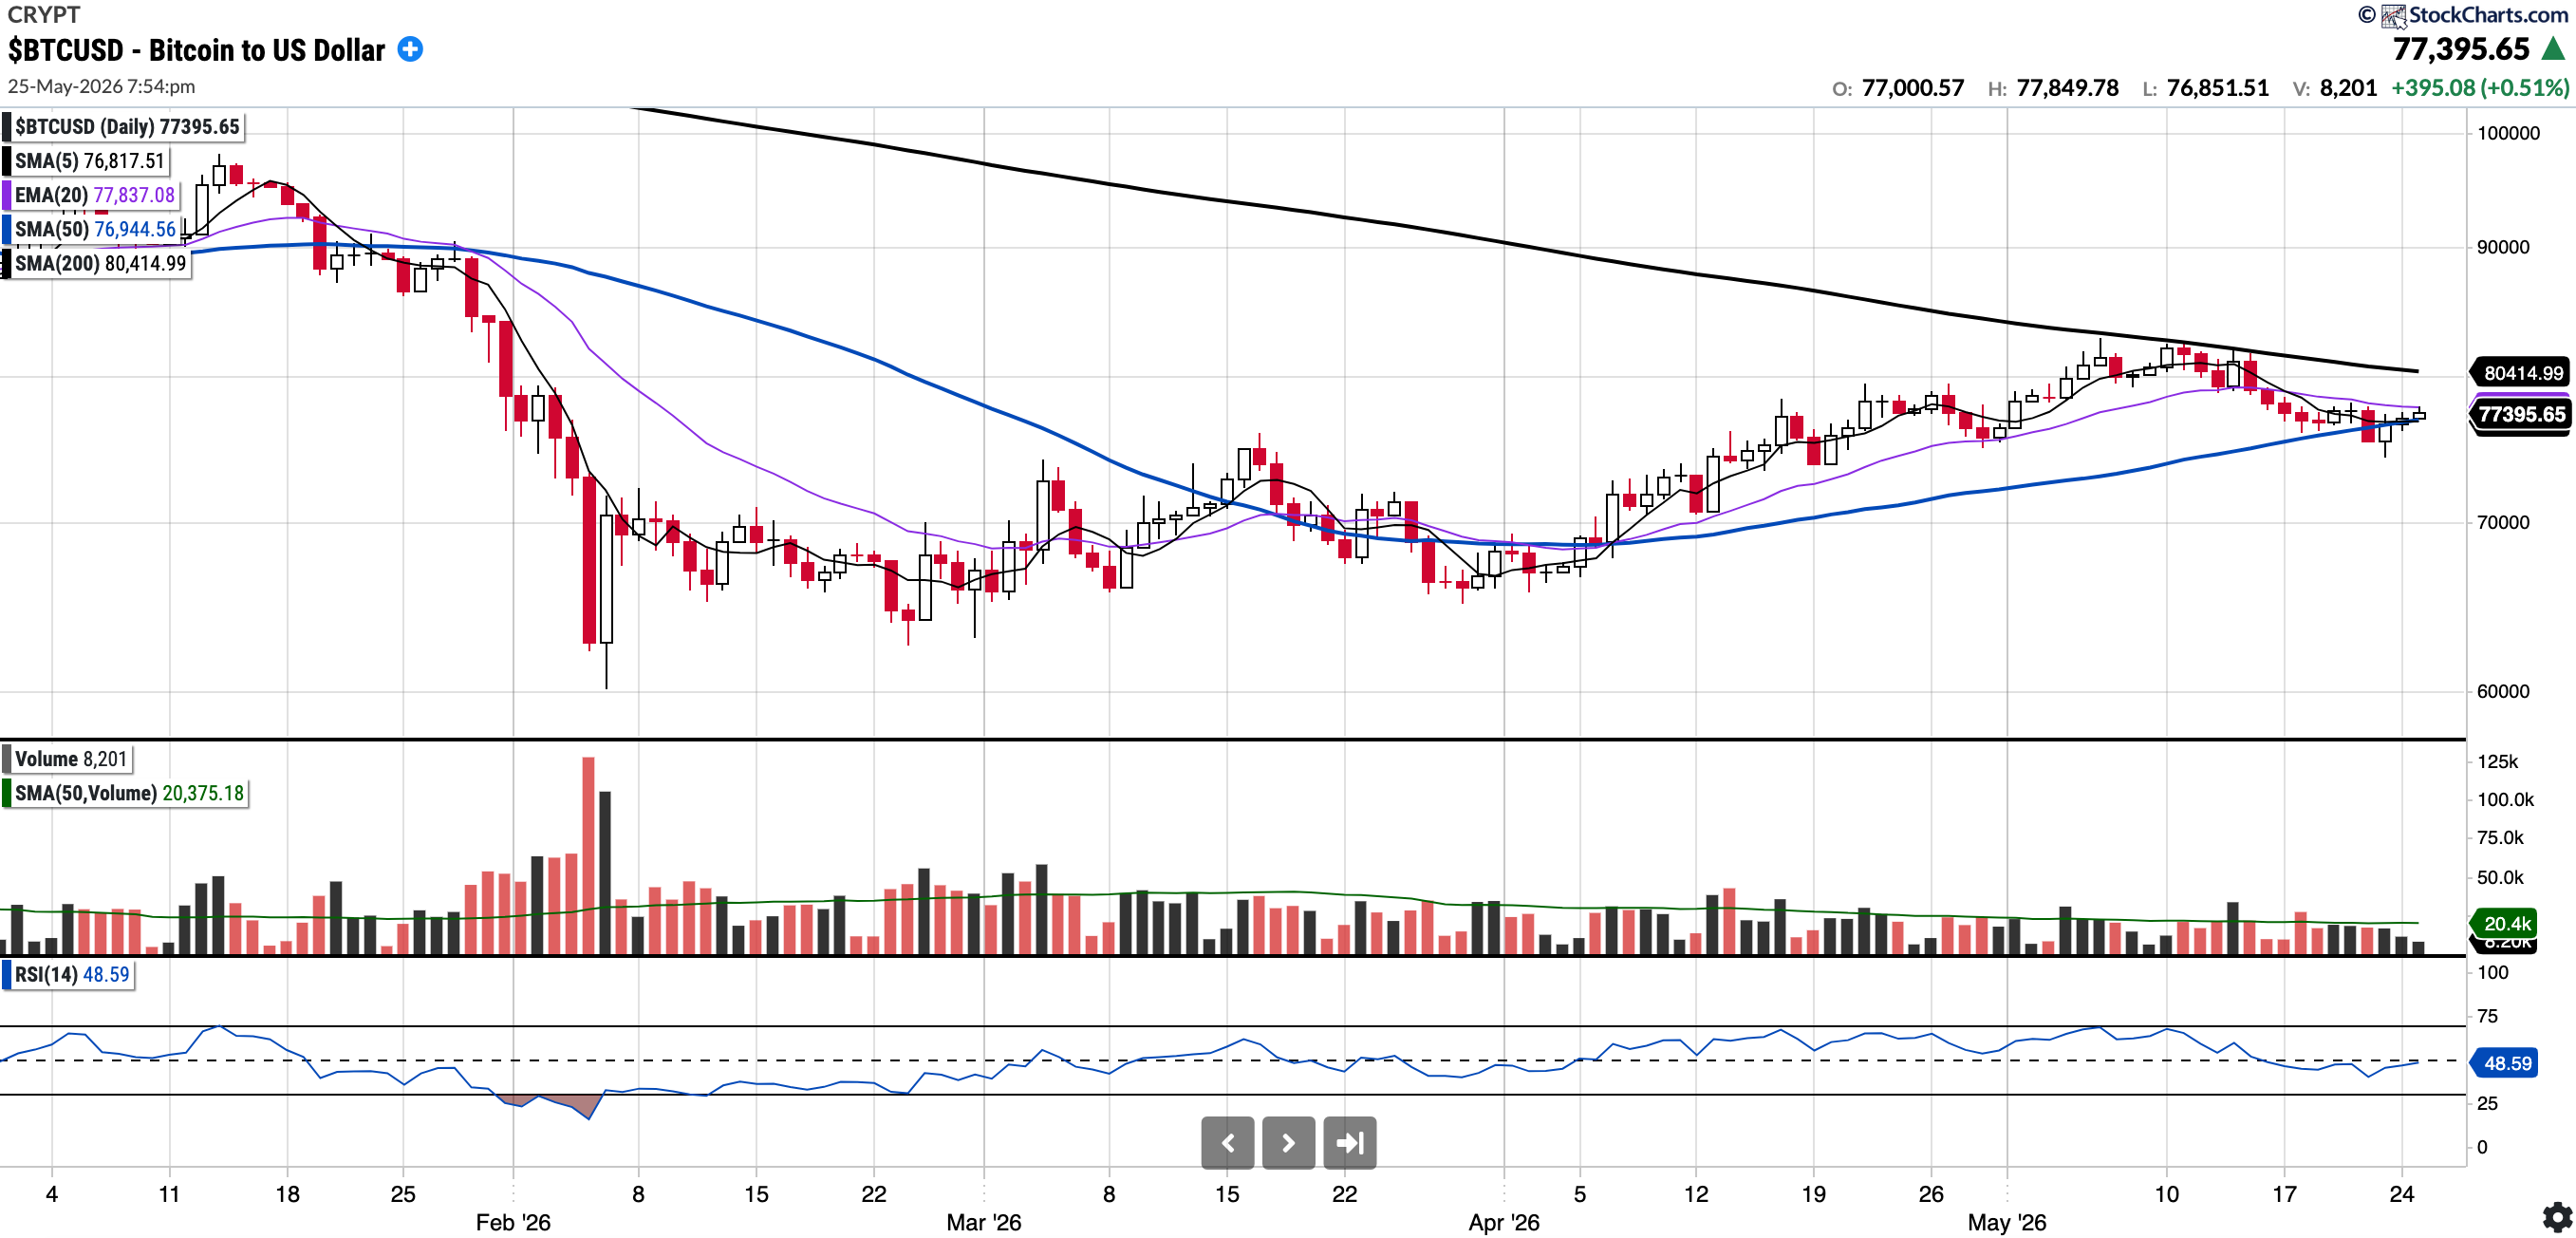
Currently trades at $77,395.65, 0.59% above the 50SMA and 3.75% below the 200SMA.
RSI 48.59
-12.8% YTD.
Since testing the 200-week moving average on Thursday, February 5th, Bitcoin has traded primarily within the $63,000–$70,000 range. However, we broke out of that consolidation recently, reaching highs of $82,900 last week.
2 weeks ago I had written:
Given the more constructive price action of late and the likelihood of the Clarity Act passing, BTC may reclaim the 200-day soon.
Whilst the U.S. Senate Banking Committee passed the Digital Asset Market Clarity Act in a bipartisan 15–9 vote last week, advancing the critical cryptocurrency regulation framework to the full Senate, BTC has been rejected at the 200 day moving average each time it has tested it. Bulls would like to see this surpassed.
As of Monday at 21:00 BST, BTC is trading above its 5EMA and 50SMA; however, it remains below the 200 day moving average. It is trading comfortably above the $74,000 level though, which I previously noted as a key area.
EEM
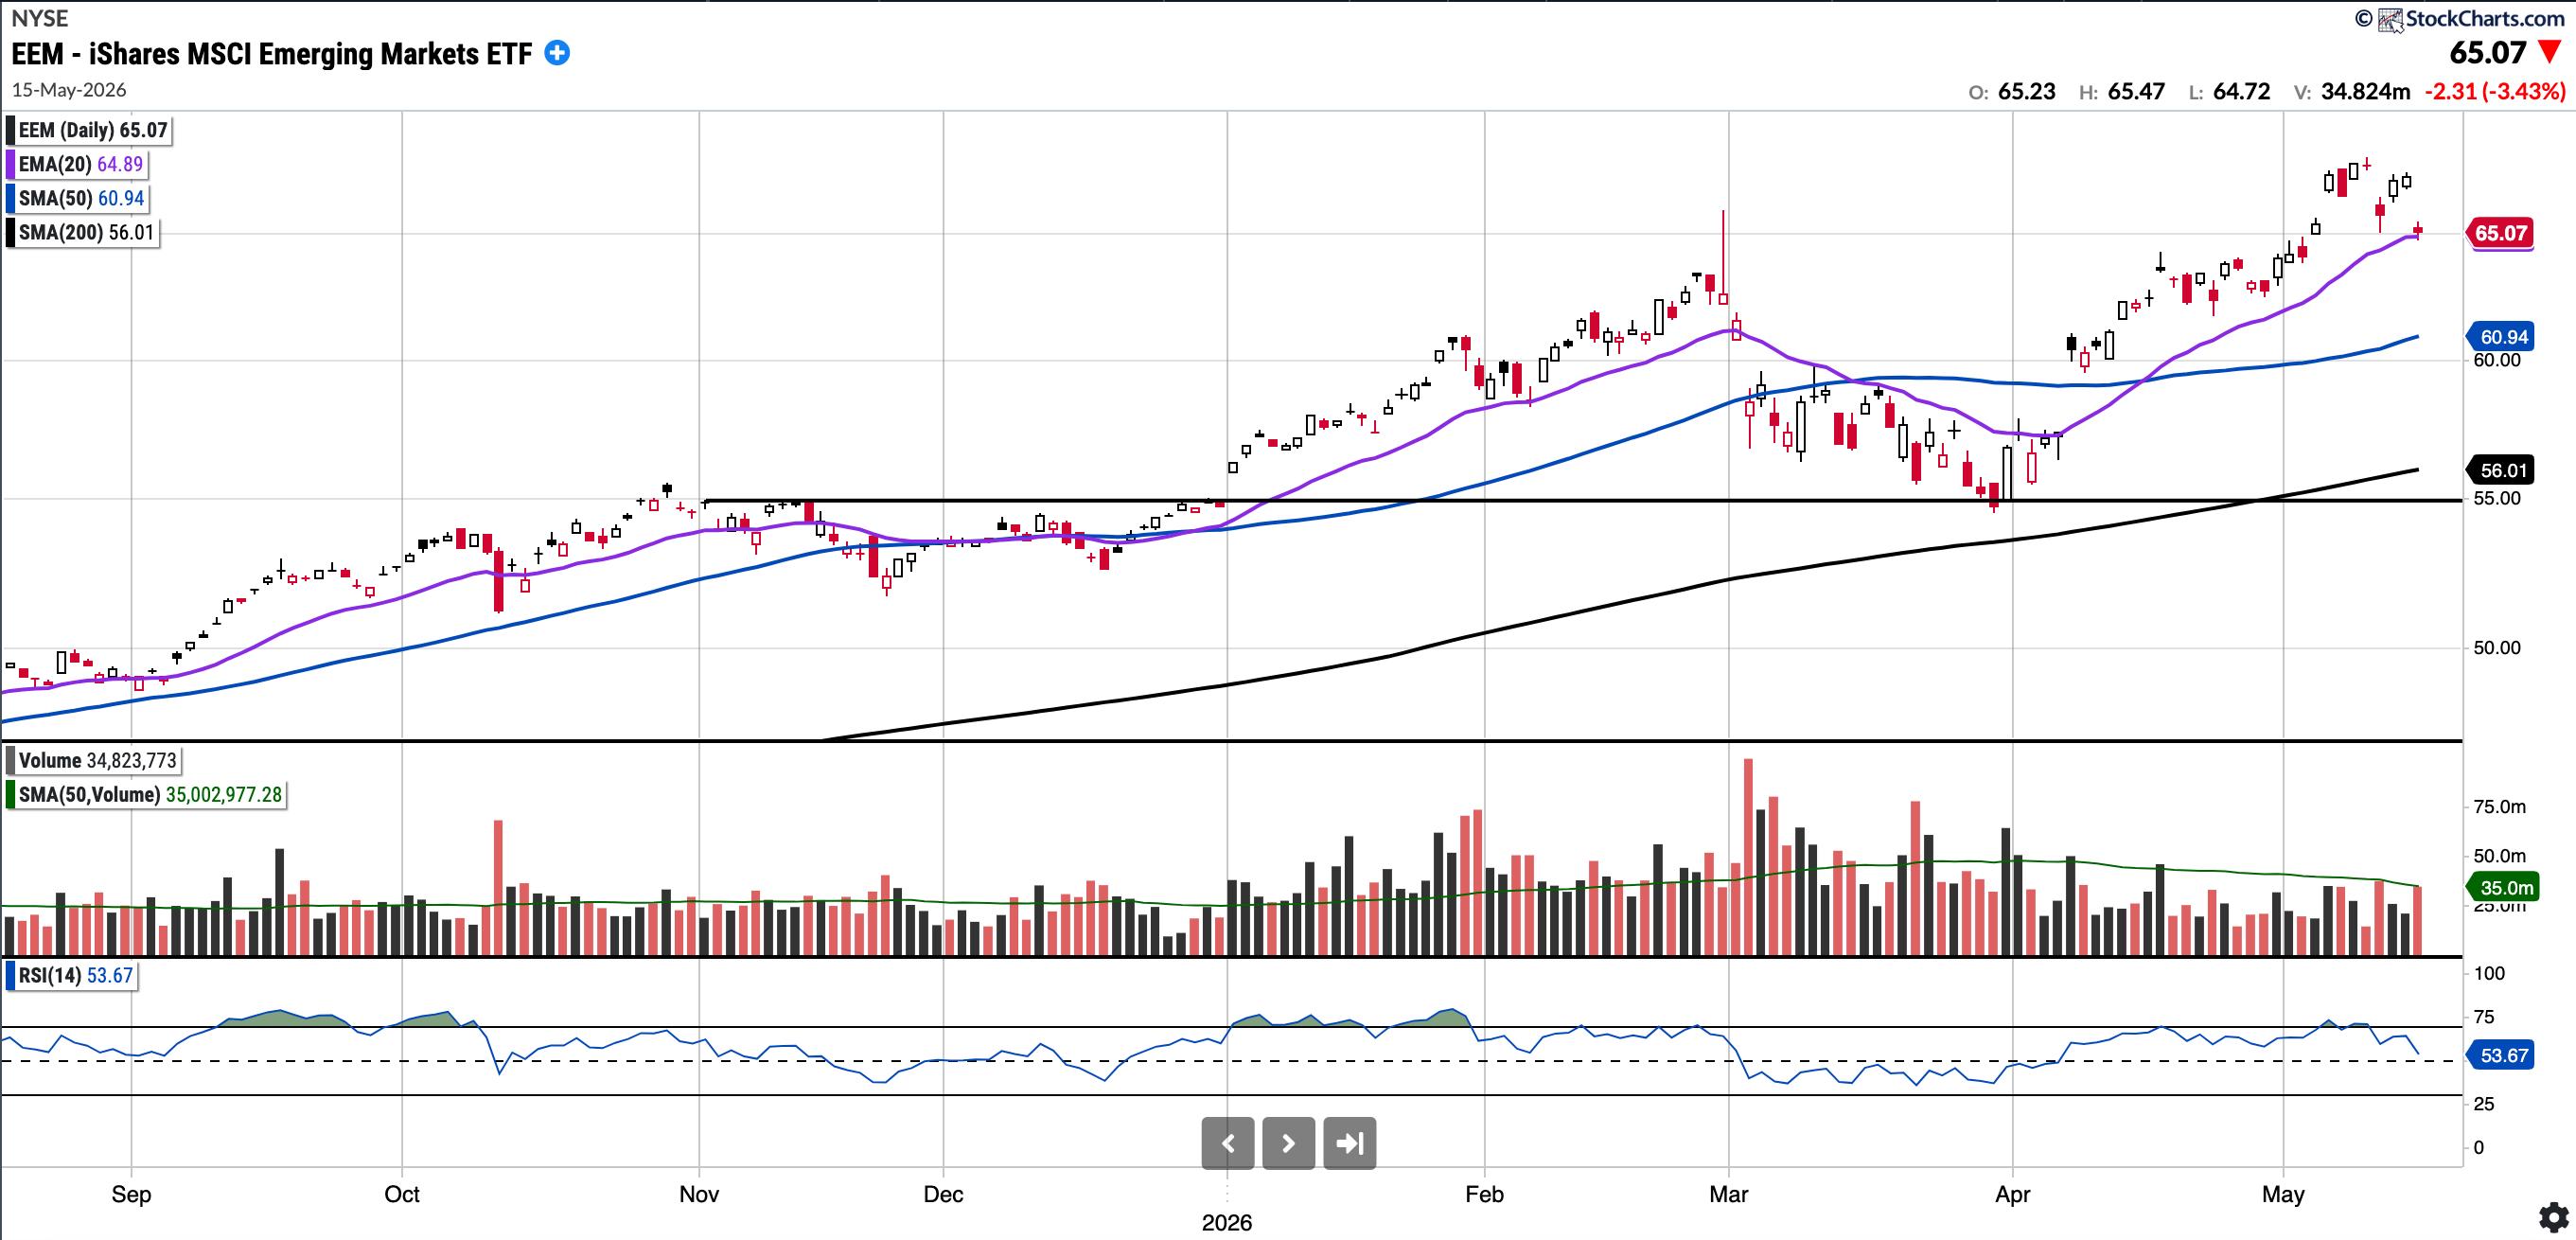
Currently trades at $65.8, 6.84% above the 50SMA and 16.71% above the 200SMA
RSI 53.67
+17.14% YTD
EEM remains in a strong uptrend and continues to outperform U.S. indices comfortably year-to-date by more than 800 bps. It has bounced remarkably from the late March lows.
It did lose the 21-day EMA earlier this week though has reclaimed that again. Below this, the levels to watch for pullback buys are the SMA 50 at 61.66 and then the $55/56 level (horizontal support and SMA 200). I would not expect it to trade as low as $55 again unless there are significant disturbances in the Middle East.
I believe EEM could be setting up for multi-year outperformance; hence, I continue to watch it closely.
GOLD (Long Physical)
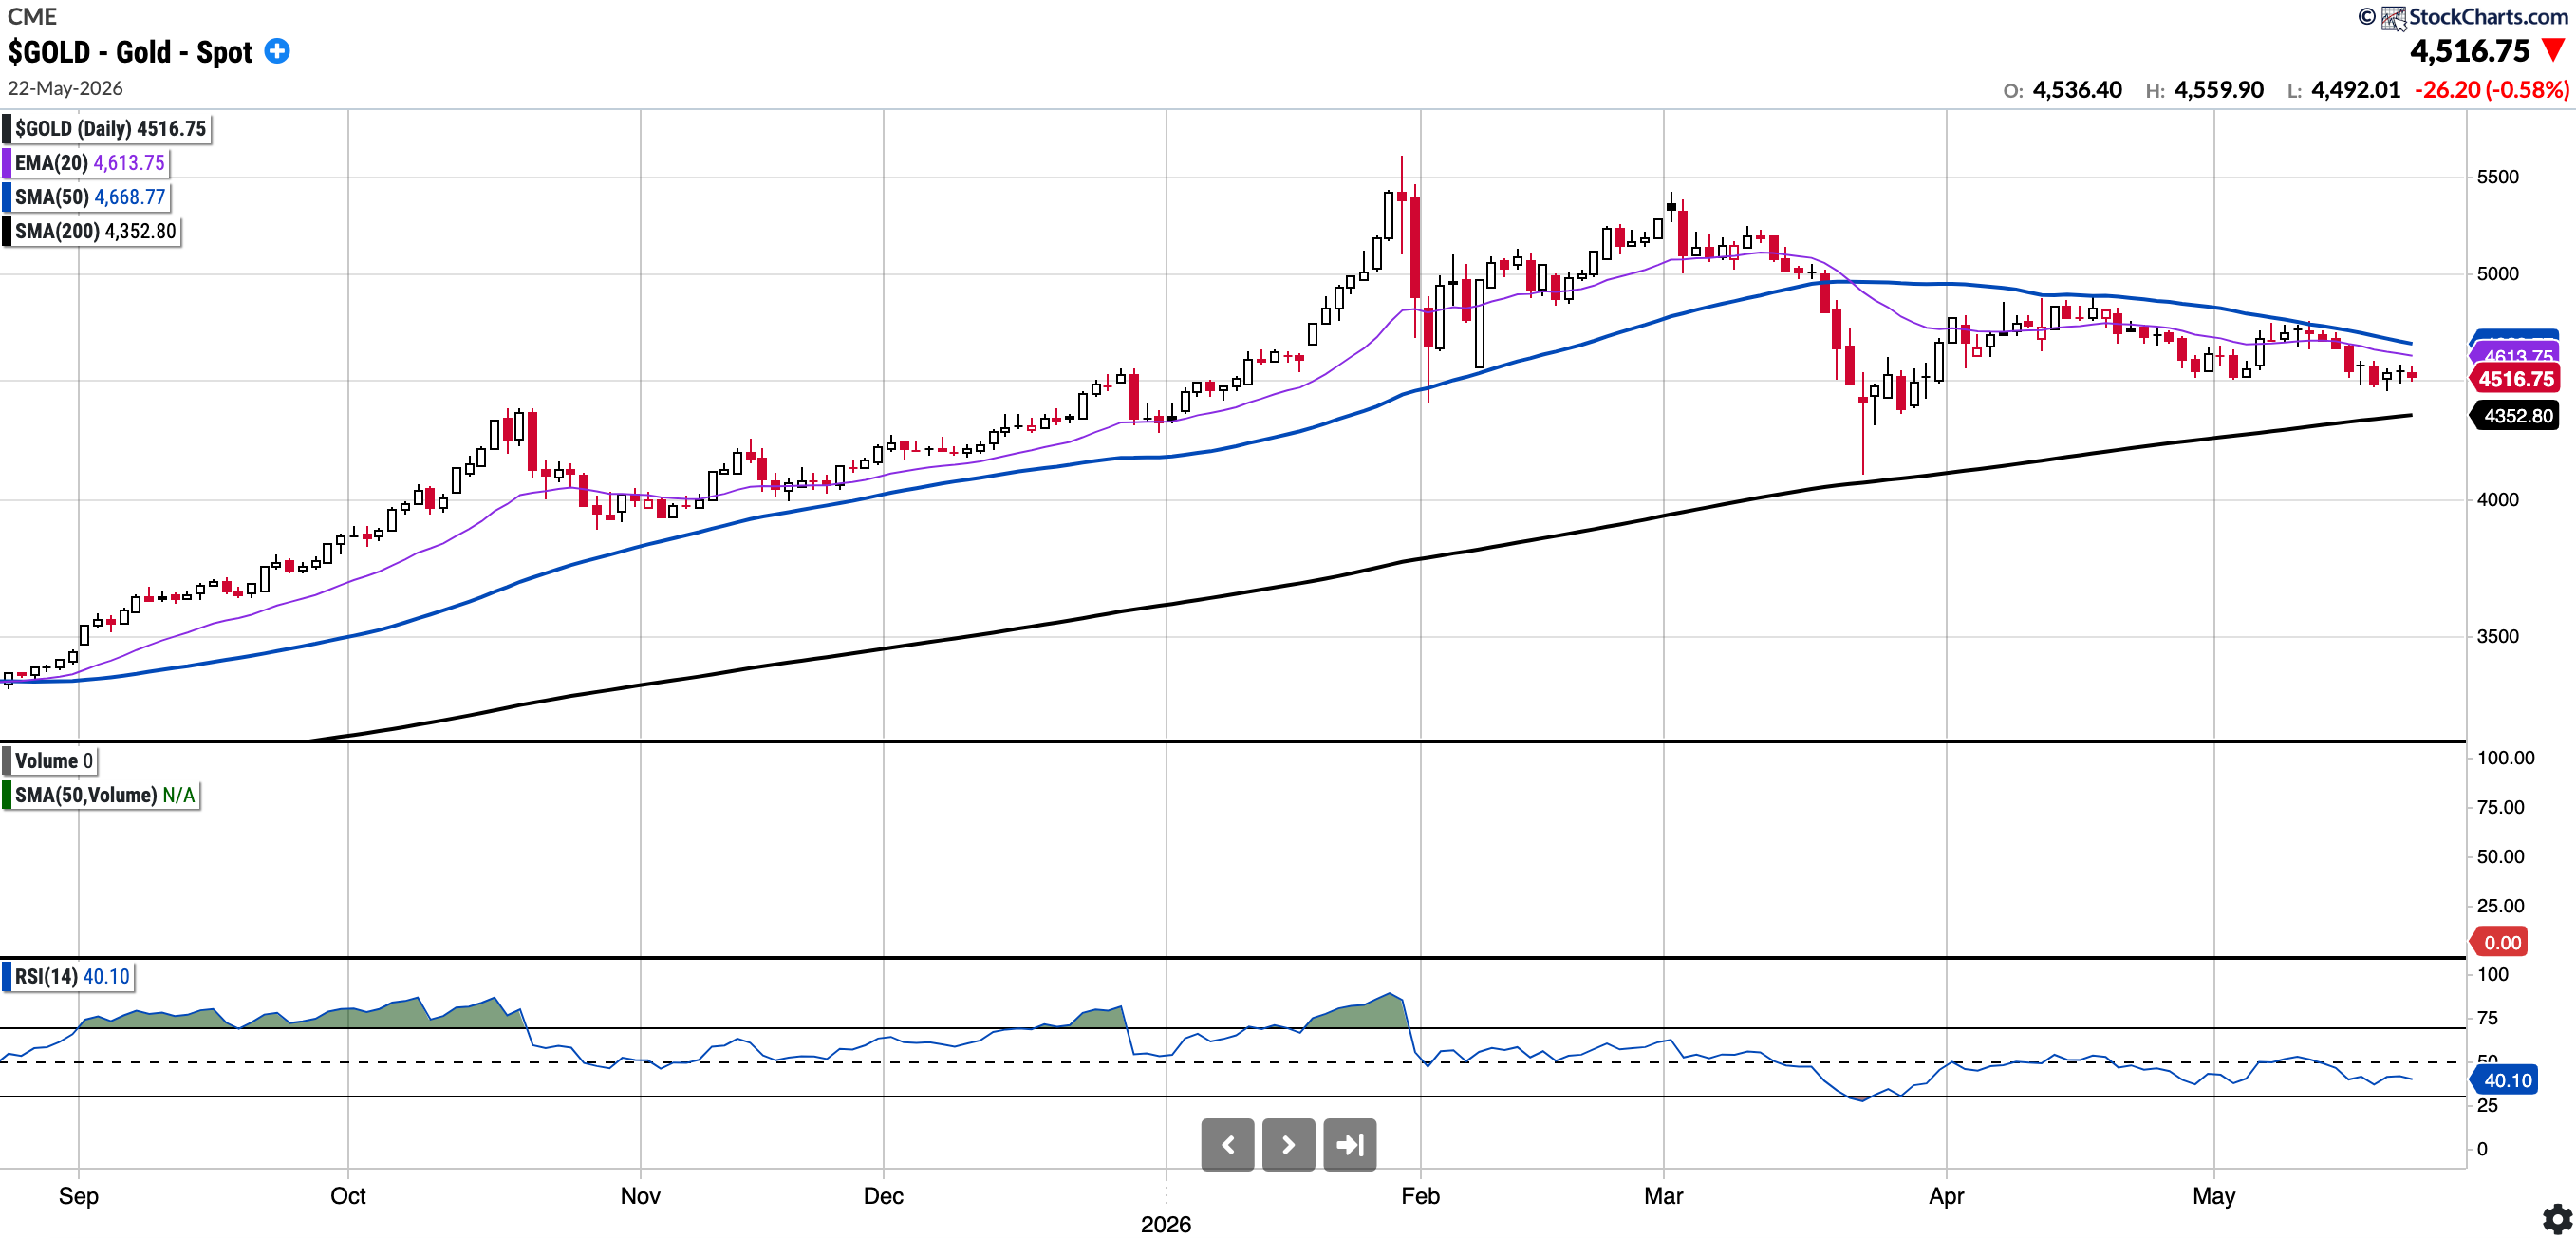
Currently trades at $4516.75, 3.26% below the 50SMA and 3.77% above the 200SMA
RSI 40.1
4.49% YTD
Gold remains in a well defined uptrend, though it it is below the EMA 20 and SMA 50. The overhead SMA 50 continues to serve as a strong resistance level. The 200 day moving average at 4352 below looks possible on any further weakness. I will likely be a buyer there.
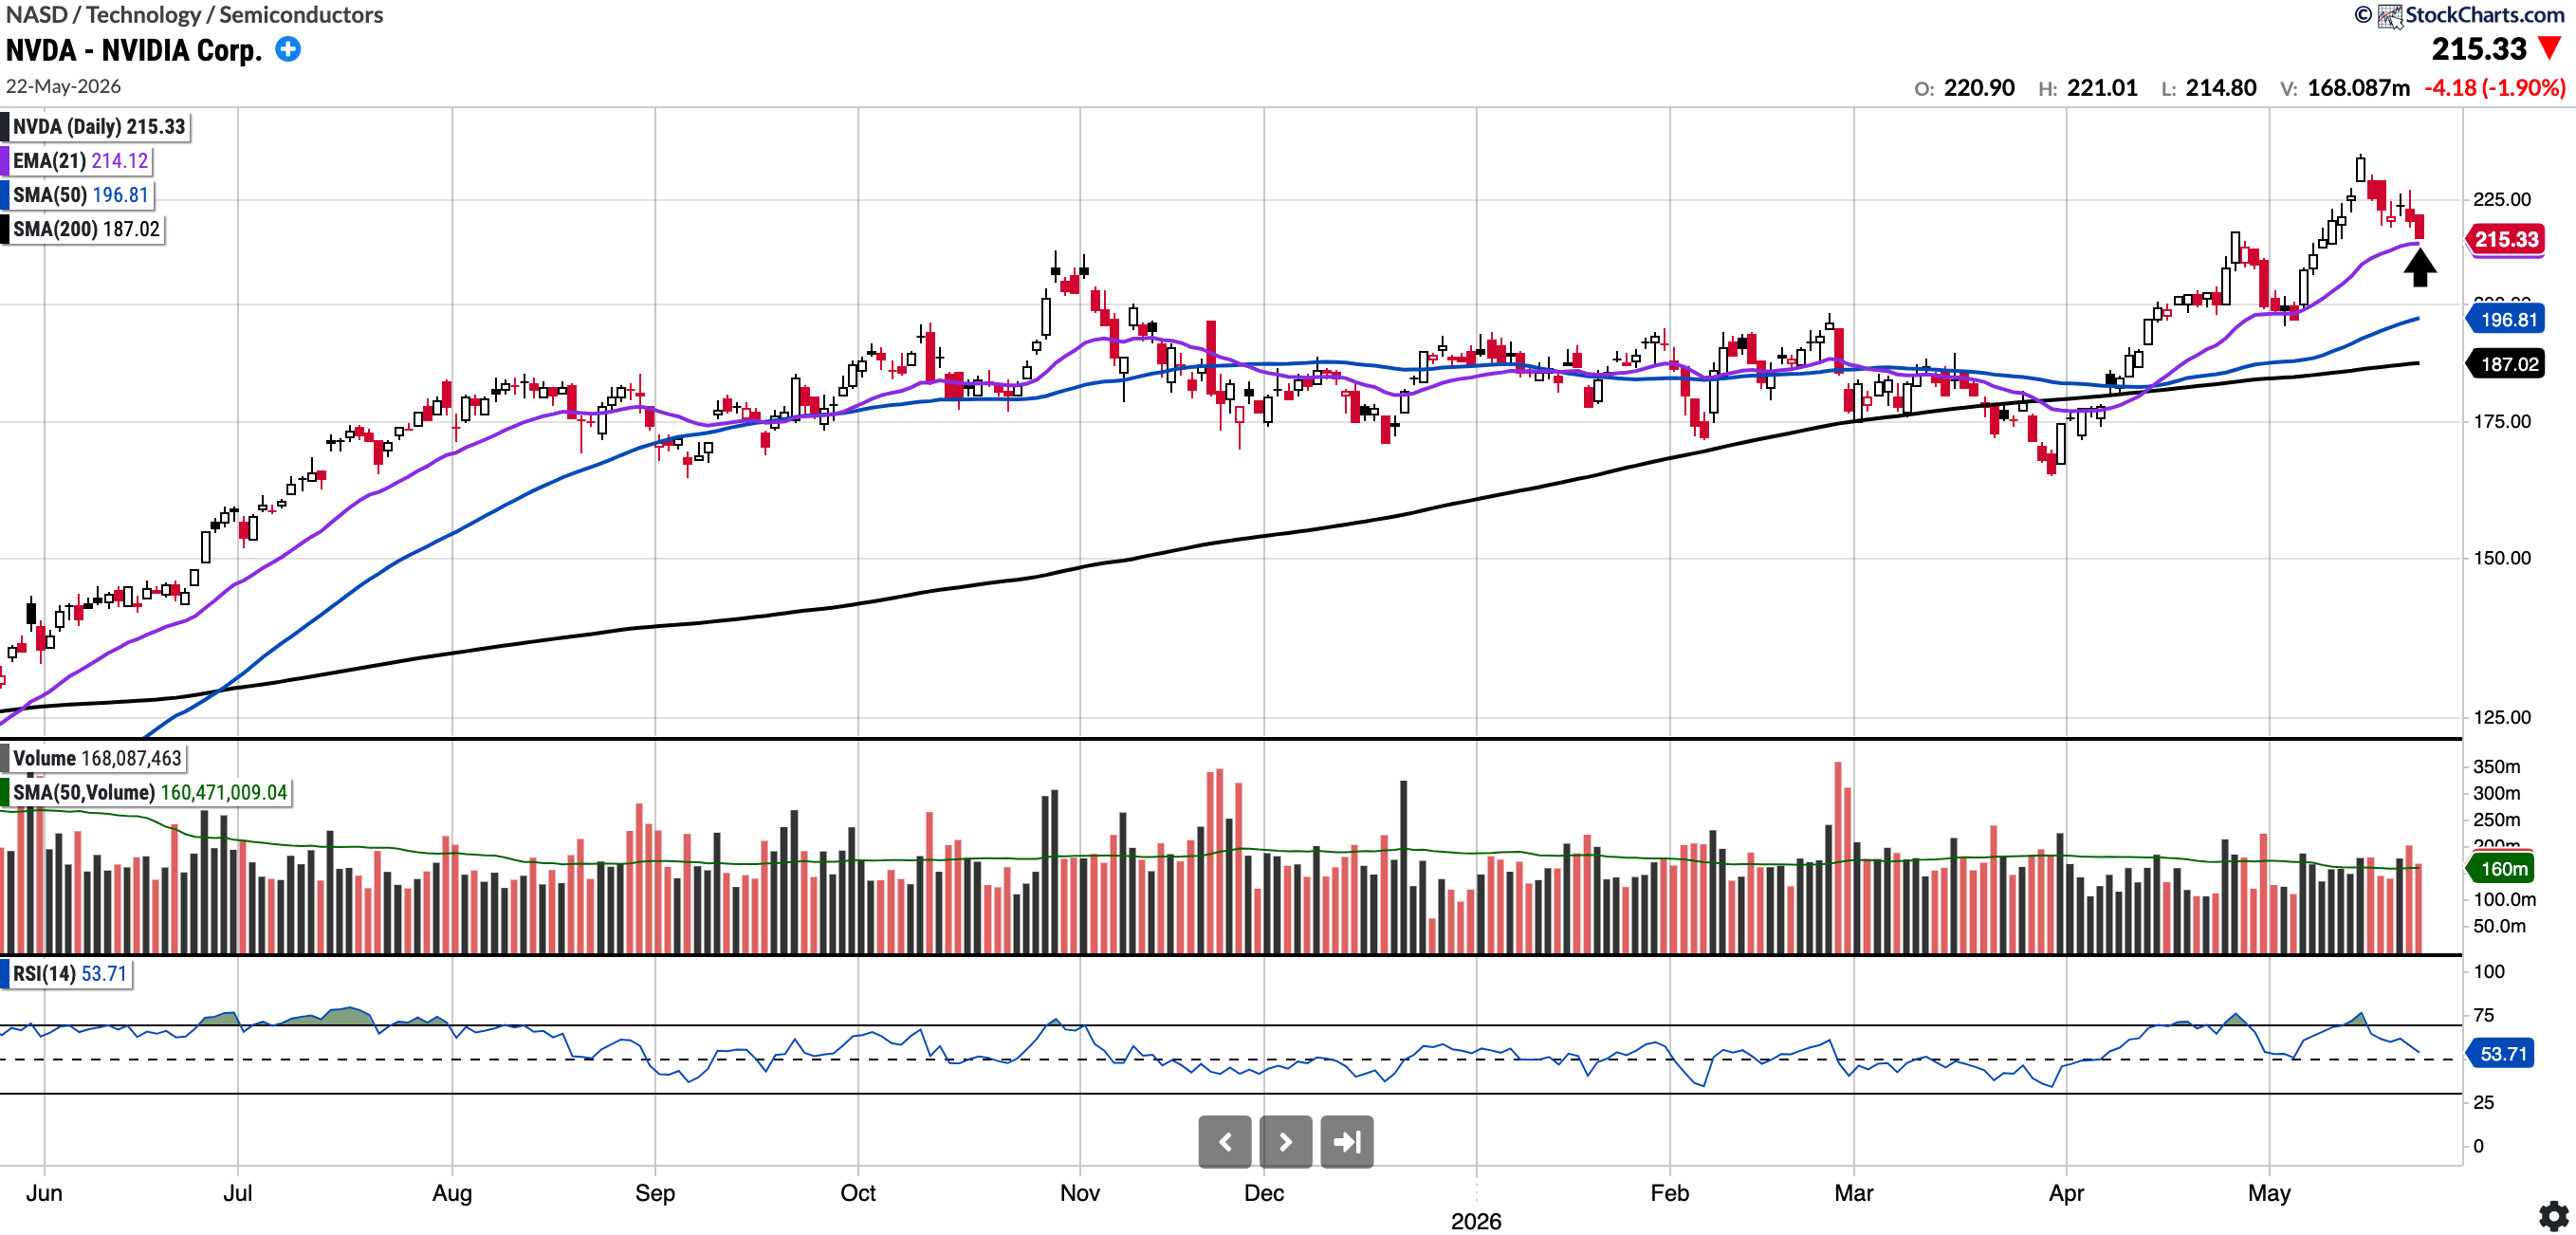
NVDA
Currently trades at $215.33, 9.41% above the 50SMA and 15.14% above the 200SMA
RSI 67.32
14.03% YTD
NVDA was featured a few weeks ago when it was trading at $208 (see below), at which time I had written that a move above 212.19 could see it trading at 240. NVDA did trade as high as 240.00 in early trading last week on Friday to complete the measured move.
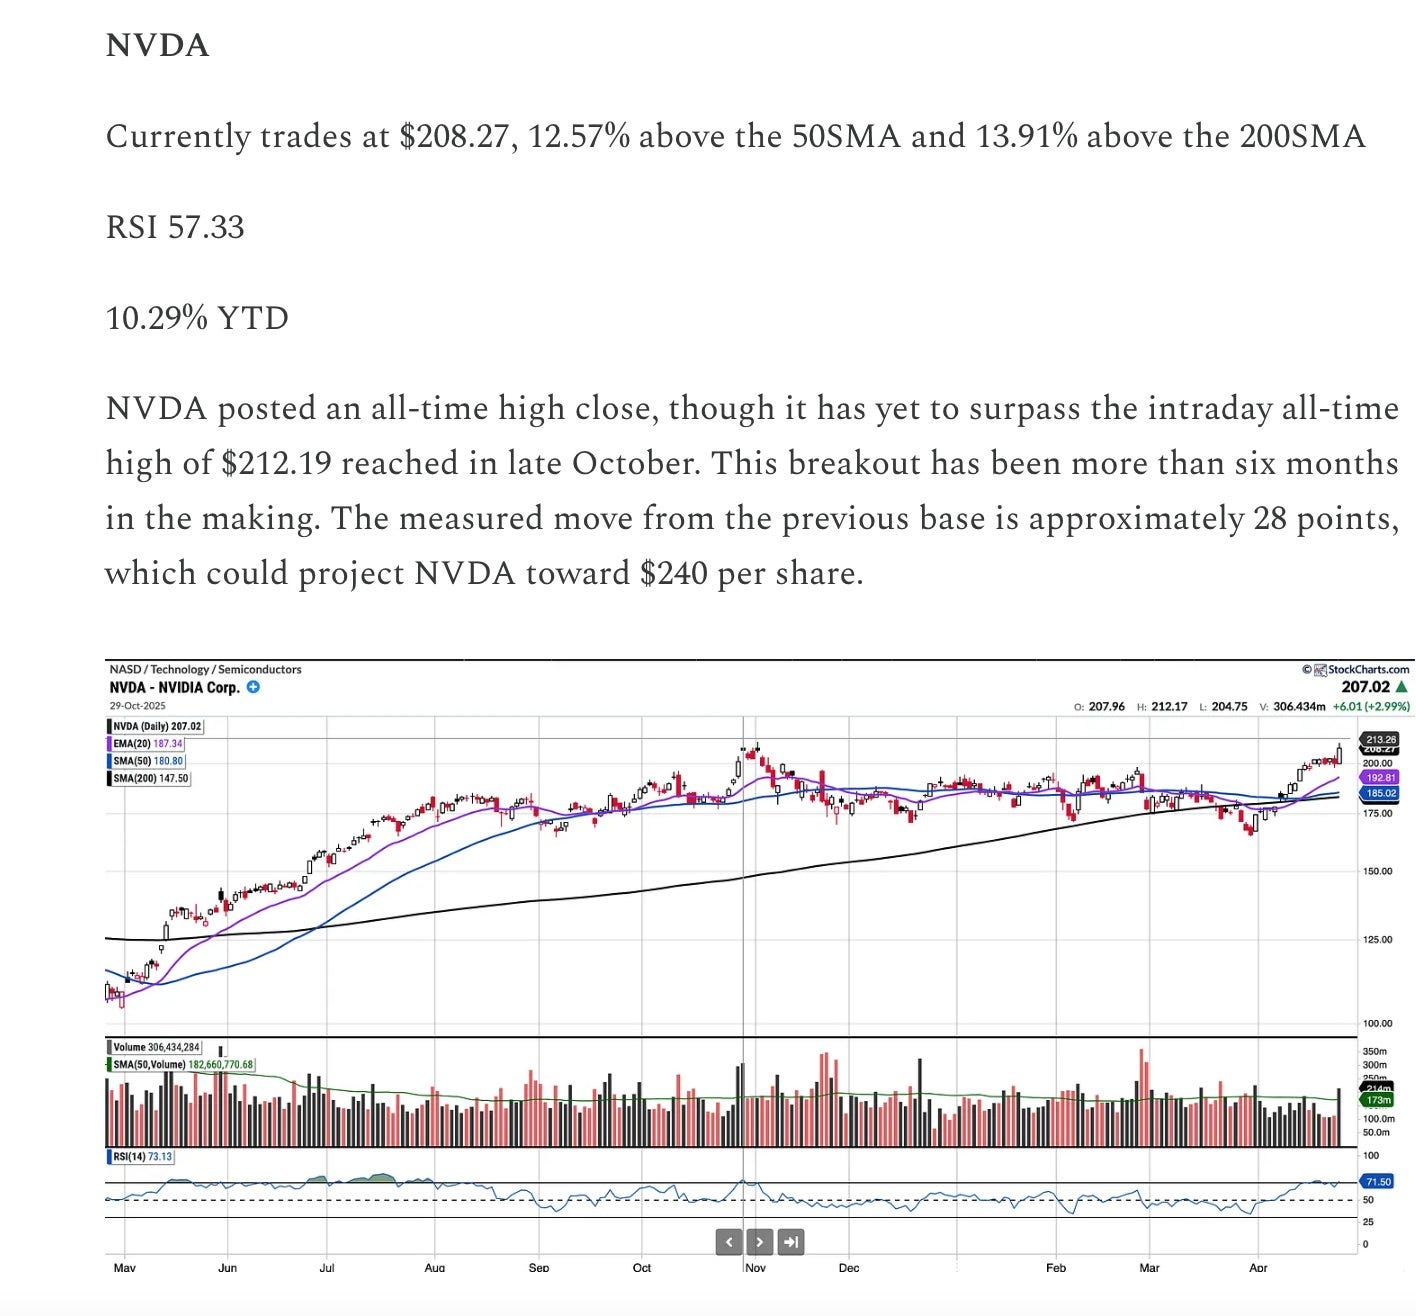
However, since the Q1 print, NVDA has pulled back and is now sitting at the 21-day EMA, which could serve as a support level. Below this, the 50-day SMA at 196.81 may serve as a high risk-reward level to add.
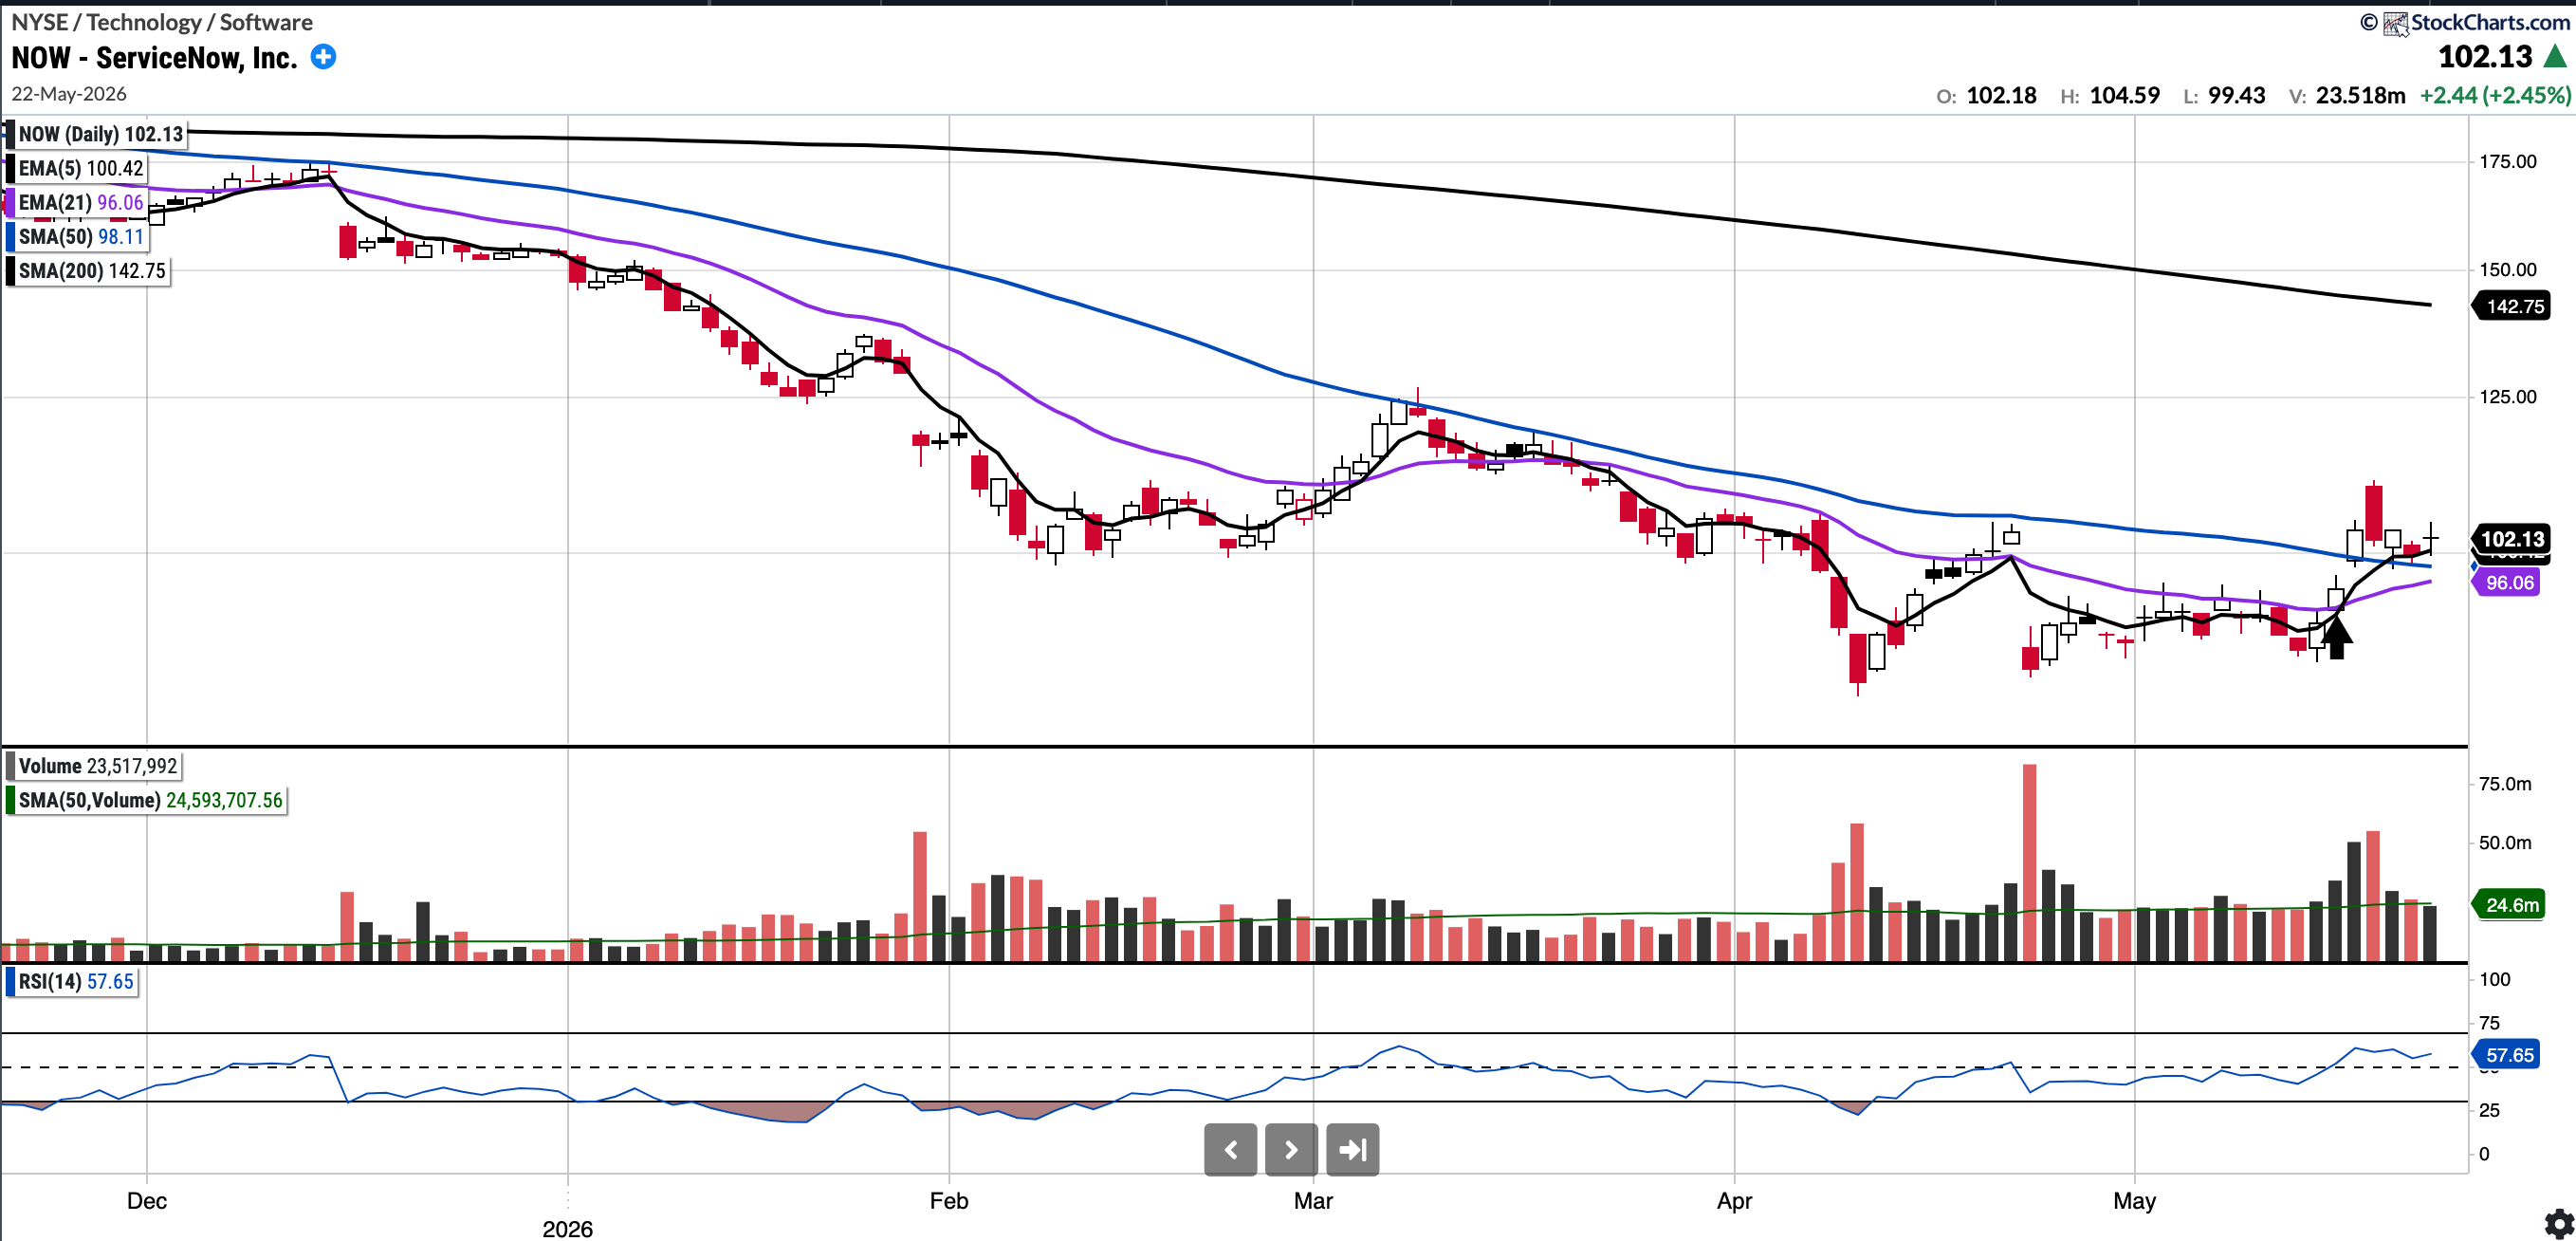
NOW (Recent Long in Investing account at ~$94)
Currently trades at $102.13, 4.09% above the 50SMA and 28.46% below the 200SMA
RSI 57.65
-30.74% YTD
NOW has caught some investor attention recently. Insiders have been buying, and Jensen Huang has been praising the company, but it was revealed Trump personally owns this stock, accumulating it between February and March.
Last week I had written:
NOW has found resistance at the descending 50 SMA every time over the last nine months (see arrows). Bulls would like to see the 5 EMA cross above the 20 EMA, then the 50 SMA flipped to support, and eventually cross above the 200-day SMA. This will take some time. A move above the 100 psych-level would also be very constructive.
This week, the 5-day EMA has flipped above the 20-day EMA, and the stock has reclaimed the 50-day SMA for the first time in almost a year. The stock will have to defend this level now. On the upside, I see ~125 as the first area of interest, followed by the overhead 200-day moving average.
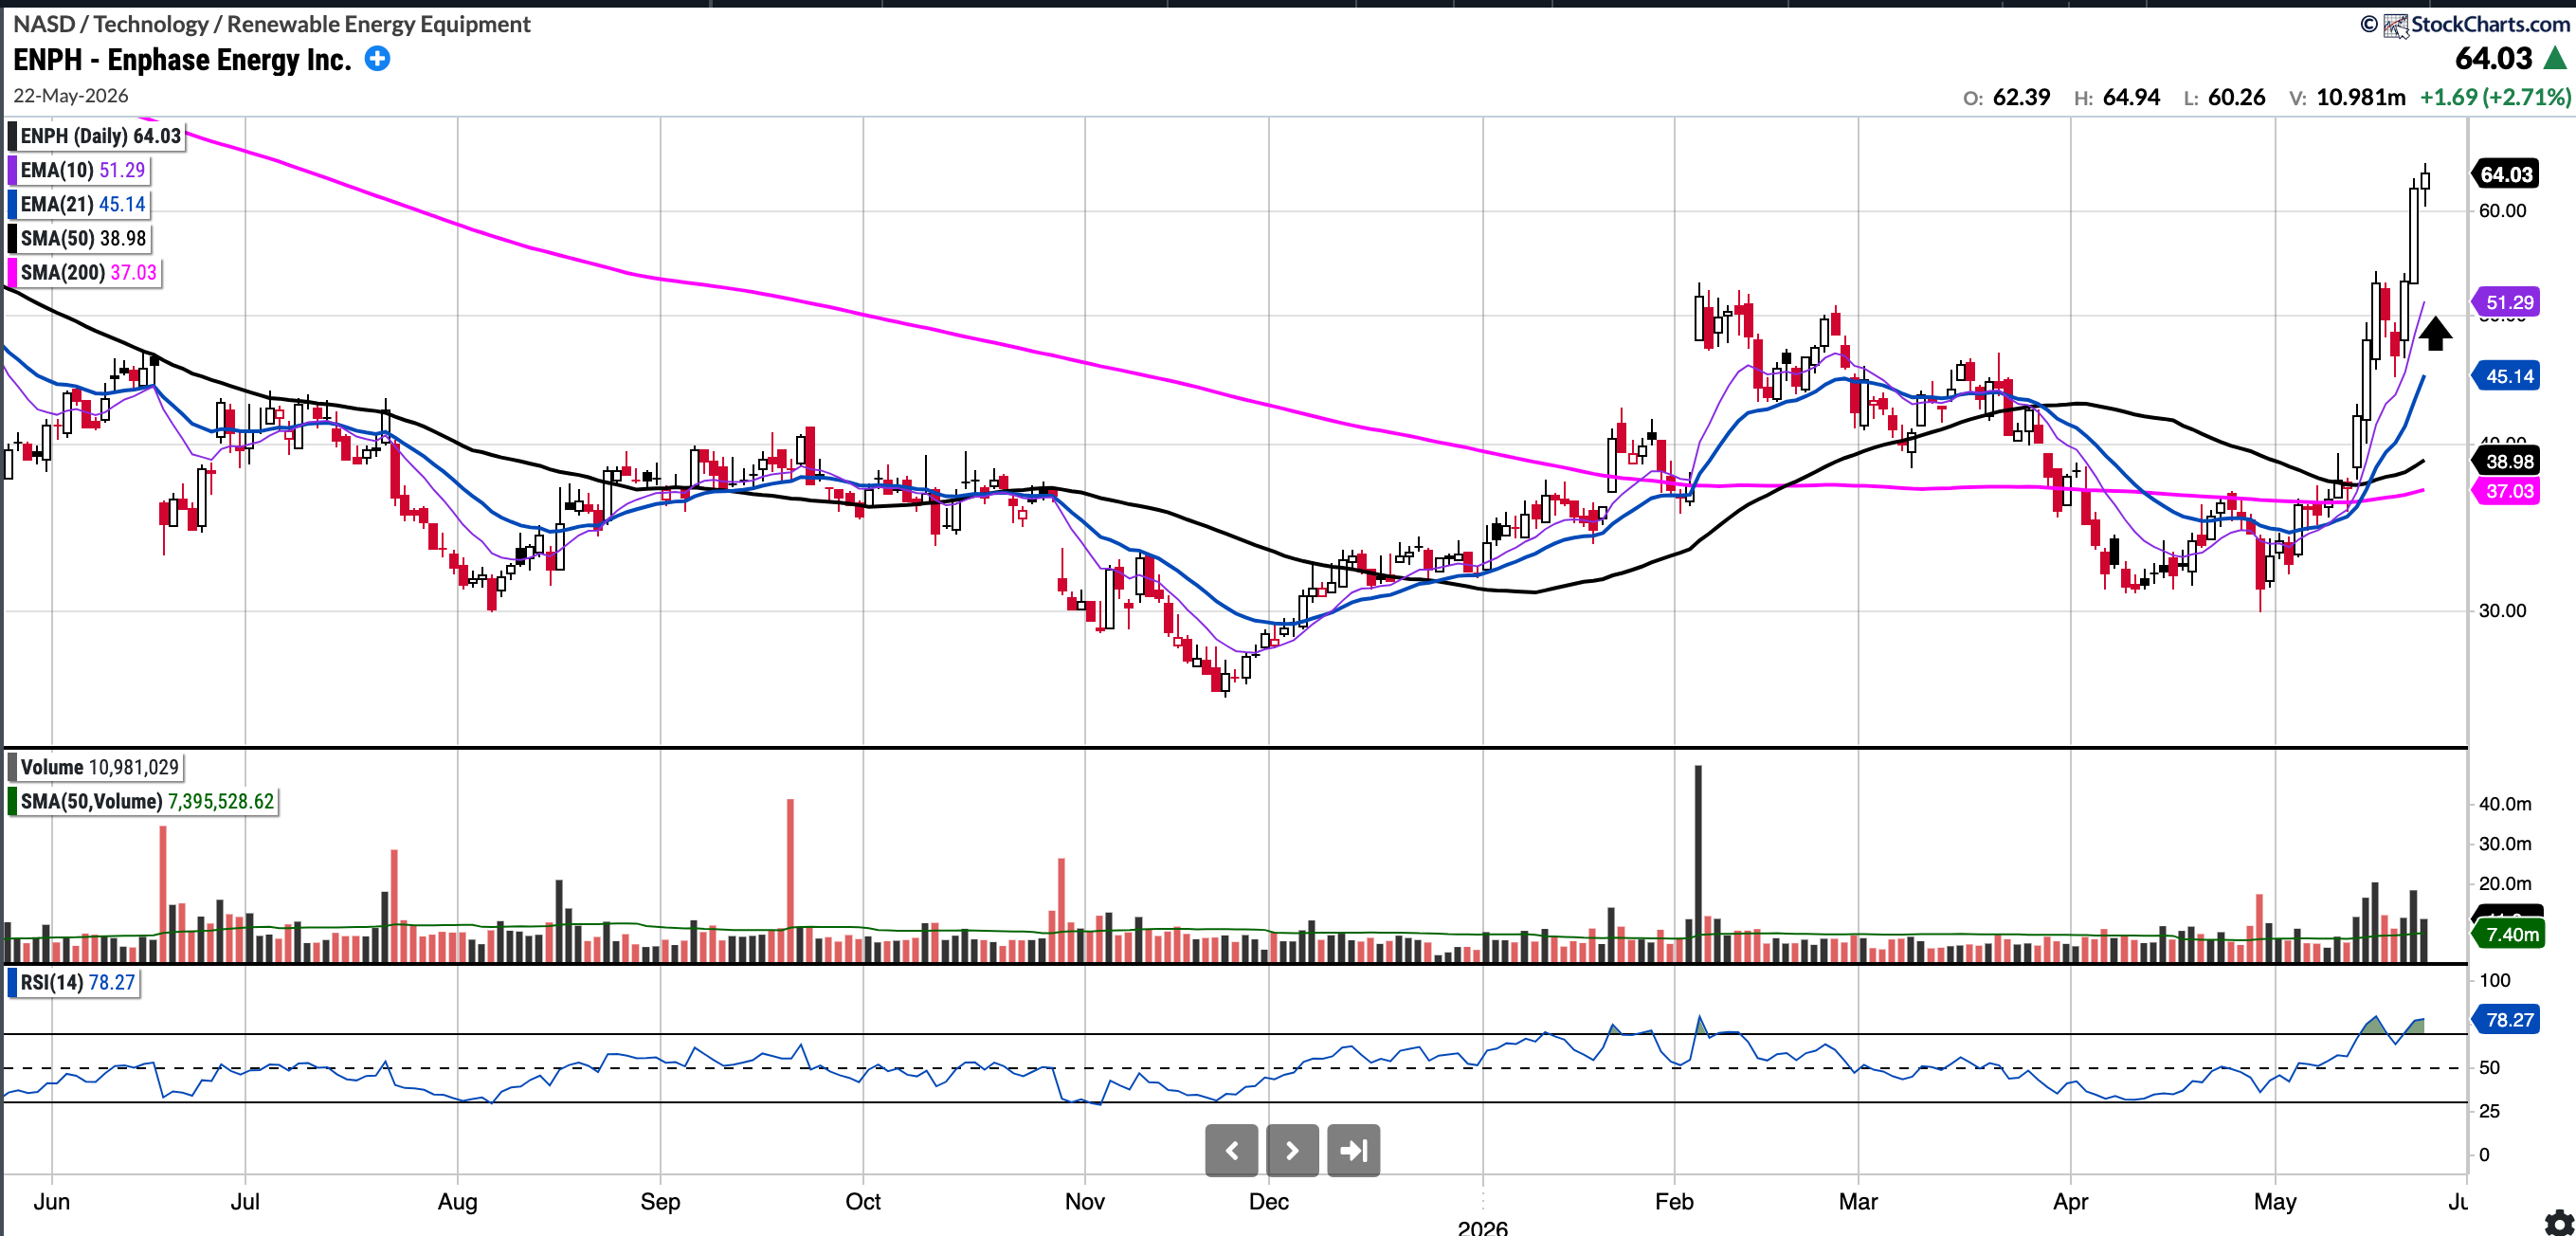
ENPH
Currently trades at $64.03, 64.27% above the 50SMA and 72.92% above the 200SMA
RSI 78.27
89.72% YTD
ENPH stock has had a sharp rebound in recent days, driven by a strategic pivot into high-growth AI data centre power equipment and a short squeeze amplifying gains. The chart is starting to look more constructive. A pullback to the 10-day EMA ($51.29), which coincides with the breakout level, could offer an interesting entry spot. Conversely, a pullback to the 21-day EMA at $45.14 could also present an opportunity.
Important: I will feature several other Trading ideas in the Watchlist Snapshot post, so keep a look out for that post later.
Recent weeks post (link below) had countless positions responding to key levels and running sharply such as:
ASTS 74 to 107
FLY 32 to 50
NOK 12.4 to 15.4
CRWV 101 to 117
CIFR 18 to 23
CRCL 109 to 130

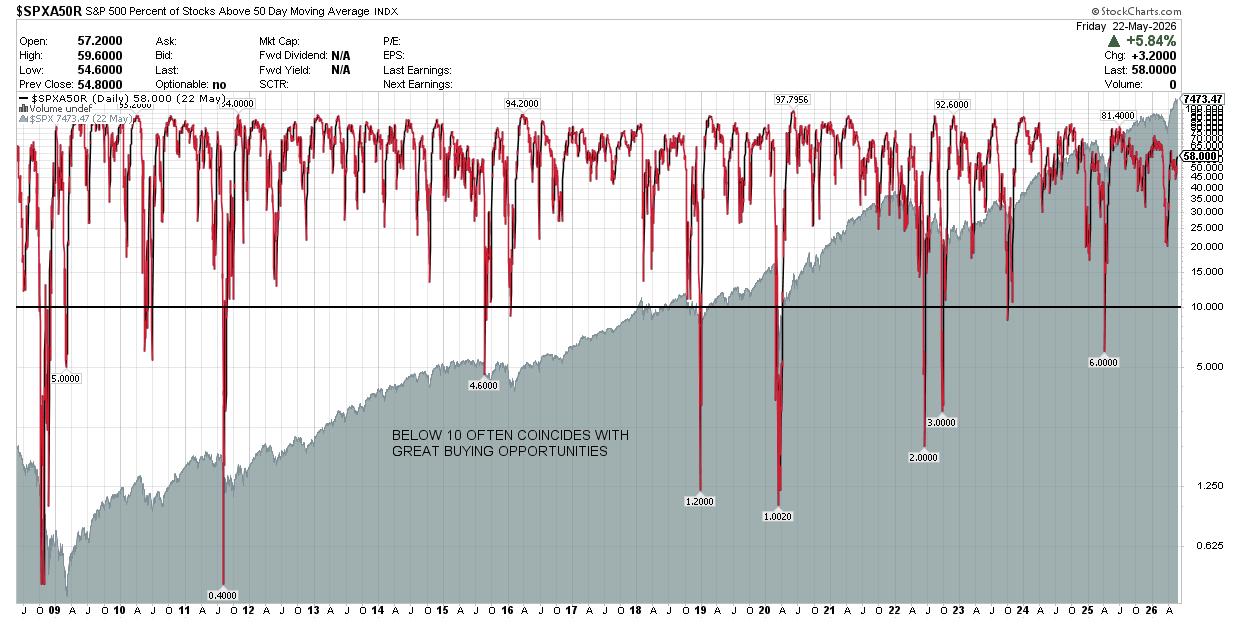
S&P 500 Percentage of Stocks Above the 50 Day Moving Average: Currently 58.0
Breadth improved this week, with the percentage of stocks above the 50-day moving average rising from 44% to 58%.
Notable portfolio changes in previous week (all updated live in subscriber channels):
