
Preview of the Week Ahead: W/C May 18, 2026
SPX with another all-time high weekly close, but semis finally cooling off. Correction or rotation?

Hope you all are having a good weekend. Below, we will be previewing the upcoming week’s events and providing a portfolio update as usual.
Format for what is covered in this weekly preview:
A Look at the Indices
Key Upcoming Economic Events
Upcoming Earnings Reports
Charts
Notable Portfolio Changes from the Previous Week
Current Portfolio Holdings
Position size, cost basis, and commentary on each holding regarding the intended holding period and any planned activity
Closing Thoughts
I recommend checking out the most recent Monthly Portfolio and Performance Update below:

Also, ensure you read the free, easy-to-understand write-up on COIN I put together with Position Journal

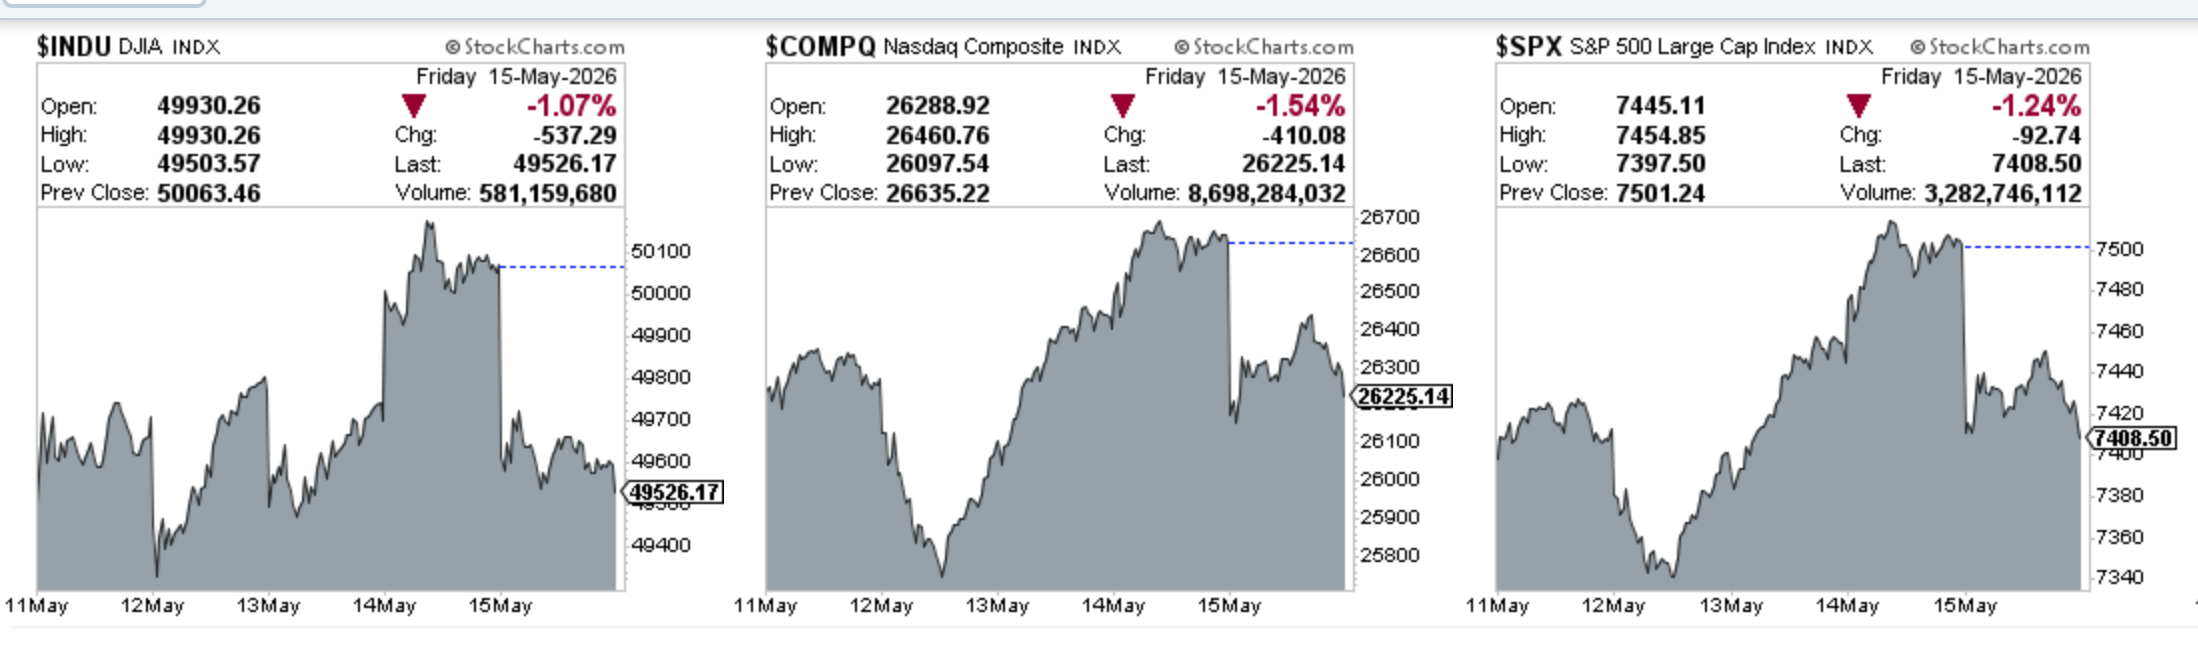
Indices
Dow Jones declined 0.07% in the last week
S&P 500 advanced 0.1% in the last week
Nasdaq Composite advanced 0.02% in the last week
IWM declined 2.5% in the last week
Key upcoming economic events
Monday, May 18
NAHB Housing Market Index (May): (10:00 AM ET)
TIC Net Long-Term Transactions (March): (4:00 PM ET)
Tuesday, May 19
Fed Governor Christopher Waller Speech: (9:00 AM ET)
Pending Home Sales (April): (10:00 AM ET)
Wednesday, May 20
FOMC Meeting Minutes: (2:00 PM ET) The main event of the week.
Fed Governor Michael Barr Speech: (9:15 AM ET)
Thursday, May 21
Initial Jobless Claims: (8:30 AM ET)
Housing Starts and Building Permits (April): (8:30 AM ET)
Philadelphia Fed Manufacturing Index (May): (8:30 AM ET)
Friday, May 22
S&P Global Flash US PMI (May): (9:45 AM ET)
University of Michigan Consumer Sentiment Index (May - Final): (10:00 AM ET)
Upcoming Earnings
Below is the infographic by Earnings Whispers highlighting the schedule for this week:

Charts
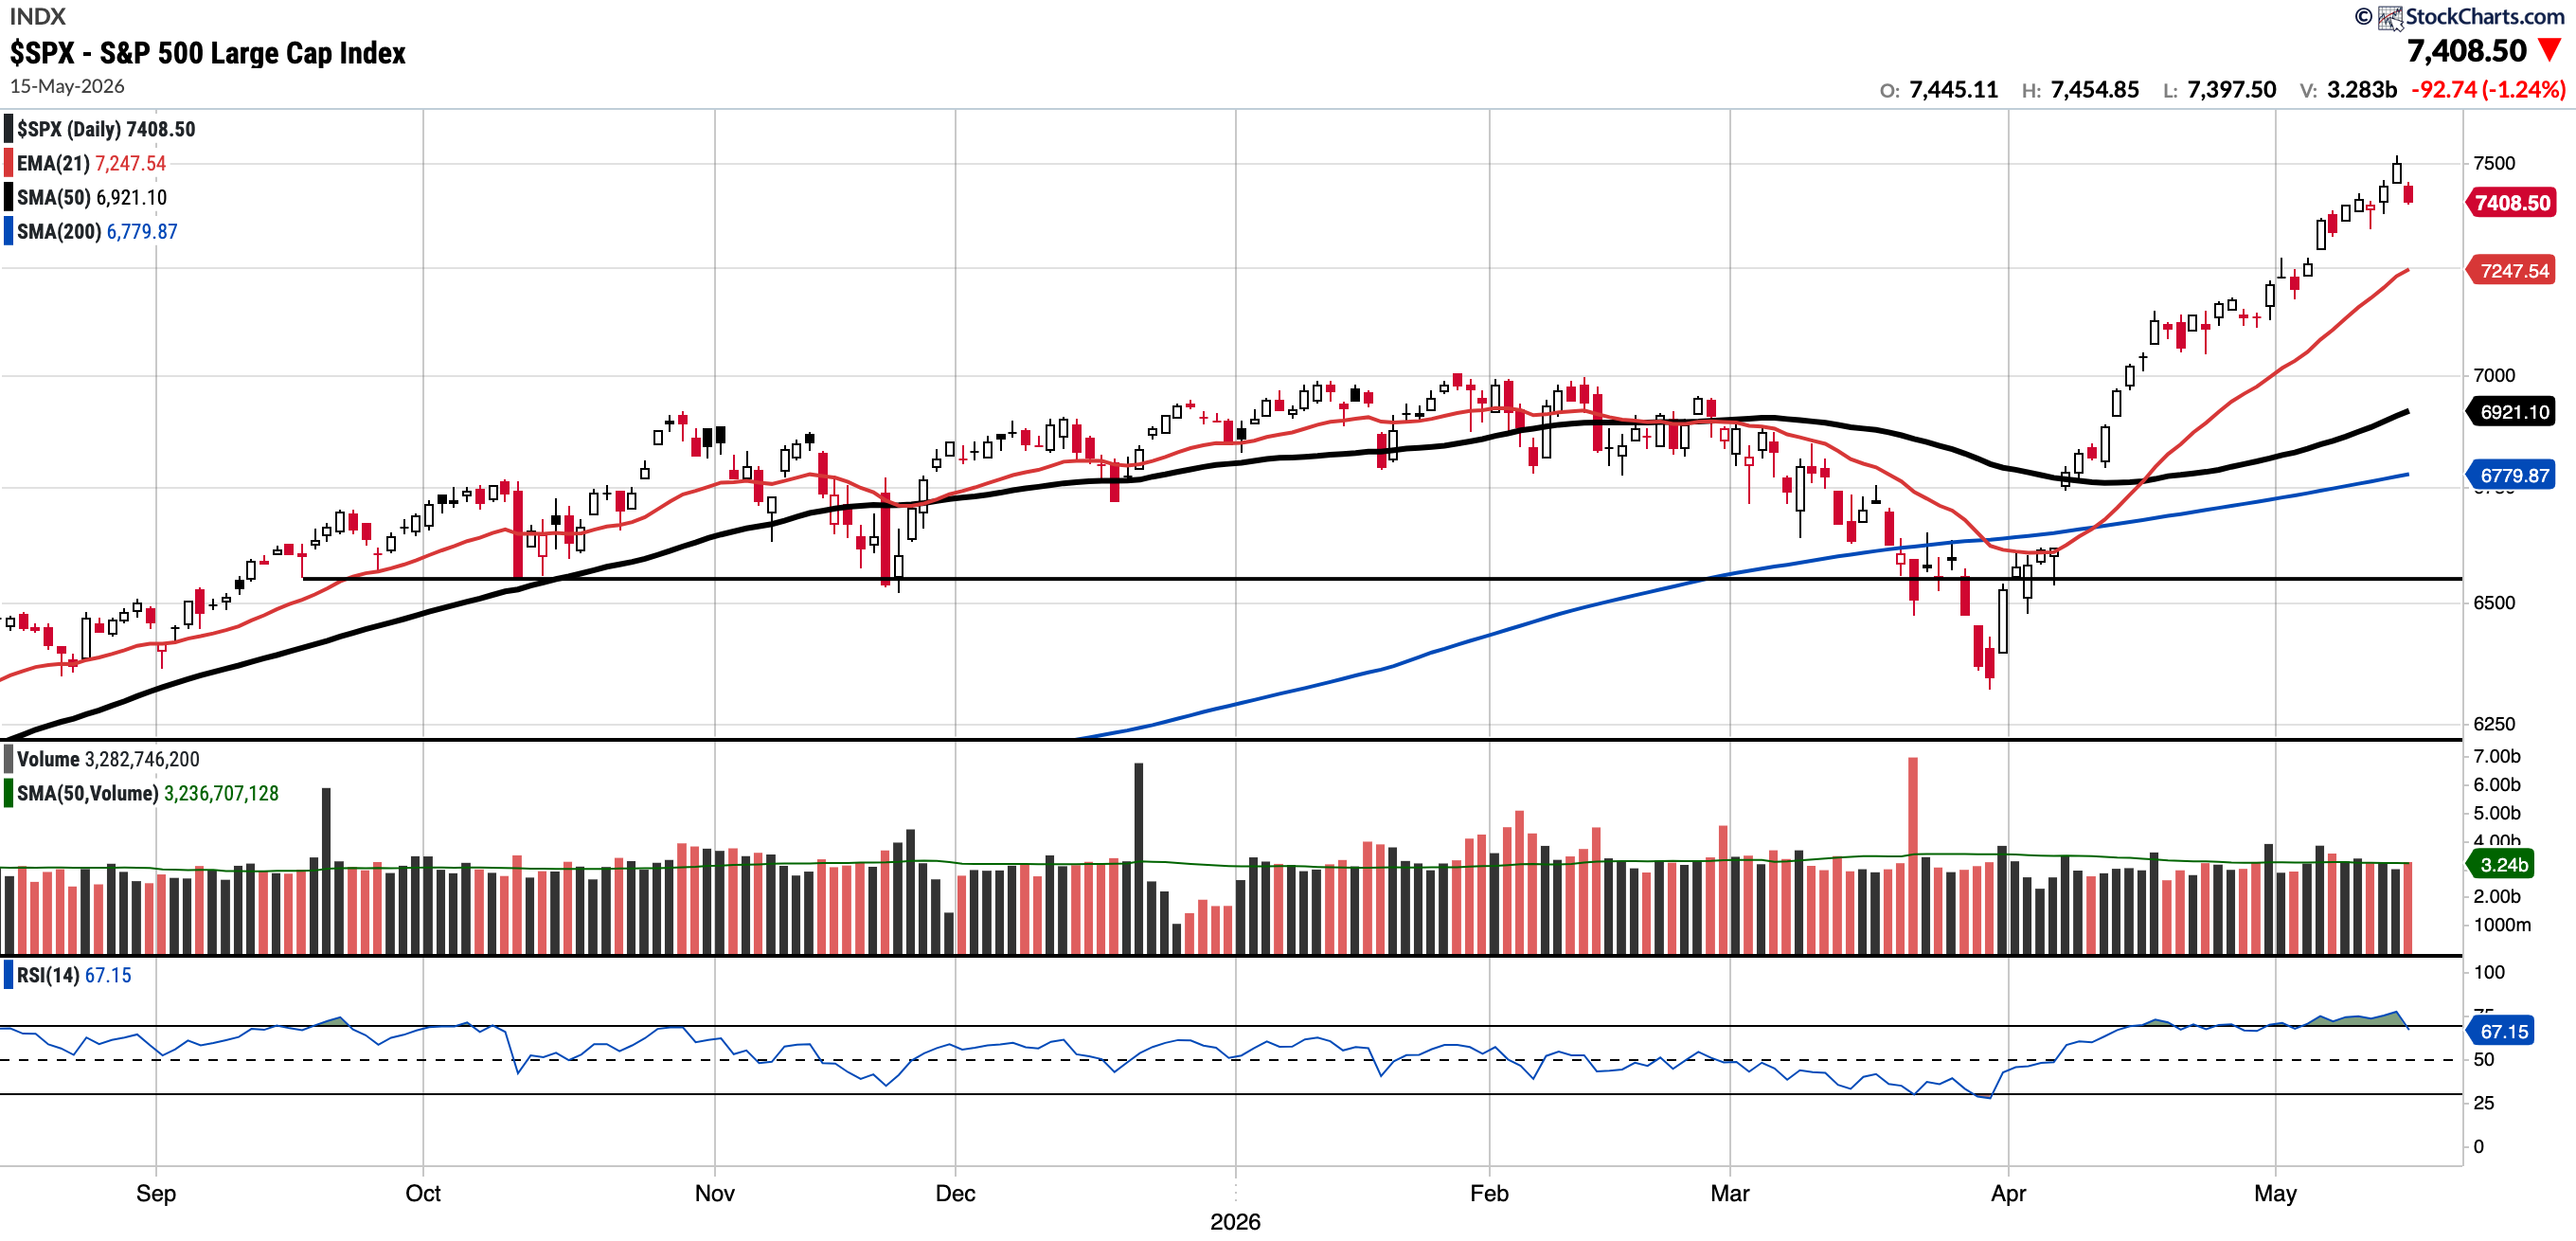
SPX
Currently trades at 7,408.50, 7.04% above the 50SMA and 9.27% above the 200SMA.
RSI 67.15
8.02% YTD
Distribution days in the last week: 1
The SPX reached another all-time high weekly close, though it did have a distribution day to end the week and found resistance at the top of the trendline (see below) Still, it has been a remarkable V-shaped recovery from the March 30 lows.

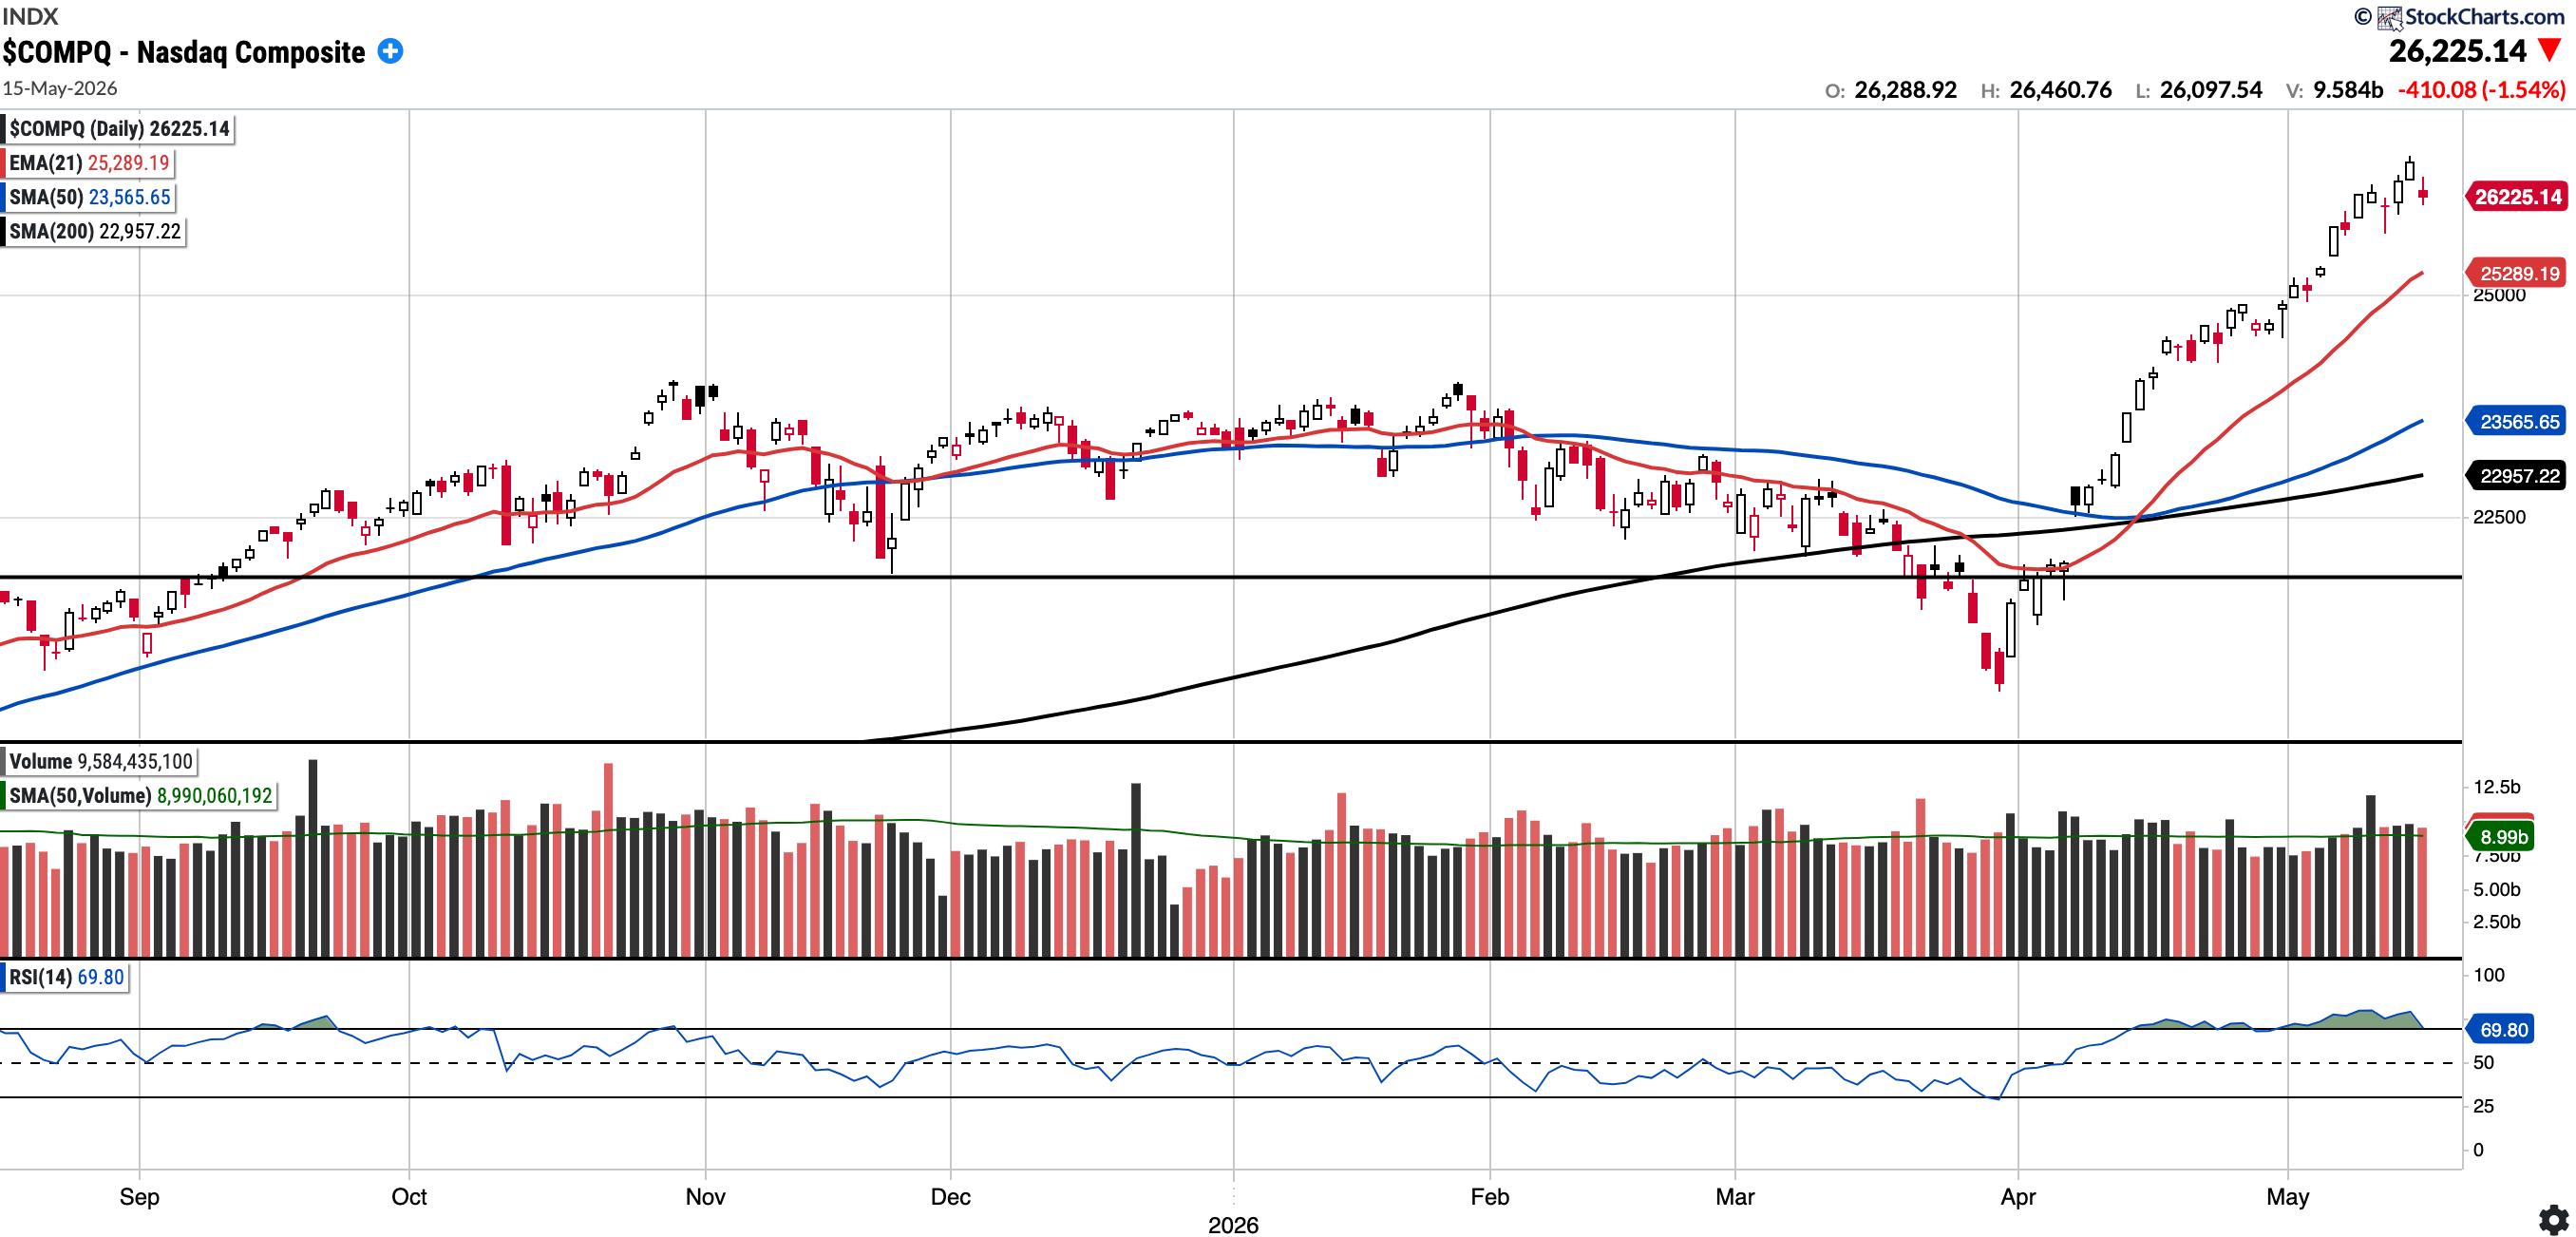
COMPQ
Currently trades at 26,225.14, 11.29% above the 50SMA and 14.23% above the 200SMA.
RSI 69.8
12.87% YTD
Distribution days in the last week: 1
The Nasdaq Composite, like the SPX, had an all-time high weekly close, though it also ended with a distribution day. It still remains quite extended, currently trading 11.29% above its 50-day SMA.
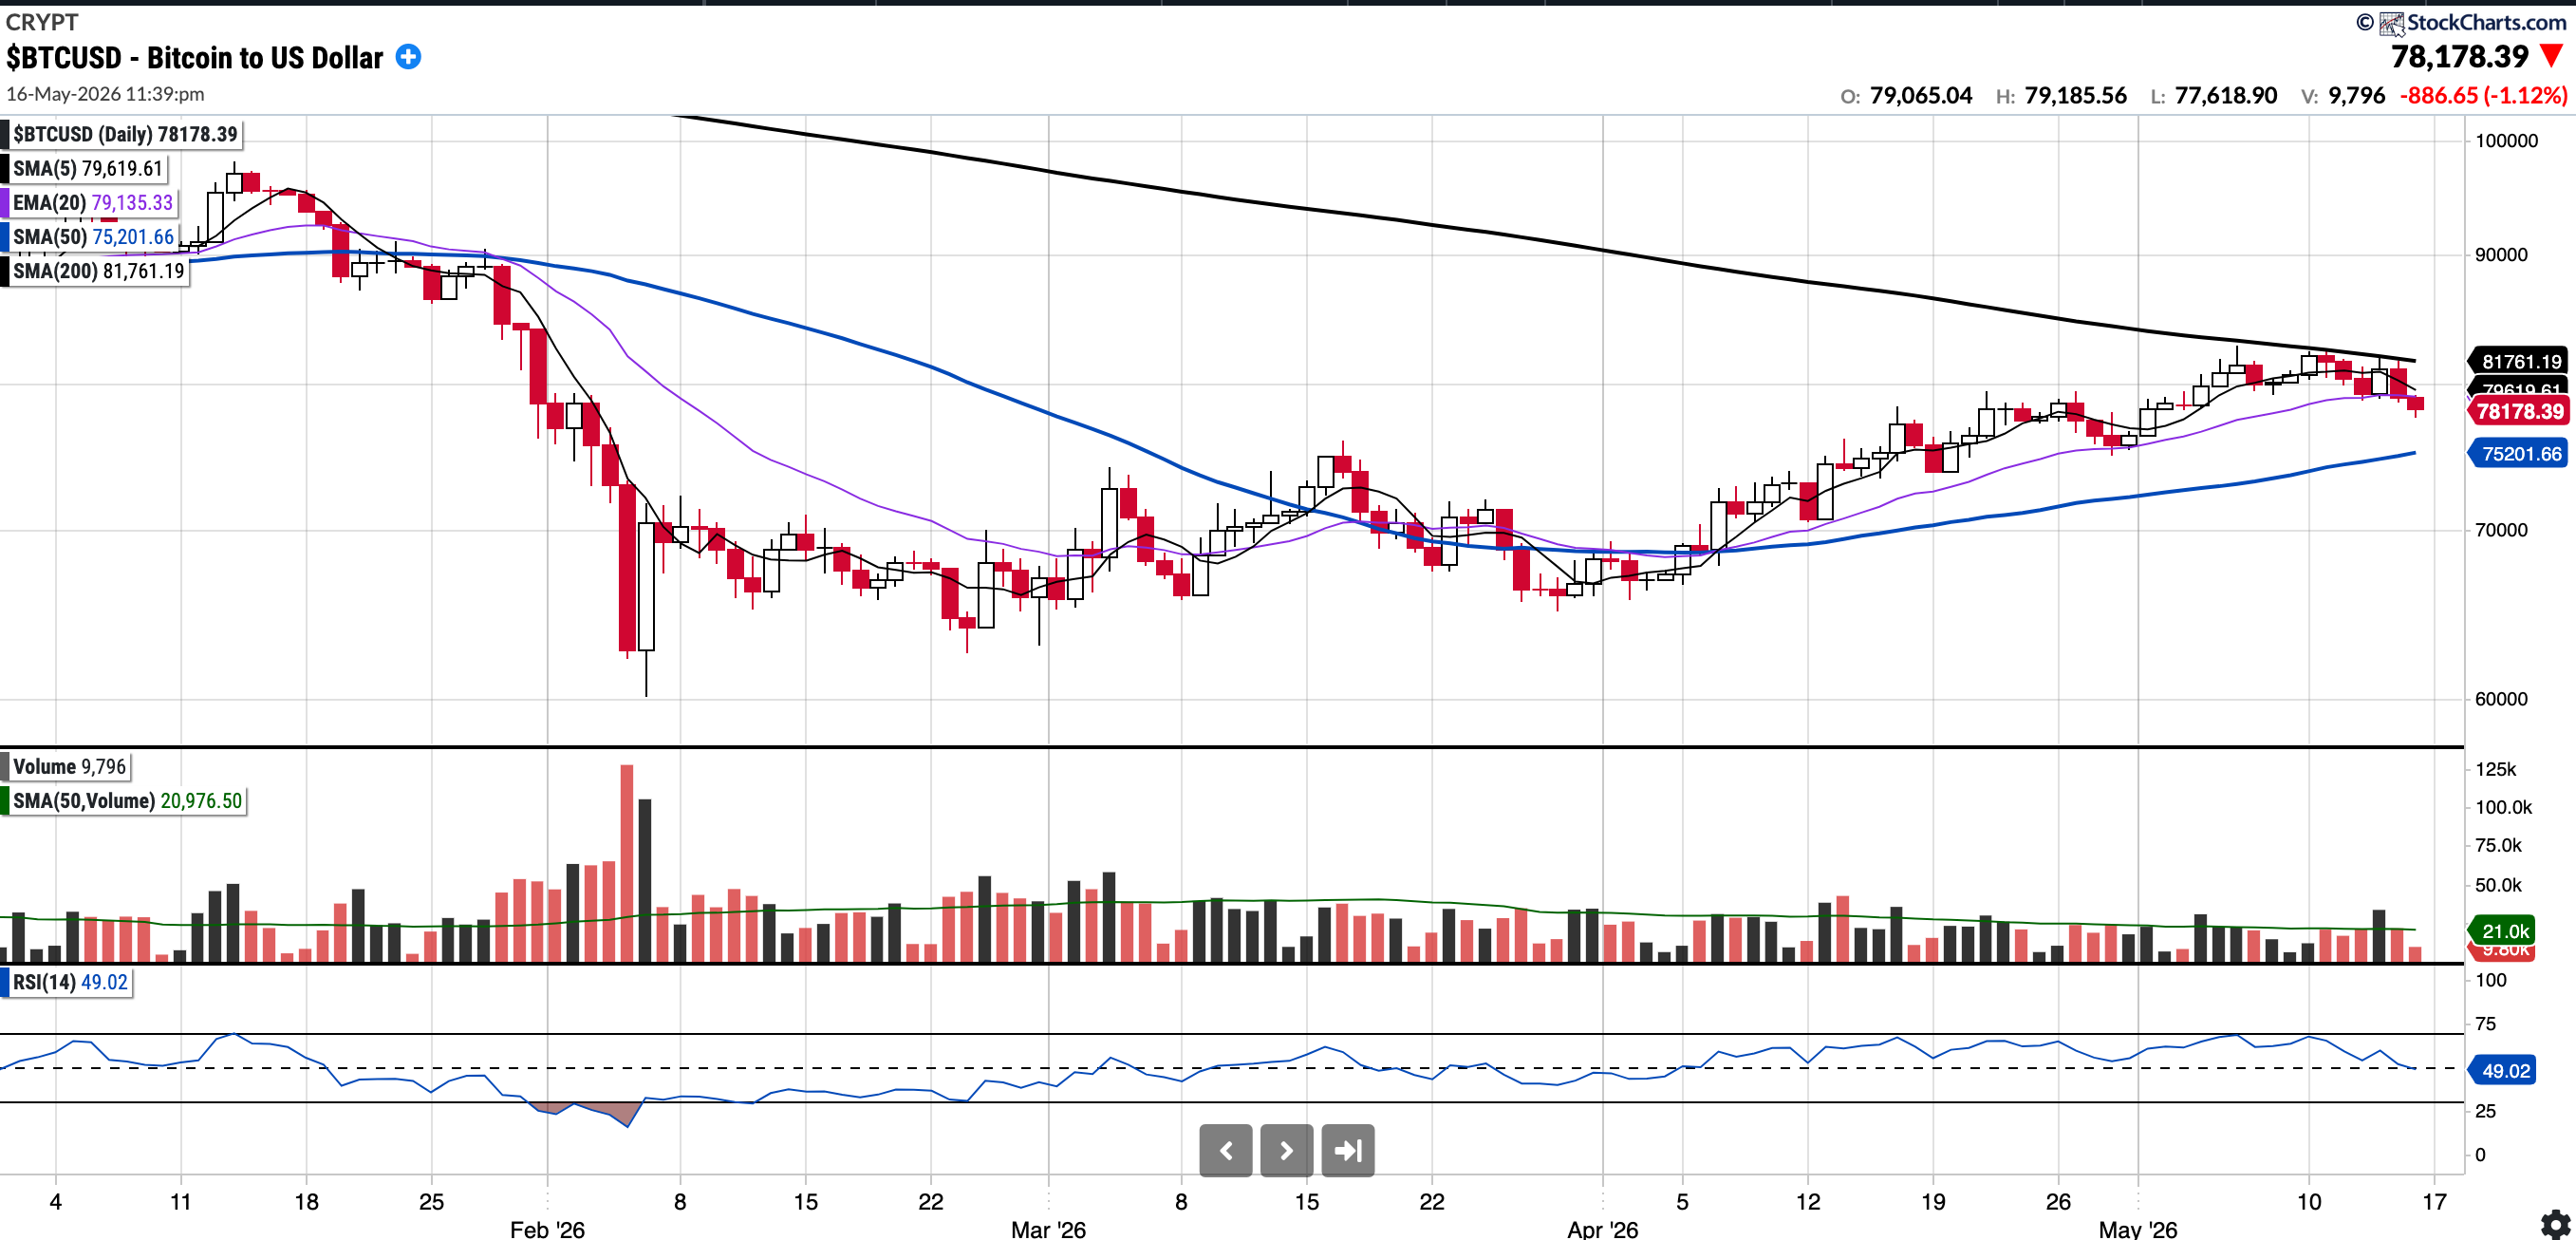
BTC (currently Long)
Currently trades at $78,178.39, 3.96% above the 50SMA and 4.38% below the 200SMA.
RSI 49.02
-10.69% YTD.
Since testing the 200-week moving average on Thursday, February 5th, Bitcoin has traded primarily within the $63,000–$70,000 range. However, we broke out of that consolidation recently, reaching highs of $82,900 this week.
Last week I had written:
Given the more constructive price action of late and the likelihood of the Clarity Act passing, BTC may reclaim the 200-day soon.
The U.S. Senate Banking Committee did successfully pass the Digital Asset Market Clarity Act in a bipartisan 15–9 vote this week, advancing the critical cryptocurrency regulation framework to the full Senate. While this initially served as a boon for crypto assets including Bitcoin, the initial move was undone and BTC still could not surpass the 200-day moving average (81,761)
As of Sunday at 00:52 BST, BTC is trading above its SMA 50; however, it has lost the nearer-term moving averages. It does remain comfortably above the $74,000 level though, which I previously noted as a key area.
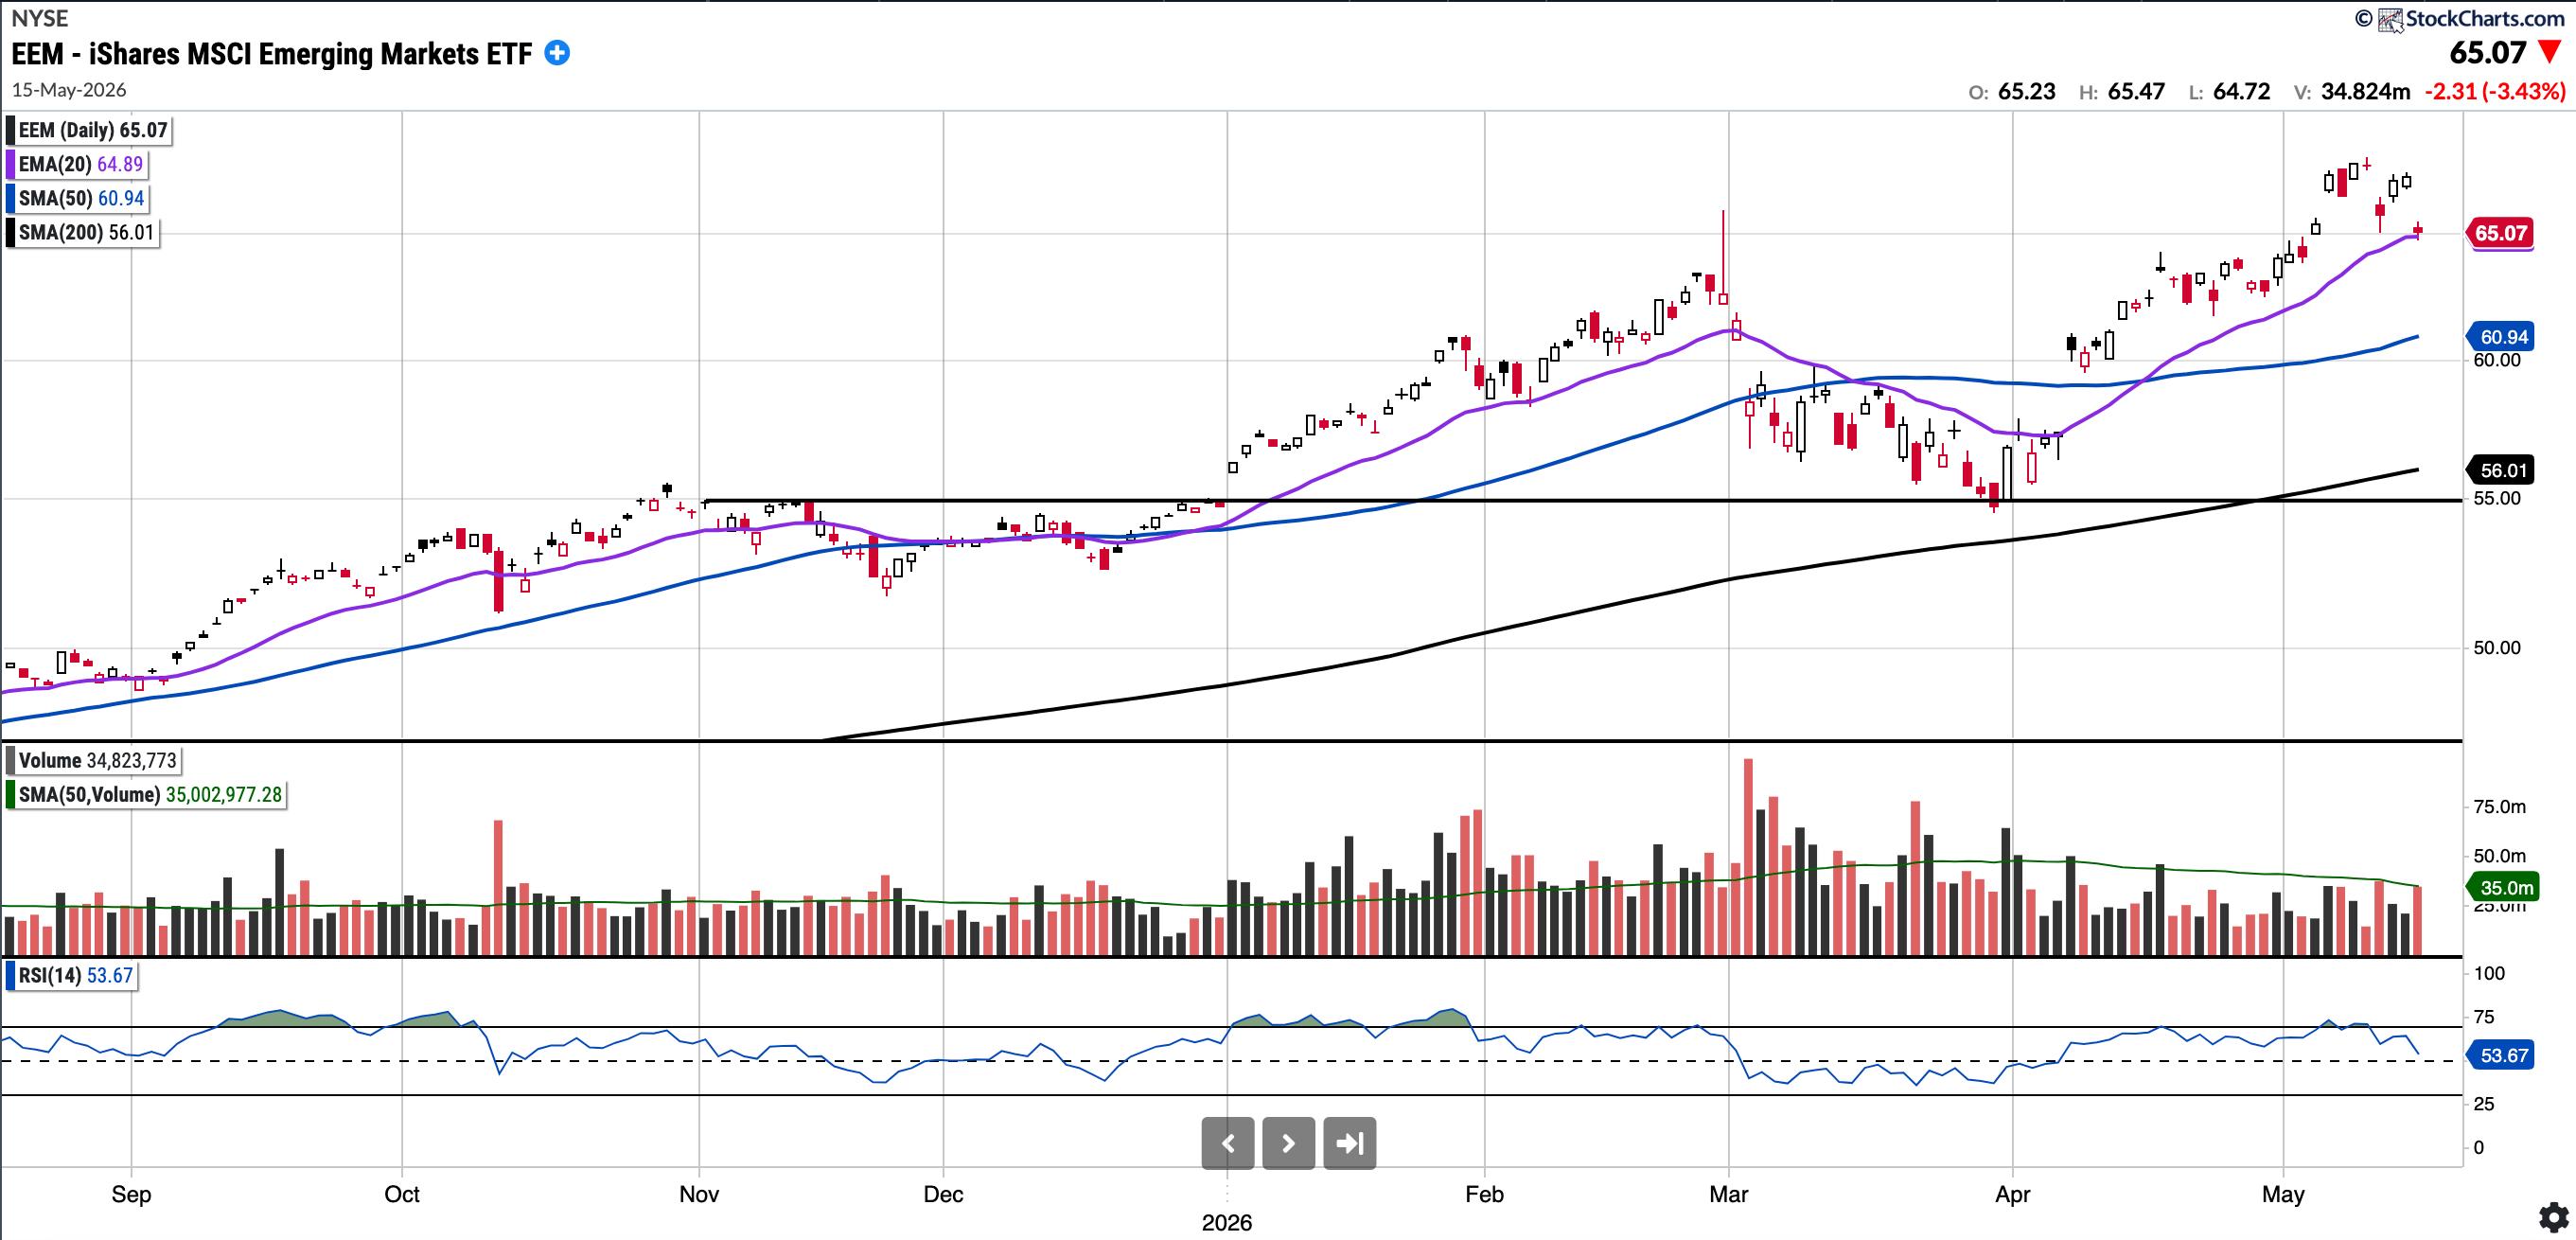
EEM
Currently trades at $65.07, 6.78% above the 50SMA and 16.17% above the 200SMA
RSI 53.67
+15.7% YTD
EEM remains in a strong uptrend and continues to outperform U.S. indices comfortably year-to-date by more than 700 bps. It has bounced remarkably from the late March lows.
It has pulled back to test the 21-day EMA; however, below this, the levels to watch for pullback buys are the SMA 50 at 60.94 and then the $55/56 level (horizontal support and SMA 200). I would not expect it to trade as low as $55 again unless there are significant disturbances in the Middle East.
I believe EEM could be setting up for multi-year outperformance; hence, I continue to watch it closely.
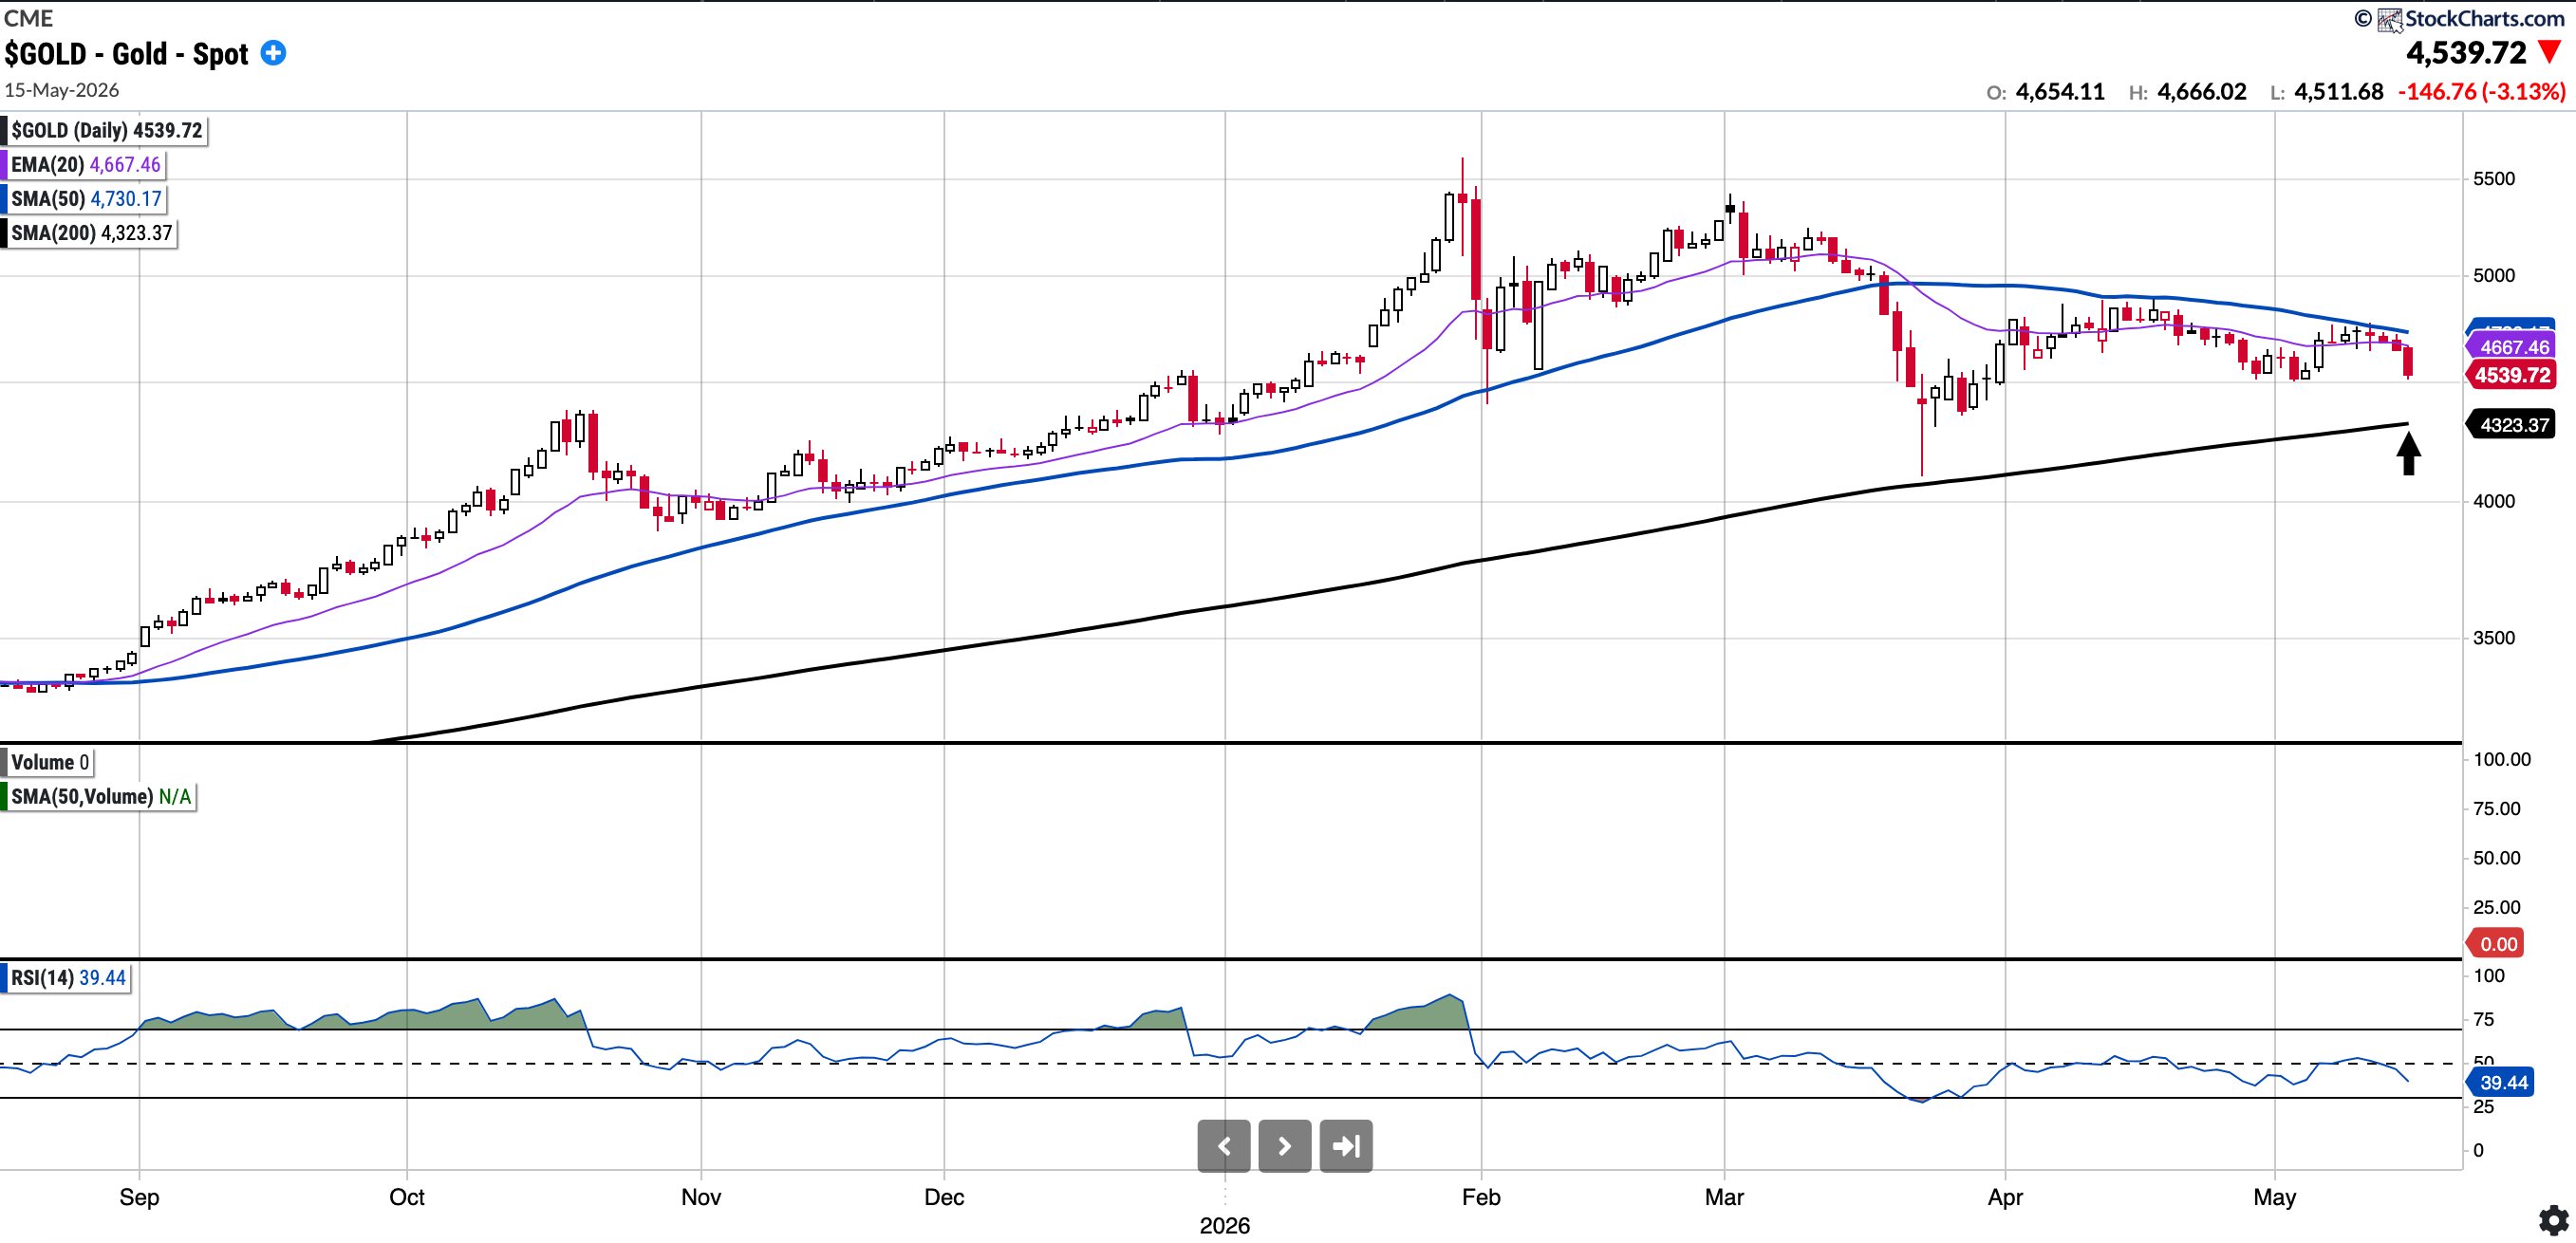
GOLD (Long Physical)
Currently trades at $4539.72, 4.03% below the 50SMA and 5.00% above the 200SMA
RSI 39.44
5.02% YTD
Gold remains in a well defined uptrend, though it it is below the EMA 20 and SMA 50. The SMA 50 has been serving as a strong resistance level. The 200 day moving average at 4323 below looks possible on any further weakness. I will be a buyer there.
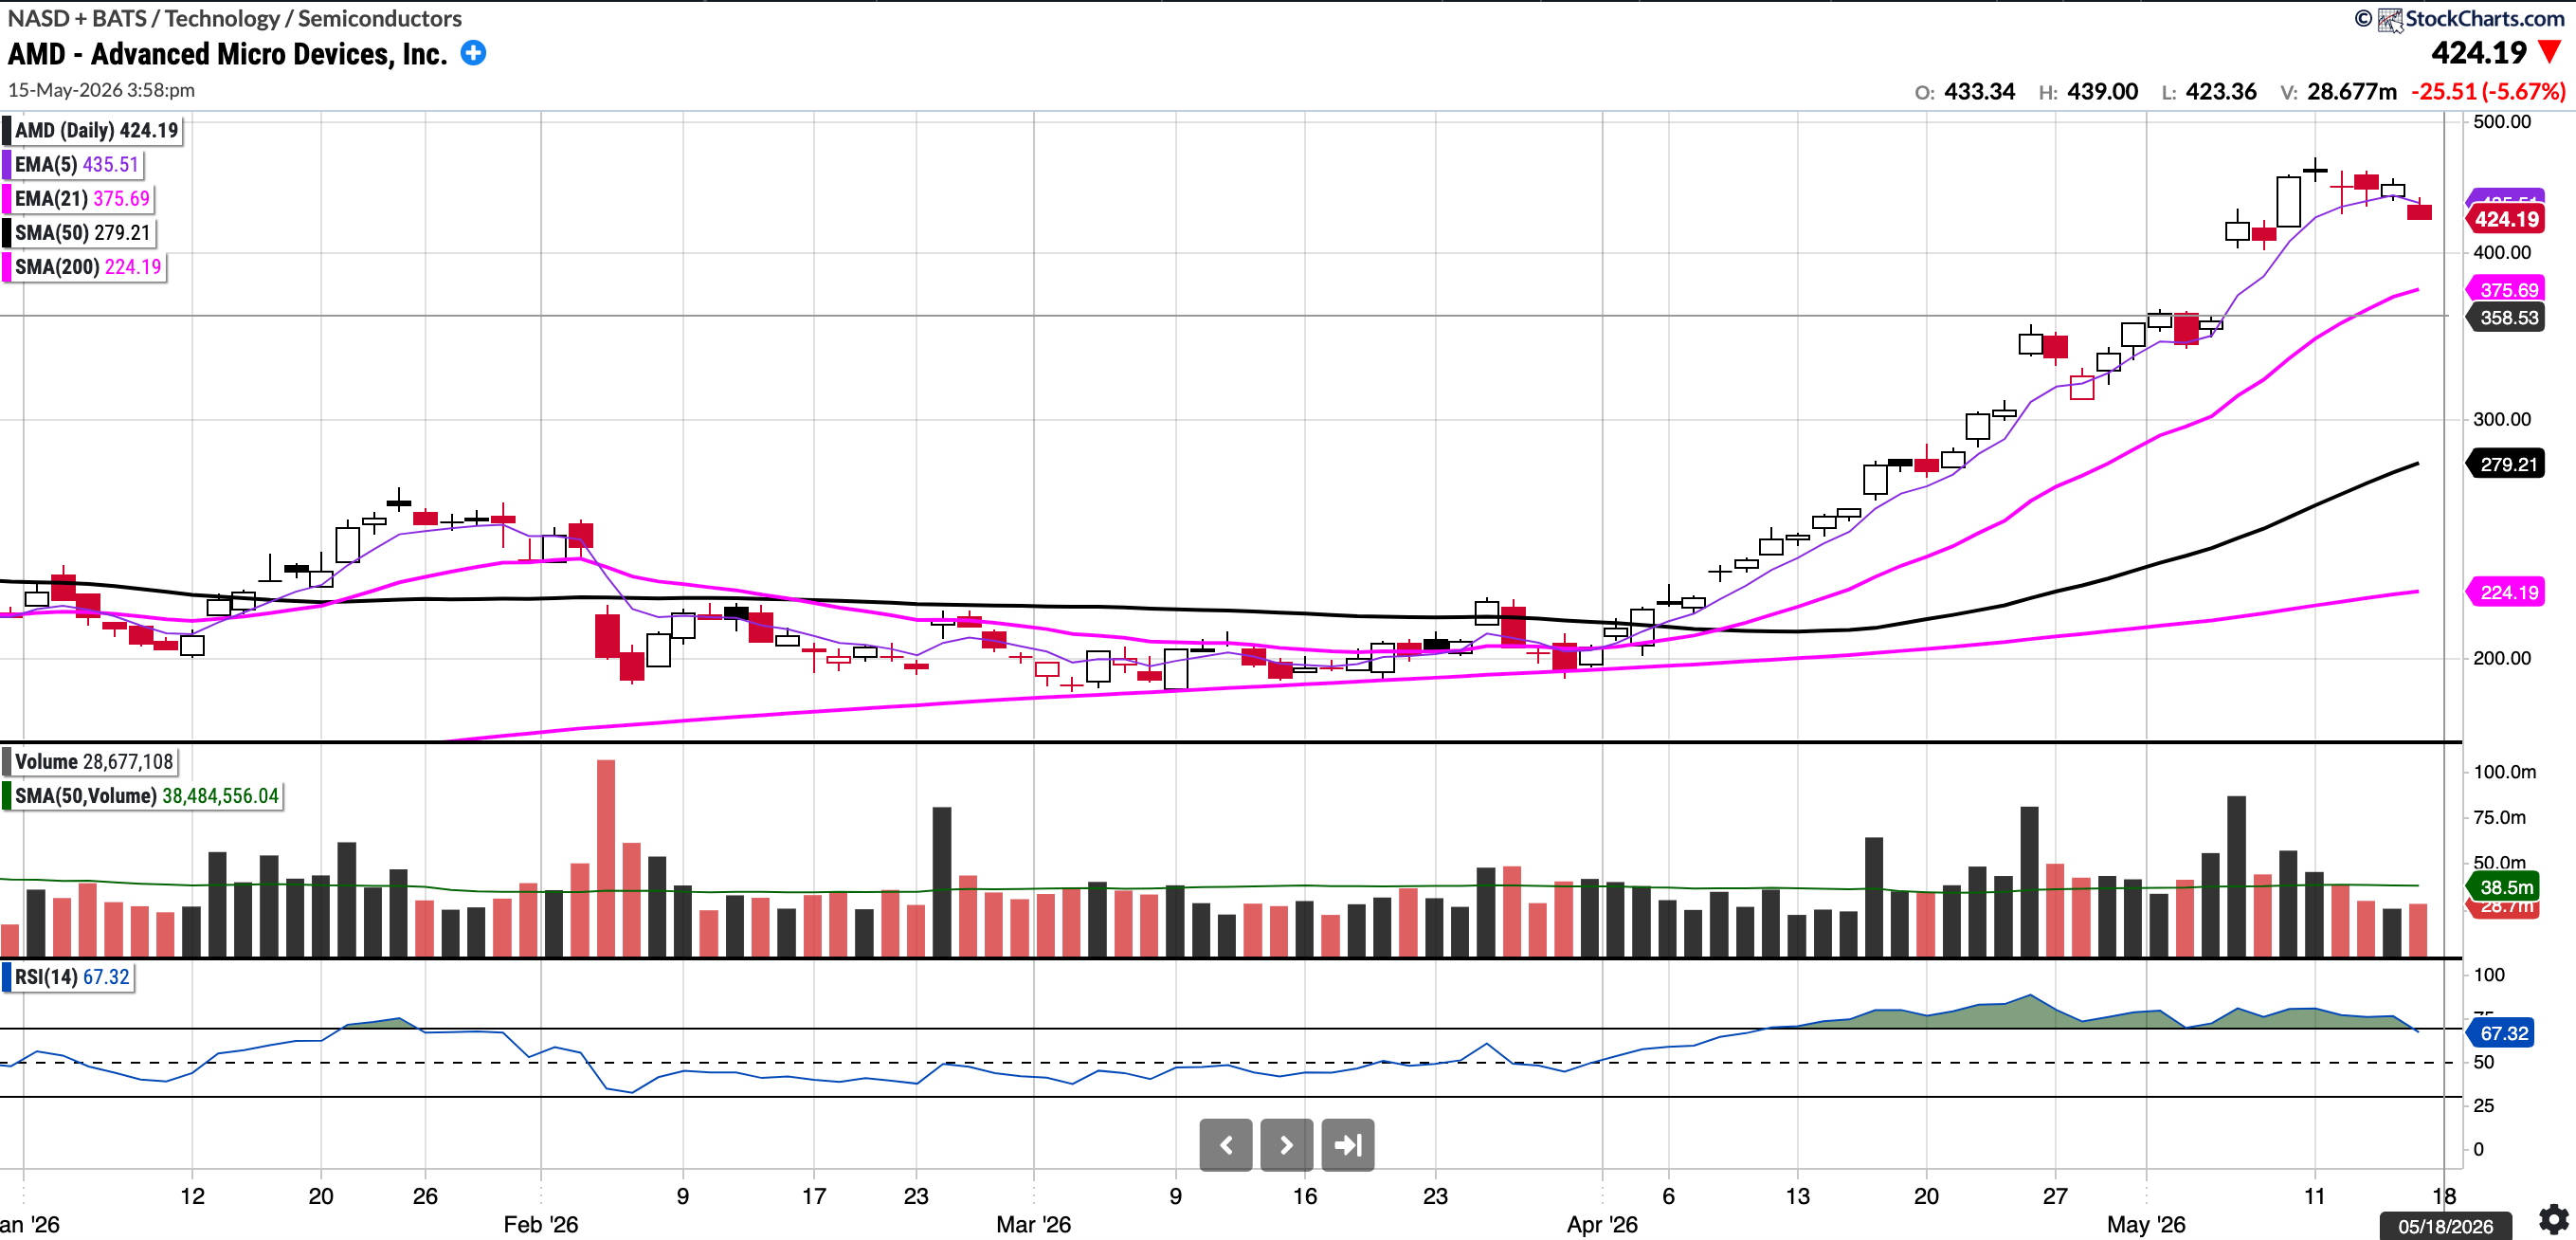
AMD
Currently trades at $424.1, 51.89% above the 50SMA and 89.17% above the 200SMA
RSI 67.32
89.78% YTD
Last week about AMD I had written:
Of note, AMD is now 109% above its 200-day moving average, typically, 70% is considered extended for a large-cap liquid stock.
AMD was down 8.86% on the week, though this just constitutes consolidation for now. A pullback to the mid-300s could be interesting for a gap fill and EMA-21 re-test.
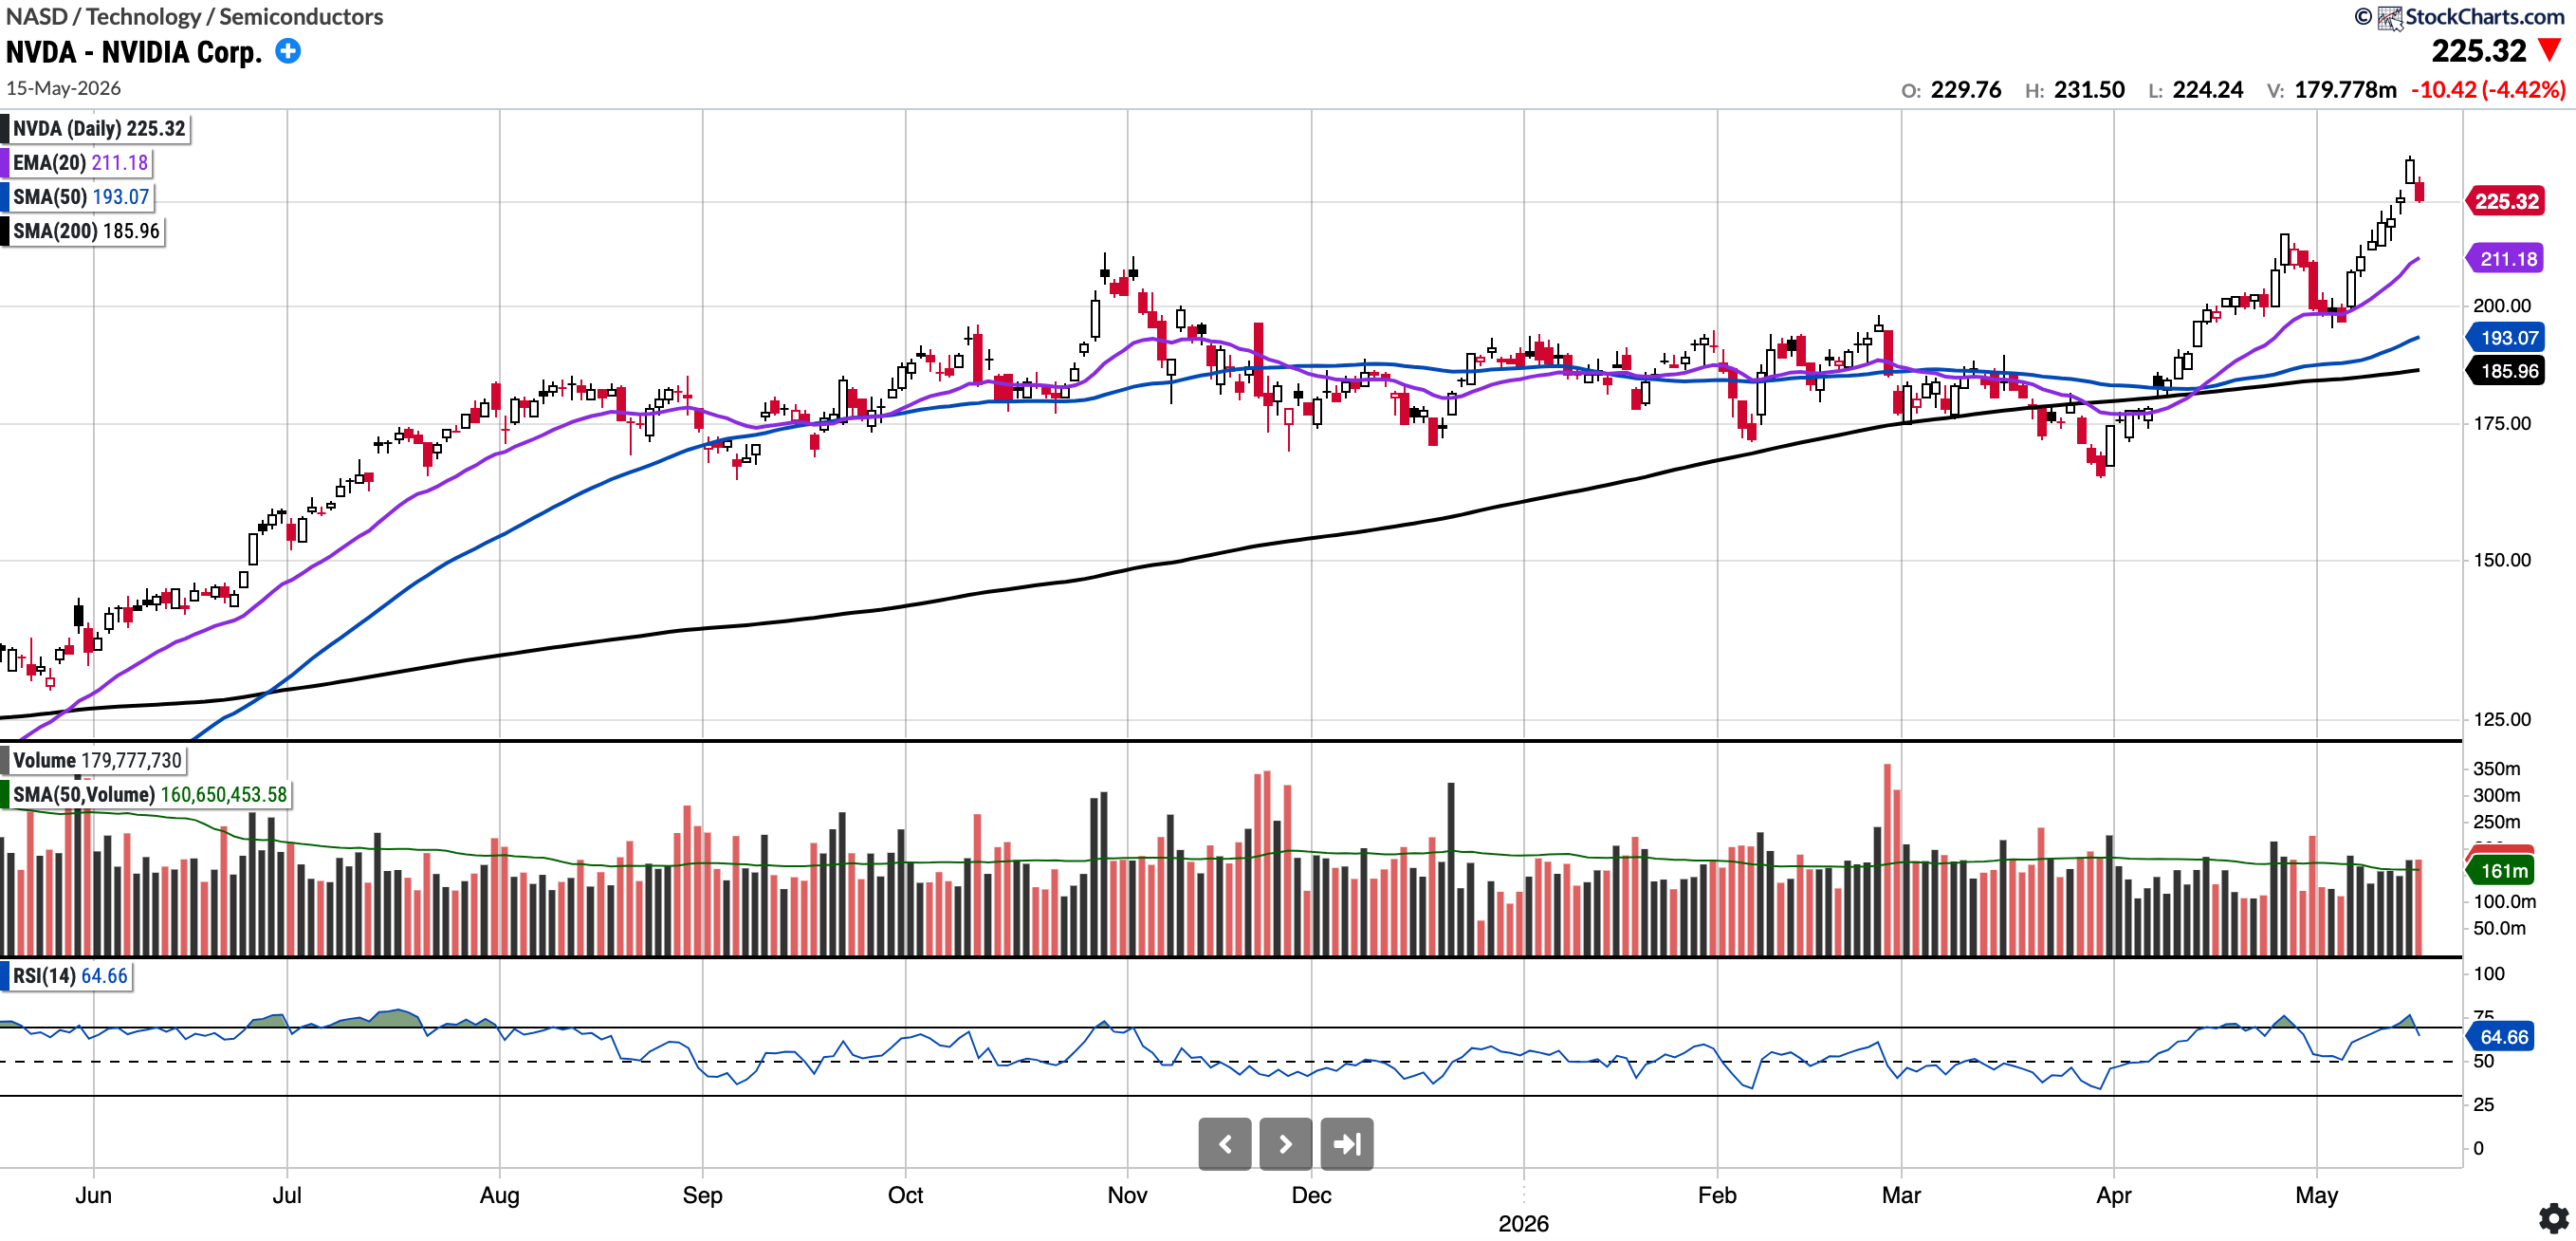
NVDA
Currently trades at $225.32, 16.7% above the 50SMA and 21.17% above the 200SMA
RSI 67.32
19.32% YTD
NVDA was featured a few weeks ago when it was trading at $208 (see below), at which time I had written that a move above 212.19 could see it trading at 240.

NVDA did trade as high as 240.00 in early trading on Friday to complete the measured move, but it has since pulled back a few percentage points. Of note, NVDA tends to run 10% or so in the month leading into earnings, and it has continued that pattern leading into its print next week.
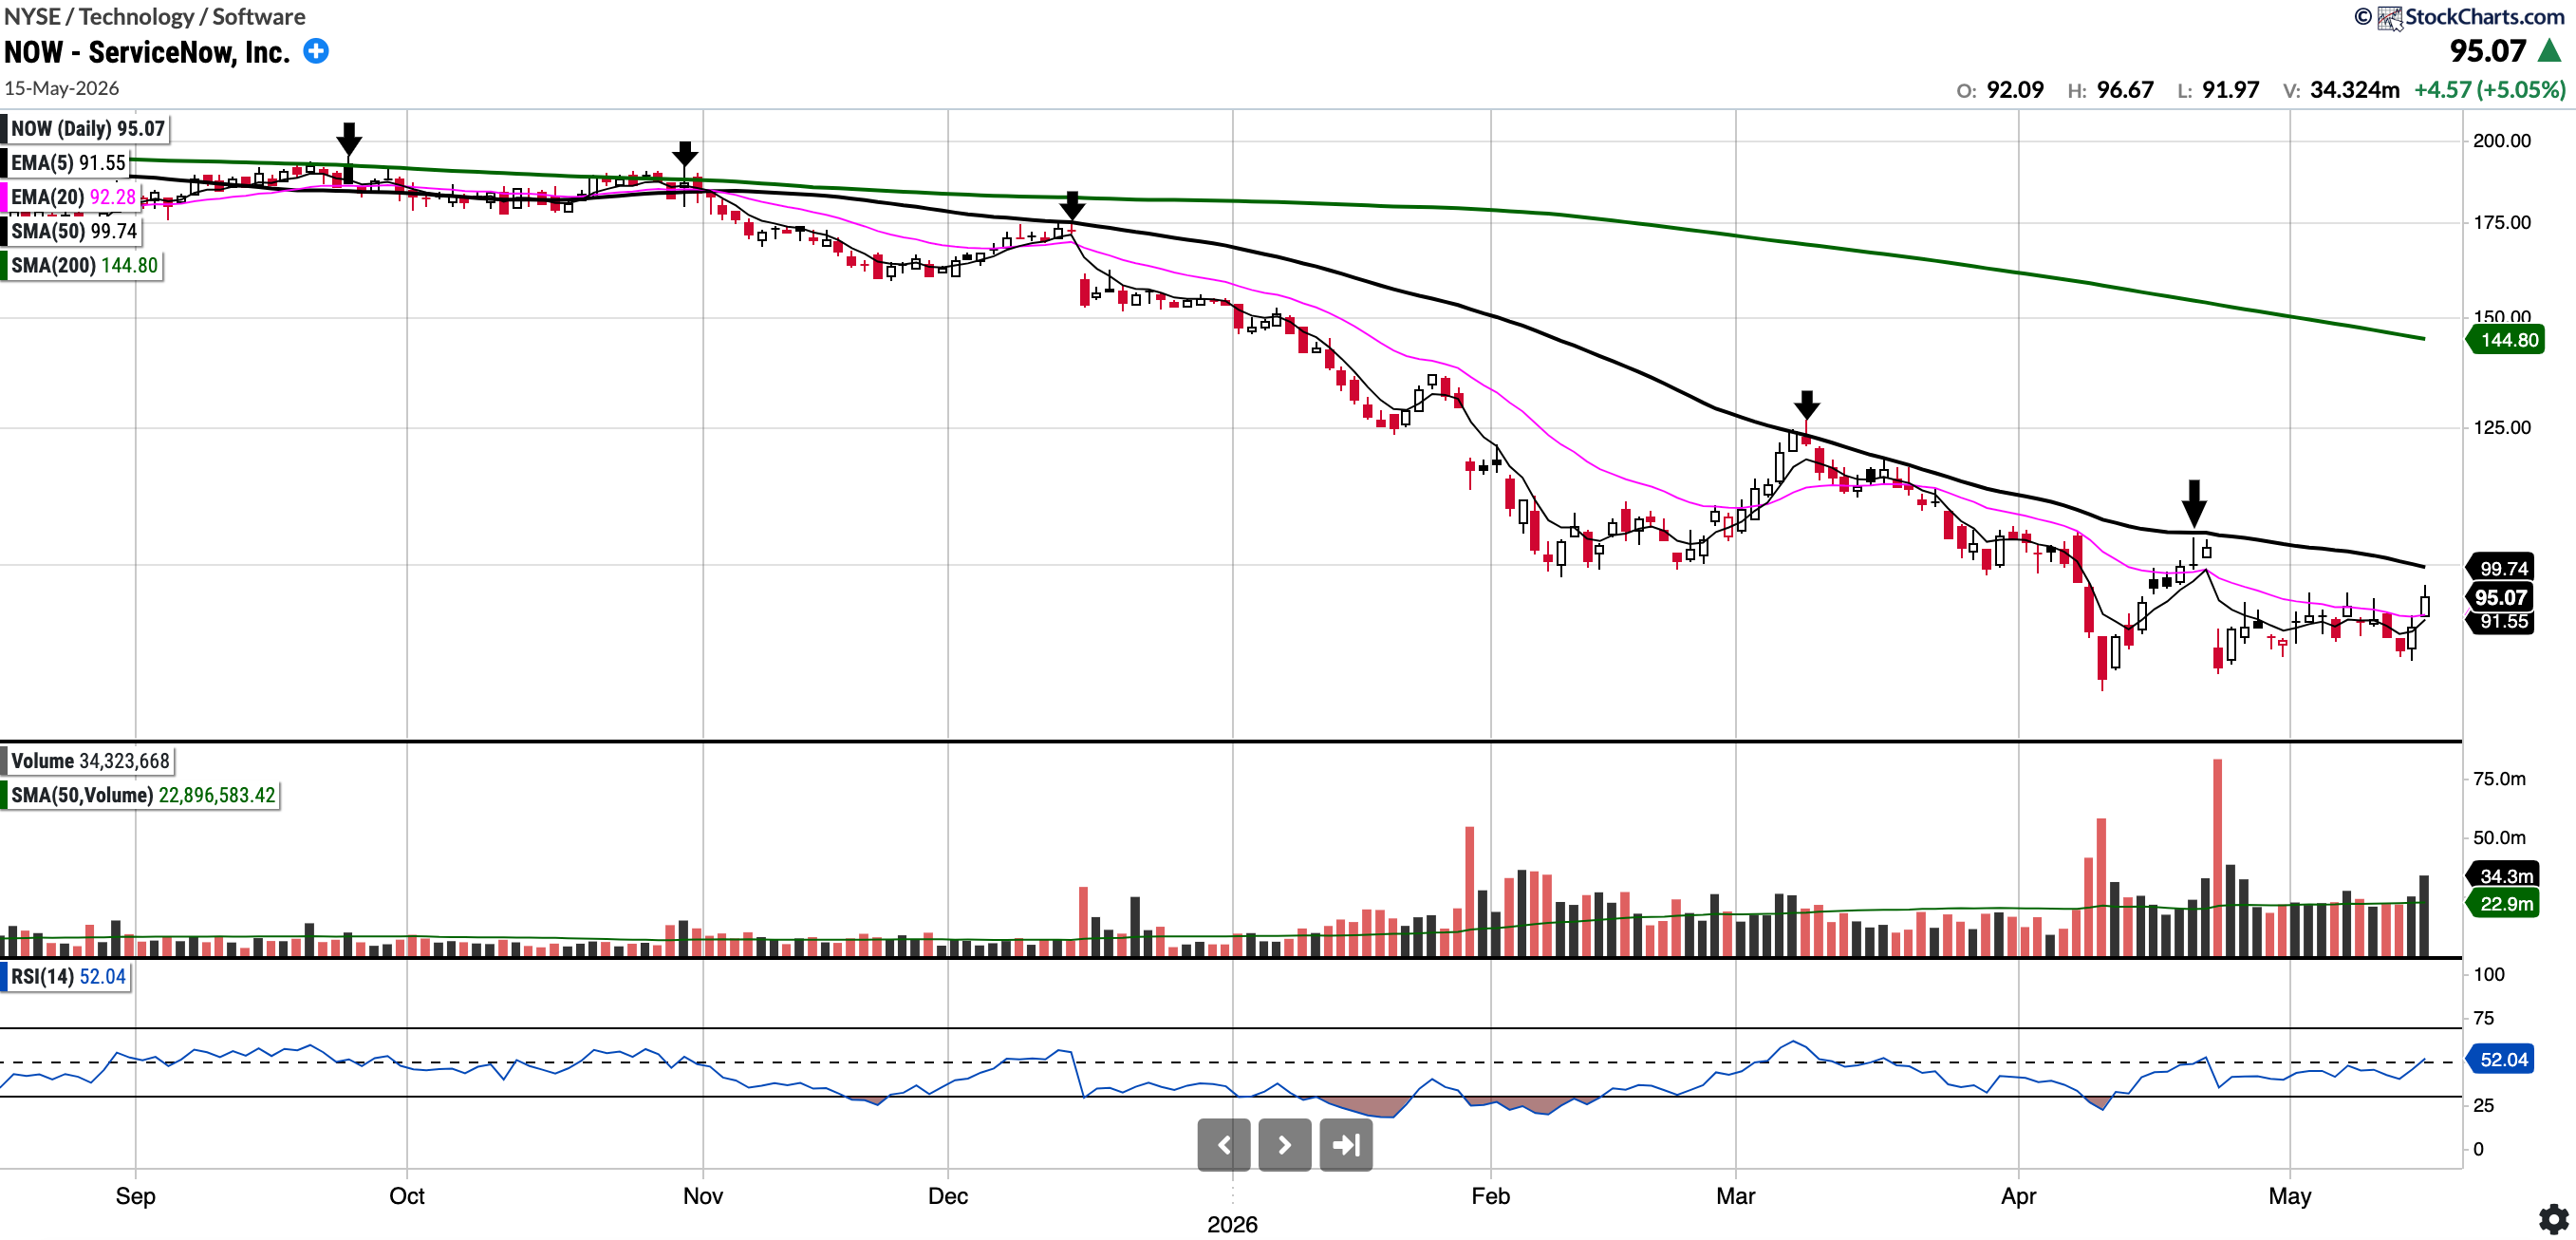
NOW (Long in Investing account at ~$94)
Currently trades at $95.07, 4.68% below the 50SMA and 34.34% below the 200SMA
RSI 60.69
-35.52% YTD
NOW has caught some investor attention recently. Insiders have been buying, and Jensen Huang has been praising the company, but it was revealed Trump personally owns this stock, accumulating it between February and March. As a trade, I do not think it is actionable yet; however, I wanted to highlight how, for a stock in a downtrend, the moving averages can serve as resistance.
NOW has found resistance at the descending 50 SMA every time over the last nine months (see arrows). Bulls would like to see the 5 EMA cross above the 20 EMA, then the 50 SMA flipped to support, and eventually cross above the 200-day SMA. This will take some time. A move above the 100 psych-level would also be very constructive.
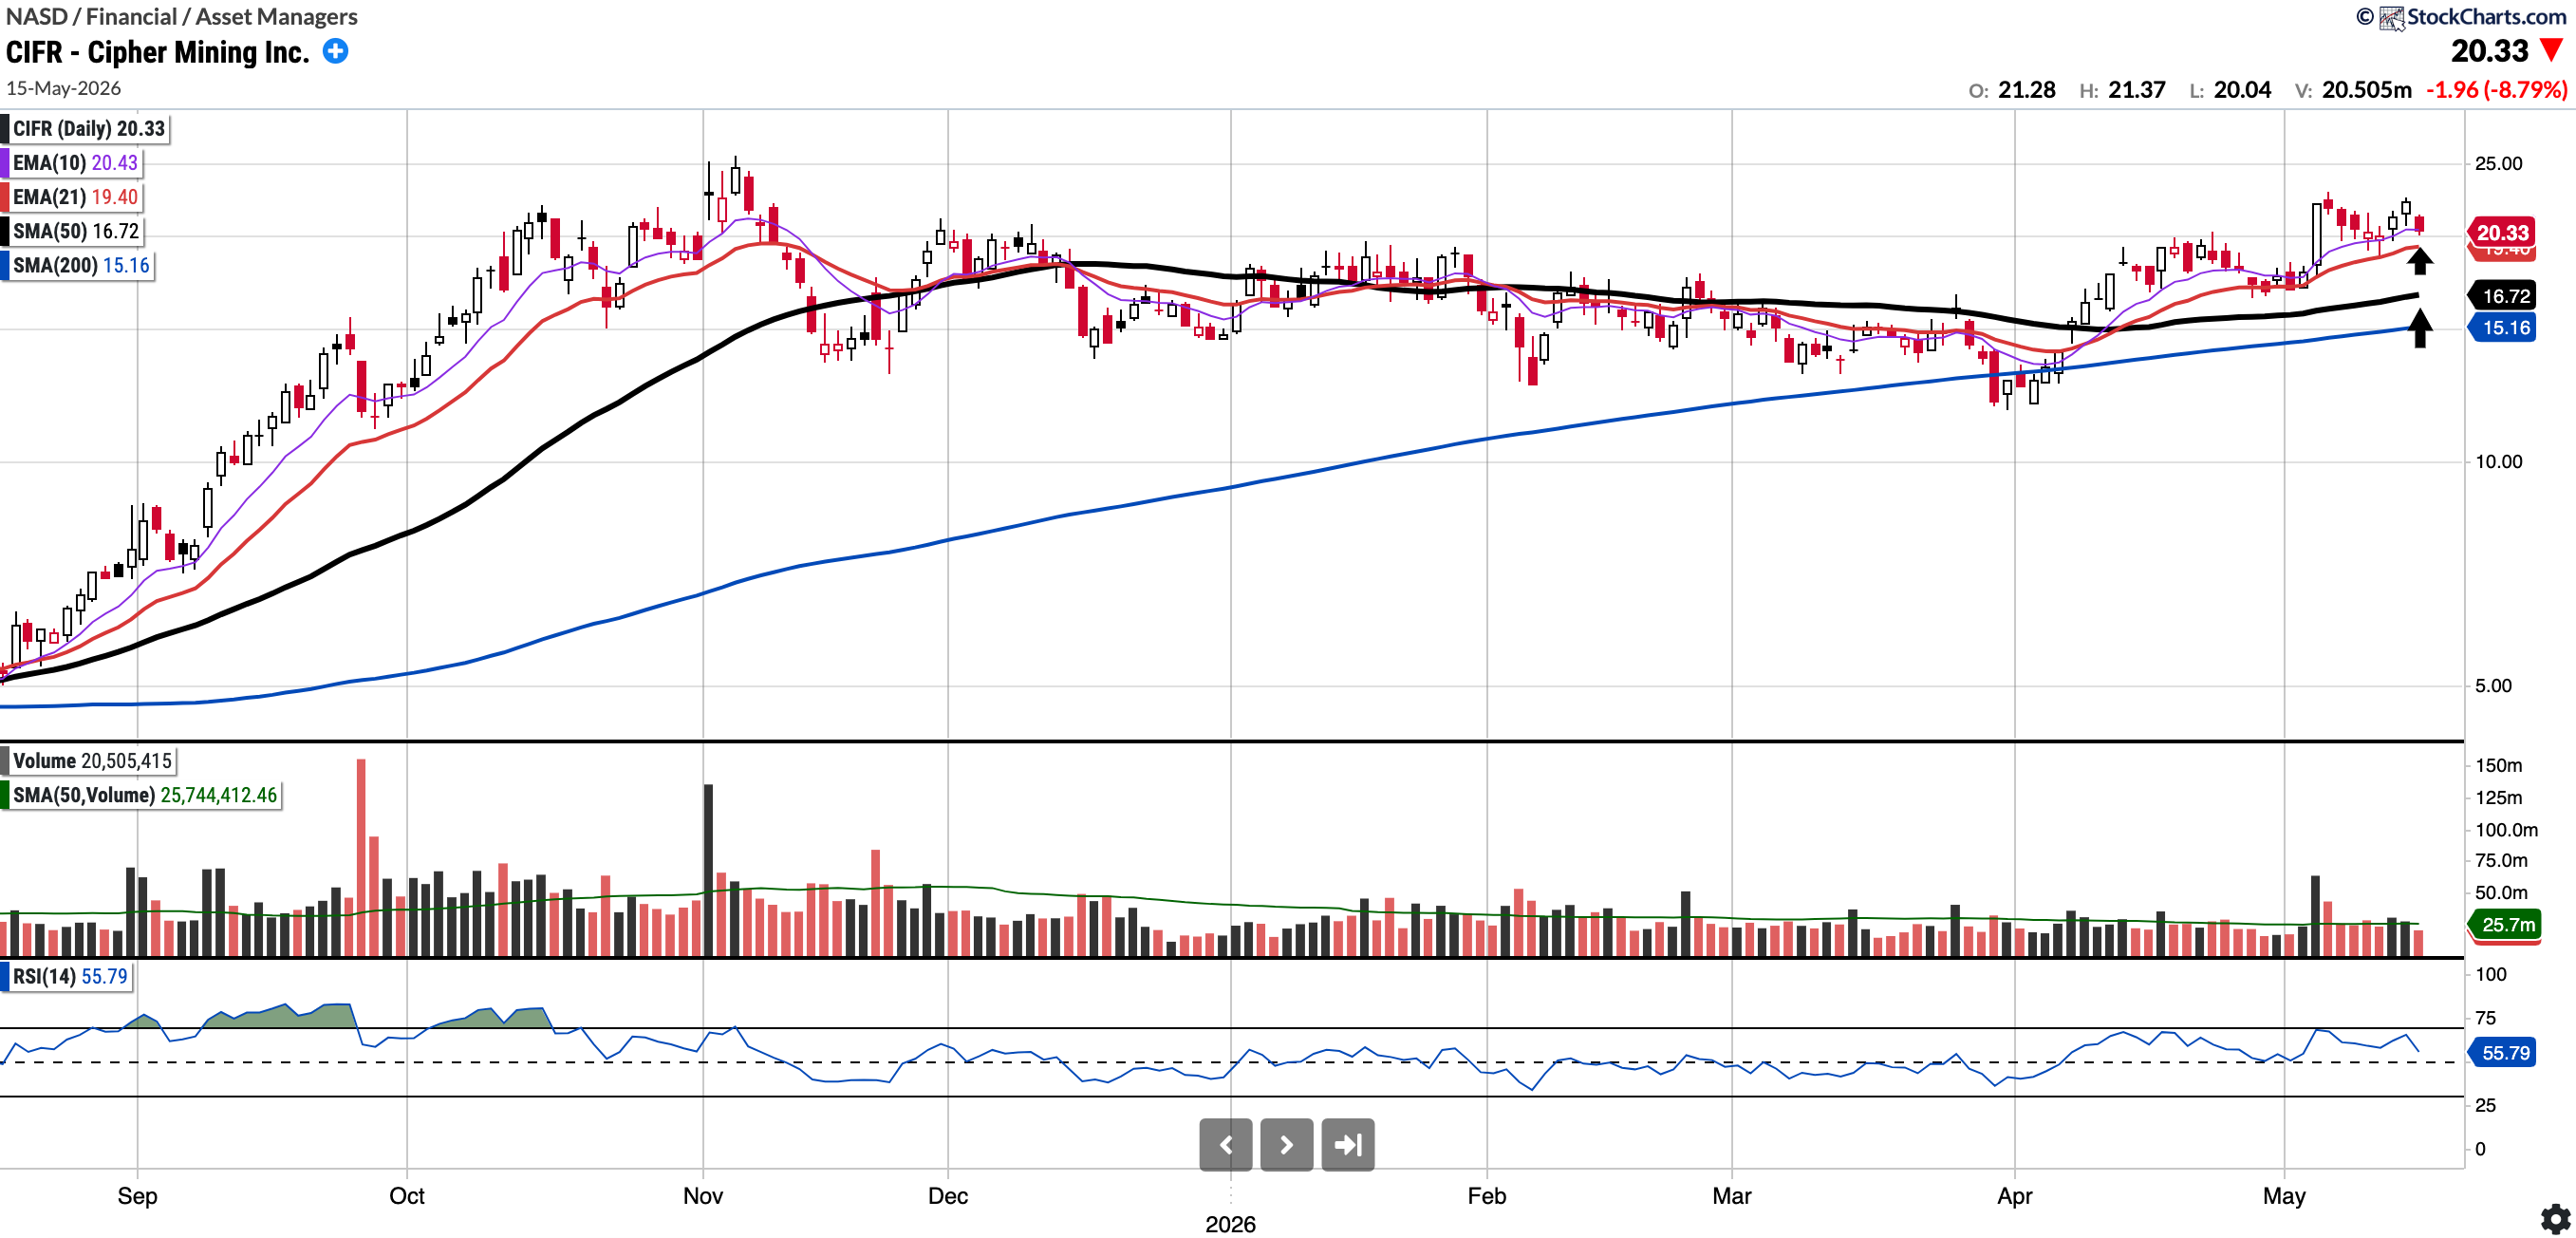
CIFR (Long)
Currently trades at $20.33, 21.57% above the 50SMA and 34.14% above the 200SMA
RSI 60.69
25.49% YTD
CIFR recently announced they had secured 4GW and a third hyperscaler client, which led the stock to close up over 20% last week. This week, the stock digested those gains and was mostly flat.
I added to my position at the 21-day EMA and will again be looking for low-volume pullbacks to either the 21-day EMA ($19) or, preferably, the 50-day SMA (~$16.7) to add more.
Important: I will feature several other trading ideas in the Watchlist Snapshot post, so keep a look out for that post tomorrow.
Last weeks post (link below) had countless positions responding to key levels and running sharply such as:
ASTS 74 to 86
NOK 12.4 to 15.4
CRWV 101 to 117
CIFR 18.5 to 22
CRCL 109 to 130

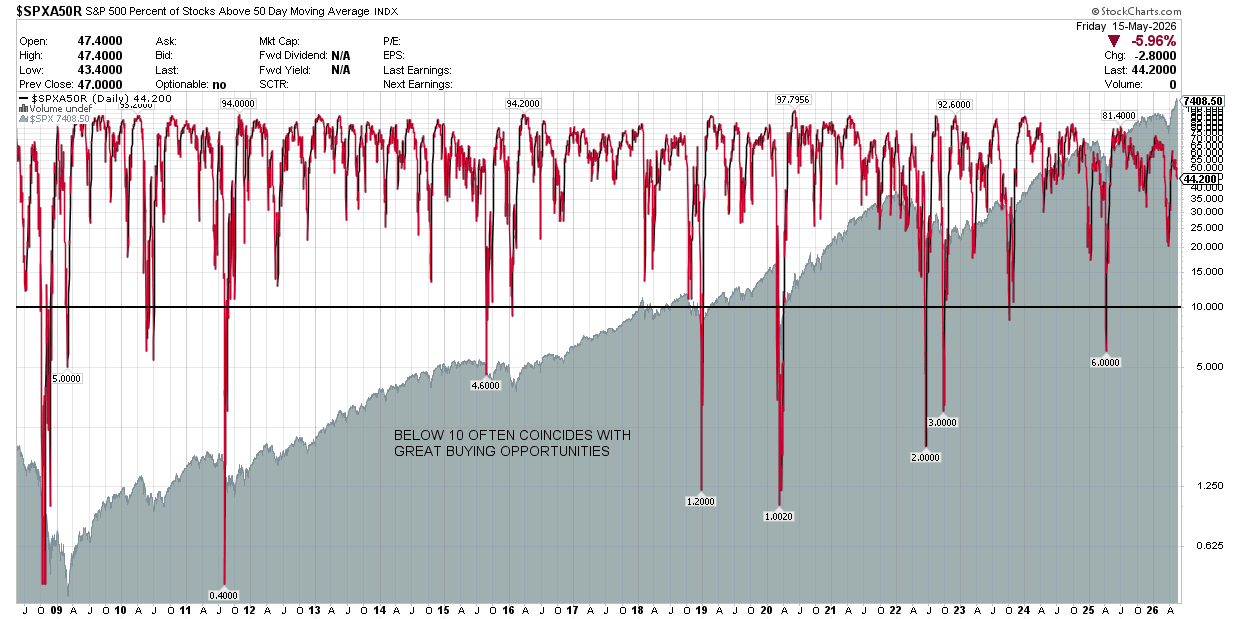
S&P 500 Percentage of Stocks Above the 50 Day Moving Average: Currently 44.2
You will note that whilst the SPX had an all time high weekly close, breadth is again deteriorating badly with only 44% of stocks above their 50 day moving average.
Notable portfolio changes in previous week (all updated live in subscriber channels):
No notable portfolio changes this week.
Important: To familiarise yourself with the notification process, please read the following post regarding the notification system.
I have also included the link to the Live Updates thread on the Substack chat below, which is where I post all moves related to my investment account. Turn the notifications on. Live Updates Thread
Note that these updates are posted simultaneously on Discord as well.
Current Positions in Size Order with Cost Basis (Investment Account)
