Hope you all are having a good weekend. Below, we will be previewing the upcoming week’s events and providing a portfolio update as usual.
Format for what is covered in this weekly preview:
A Look at the Indices
Key Upcoming Economic Events
Upcoming Earnings
Charts
Current Portfolio Holdings
Sizing | Cost Basis | Timeframe | Planned Moves
Closing Thoughts (Scroll to here for my Market Commentary)
I recommend checking out the most recent in-depth Monthly Portfolio and Performance Update below (the new post will also be published within the next day).
For all readers a reminder that a premium subscription includes:
Live Portfolio updates (All Buys and Sells) in Subscriber only Channels
Favourite set-up Ideas, Market Memos plus Full archive
Monthly in depth portfolio & performance updates
Annual Tier: Discord access for live trading account updates and AMAs.
Before getting into the post, here is last Sunday's commentary, which is worth a read if you missed it, especially given what transpired this week:
Managing risk is essential right now given the broader macro backdrop: yields at climbing at one of the fastest paces in recent memory (see chart), bond market jitters, elevated crude and energy costs, persistent geopolitical tensions, supply chain friction, and approaching midterms.
The 10-year yield is now above 5.24%, near its highest level in over two decades, and Brent crude has been hovering around $100.
With this backdrop in mind, a few recent portfolio adjustments:
Trimmed some high-CapEx +/-debt-heavy names: Exited CIFR at $19, CRWV into strength at $116, $110, $101, and $92, and continued trading around a core position in names like CRDO (exited on 2nd October)
Rotated into equal-weight exposure: In response to narrow market breadth whereby only 20% of stocks were holding above their 50-day moving averages, I parked some cash in RSP around $209.
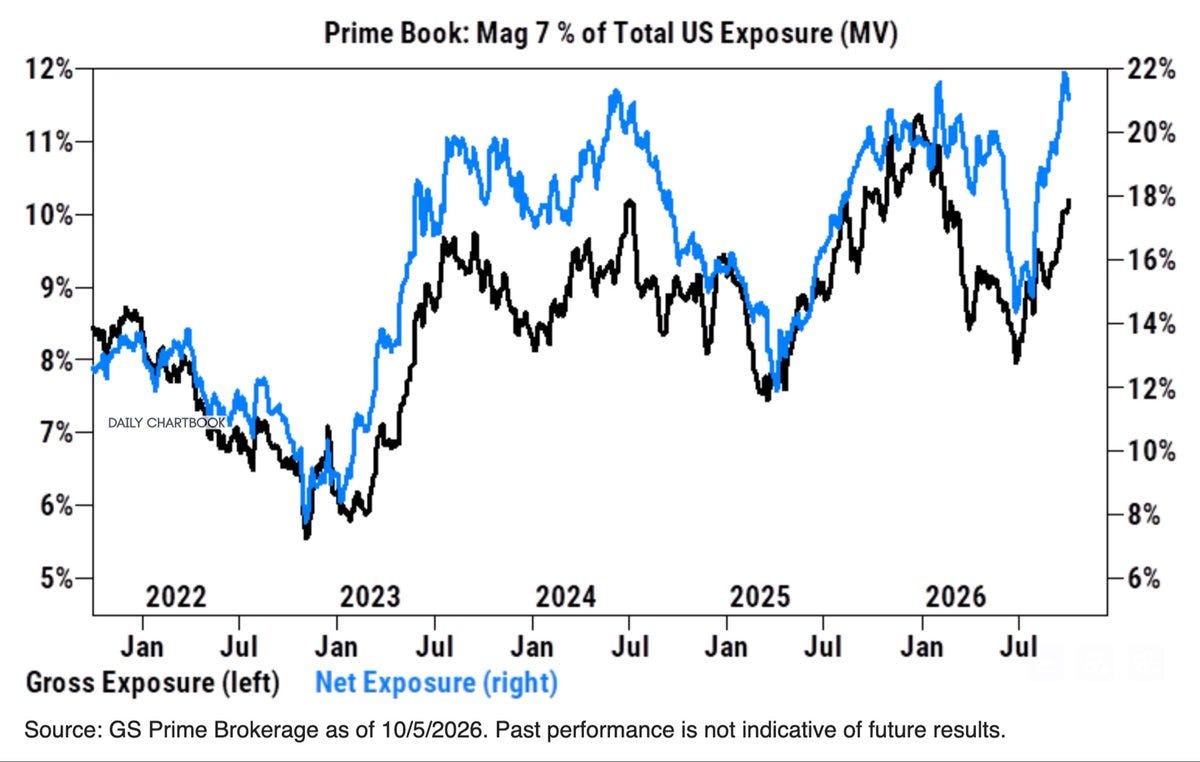
Trimmed megacaps: Megacaps have held up well thanks to their balance sheets, but crowded positioning is becoming a notable risk (see attached chart). I’ve taken some profits off the table to right-size exposure.
Building a cash cushion: Holding cash and ultra-short equivalents makes sense here, whether via SGOV or 2-year Treasuries. I plan to maintain a 5–10% cash allocation to stay nimble and opportunistic.
The Fed isn’t offering much relief either. The minutes from the September meeting, released on Wednesday, showed the committee unanimously backed the 25bp hike to 3.75%–4.00%, and that most officials see another hike as likely by year-end. That makes Wednesday’s CPI print the key event next week, as it is the last major inflation reading before the October 27–28 FOMC meeting. Q3 earnings season also kicks off on Tuesday, with the big banks reporting”
Be sure to check out my attached article, which may be helpful in navigating this environment:
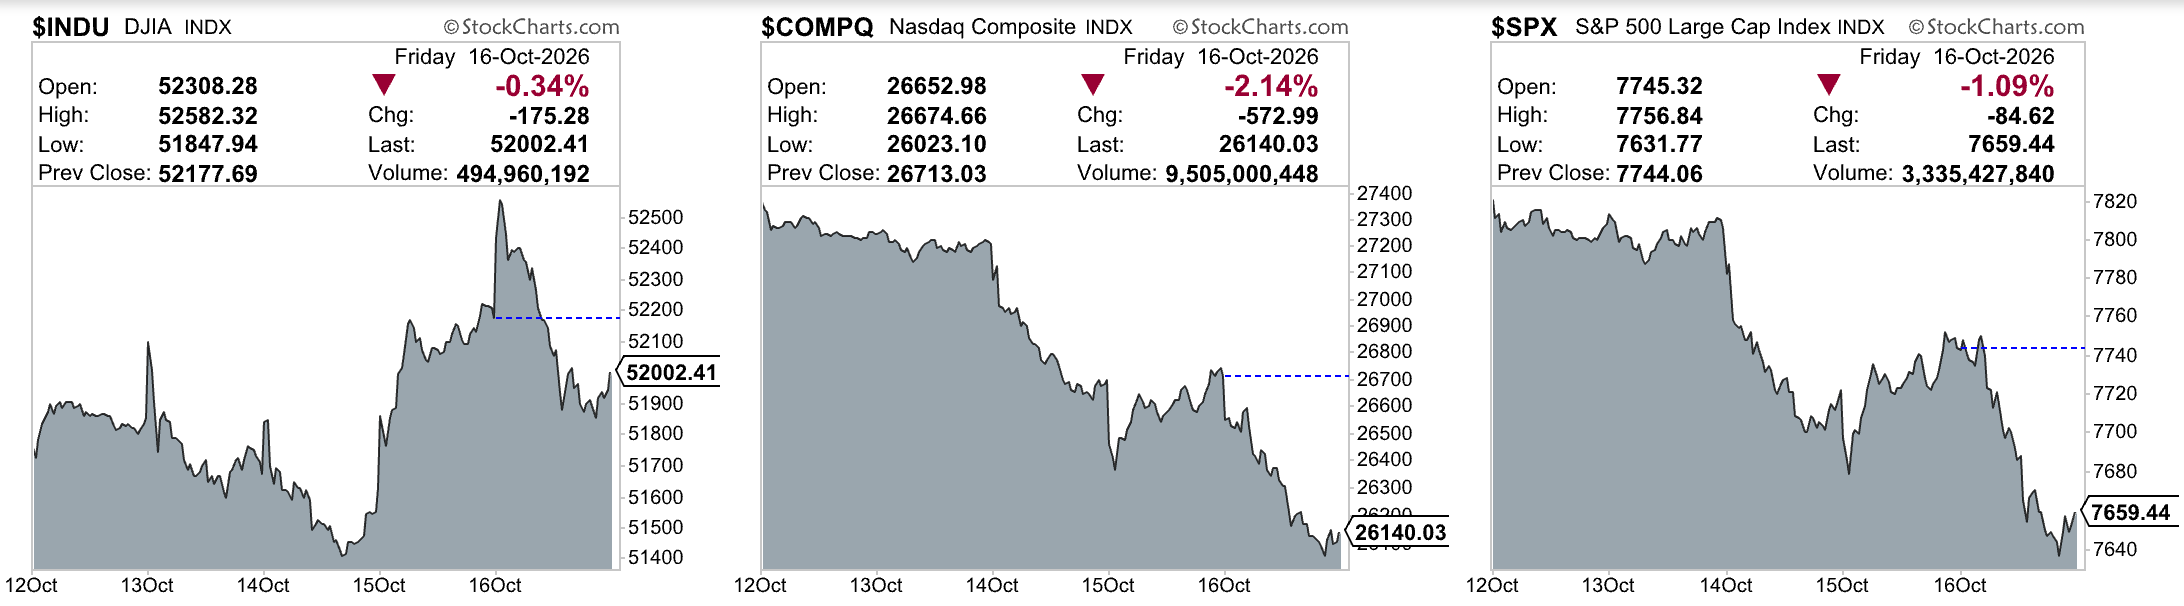
Dow Jones Industrial Average advanced +0.67% in the last week
S&P 500 declined -1.95% in the last week
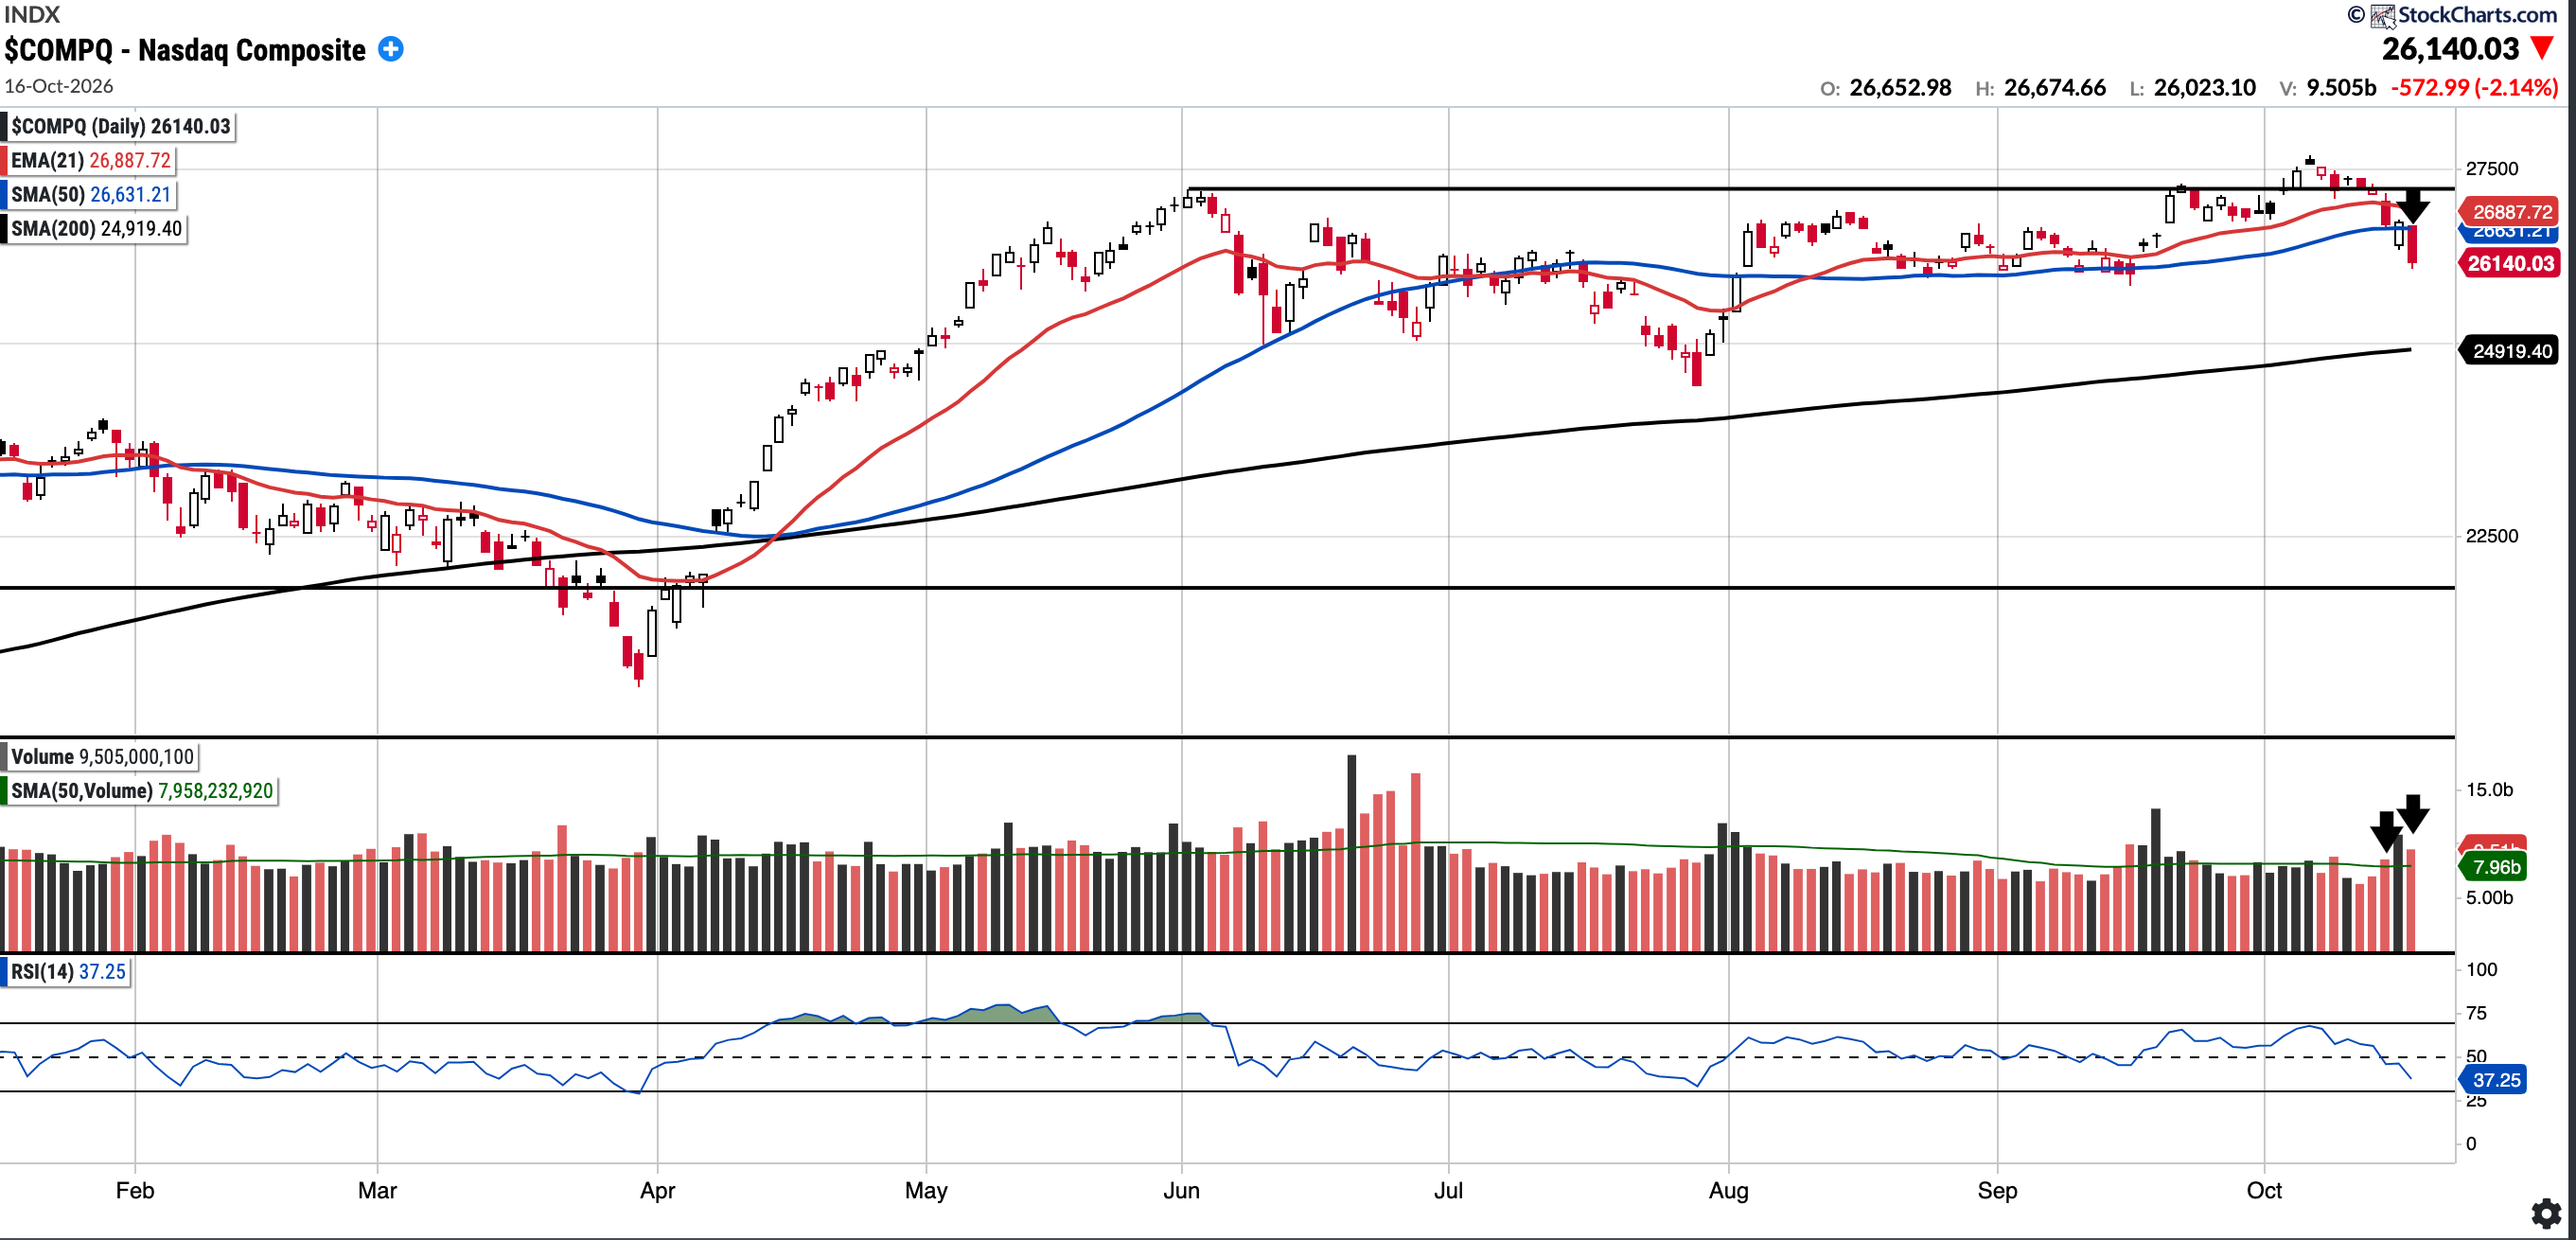
Nasdaq Composite declined -4.48% in the last week
IWM declined -3.05% in the last week
Key upcoming economic events
Monday, October 19
NAHB Housing Market Index (October)
13-Week and 26-Week Treasury bill auctions
Tuesday, October 20
Housing Starts and Building Permits (September)
Pending Home Sales Index (September)
BLS State Employment and Unemployment (September)
6-Week Treasury bill auction
Wednesday, October 21
MBA Mortgage Applications
EIA Weekly Petroleum Status Report
BLS Usual Weekly Earnings (Q3)
20-Year Treasury Bond auction (~$13B reopening)
17-Week Treasury bill auction
Thursday, October 22
Initial and Continuing Jobless Claims
Conference Board Leading Economic Index (September)
EIA Natural Gas Storage
Kansas City Fed Manufacturing Survey (October)
5-Year TIPS auction
4-Week and 8-Week Treasury bill auctions
Fed H.4.1 balance sheet release
Friday, October 23
S&P Global Flash US PMIs: Manufacturing, Services and Composite (October)
University of Michigan Consumer Sentiment, final (October), including inflation expectations
Upcoming Earnings
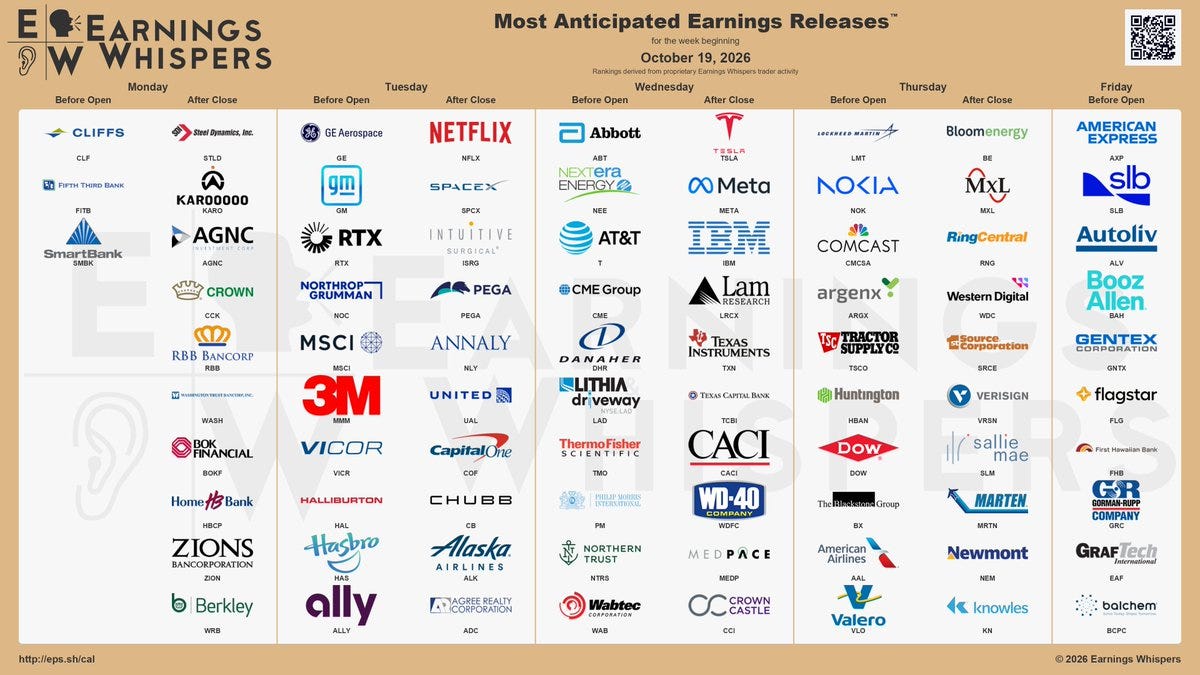
Below is the infographic by Earnings Whispers highlighting the schedule for this week:
Charts
SPX
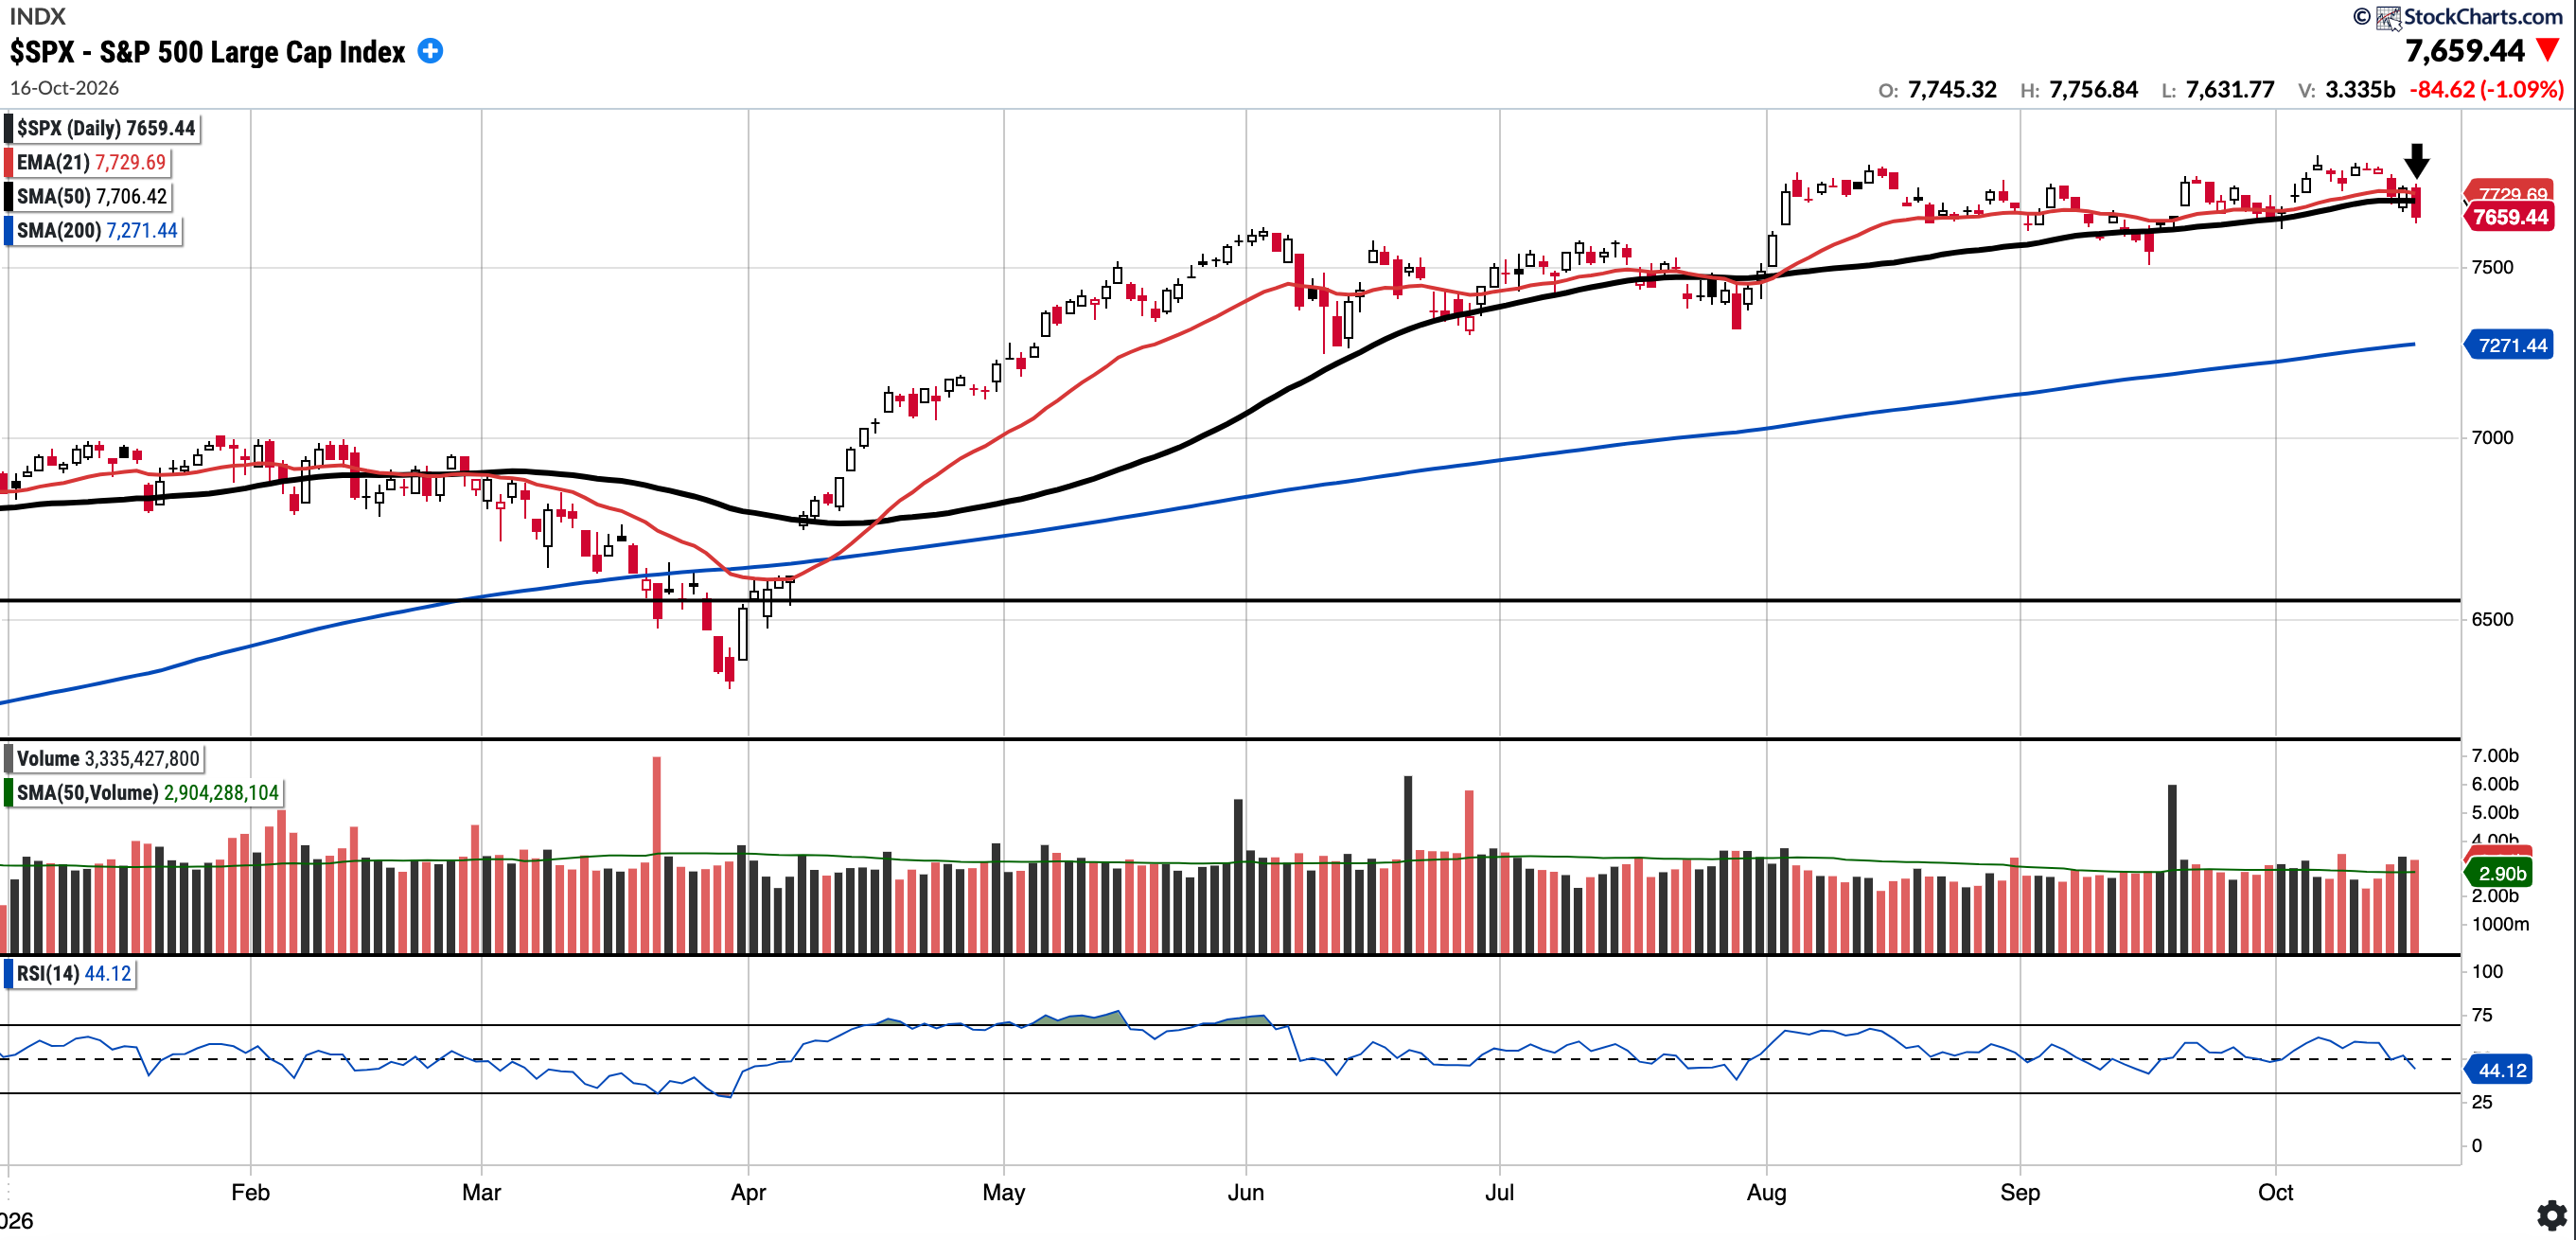
Currently trades at $7,659.44, 0.61% below the 50SMA and 5.34% above the 200SMA.
RSI 44.12
11.68% YTD
Distribution days in the last week: 2
The S&P 500 dropped 1.95% this week to close below its 50-day SMA, accompanied by two distribution days. Given Friday's bearish engulfing candle, caution remains advised while price action holds beneath the 50-day line.
COMPQ
Currently trades at $26,140.03, 1.84% below the 50SMA and 4.90% above the 200SMA.
RSI 37.25
12.50% YTD
Distribution days in the last week: 2
The Nasdaq Composite fell 4.48% this week, closing below both the 21- and 50-day moving averages. There were two distribution days on above-average volume (see arrows at the bottom of the image). Caution is warranted. Bulls will want to see the 50-day reclaimed sooner rather than later, whereas to the downside, a retest of the 200-day is not out of the question on further weakness.
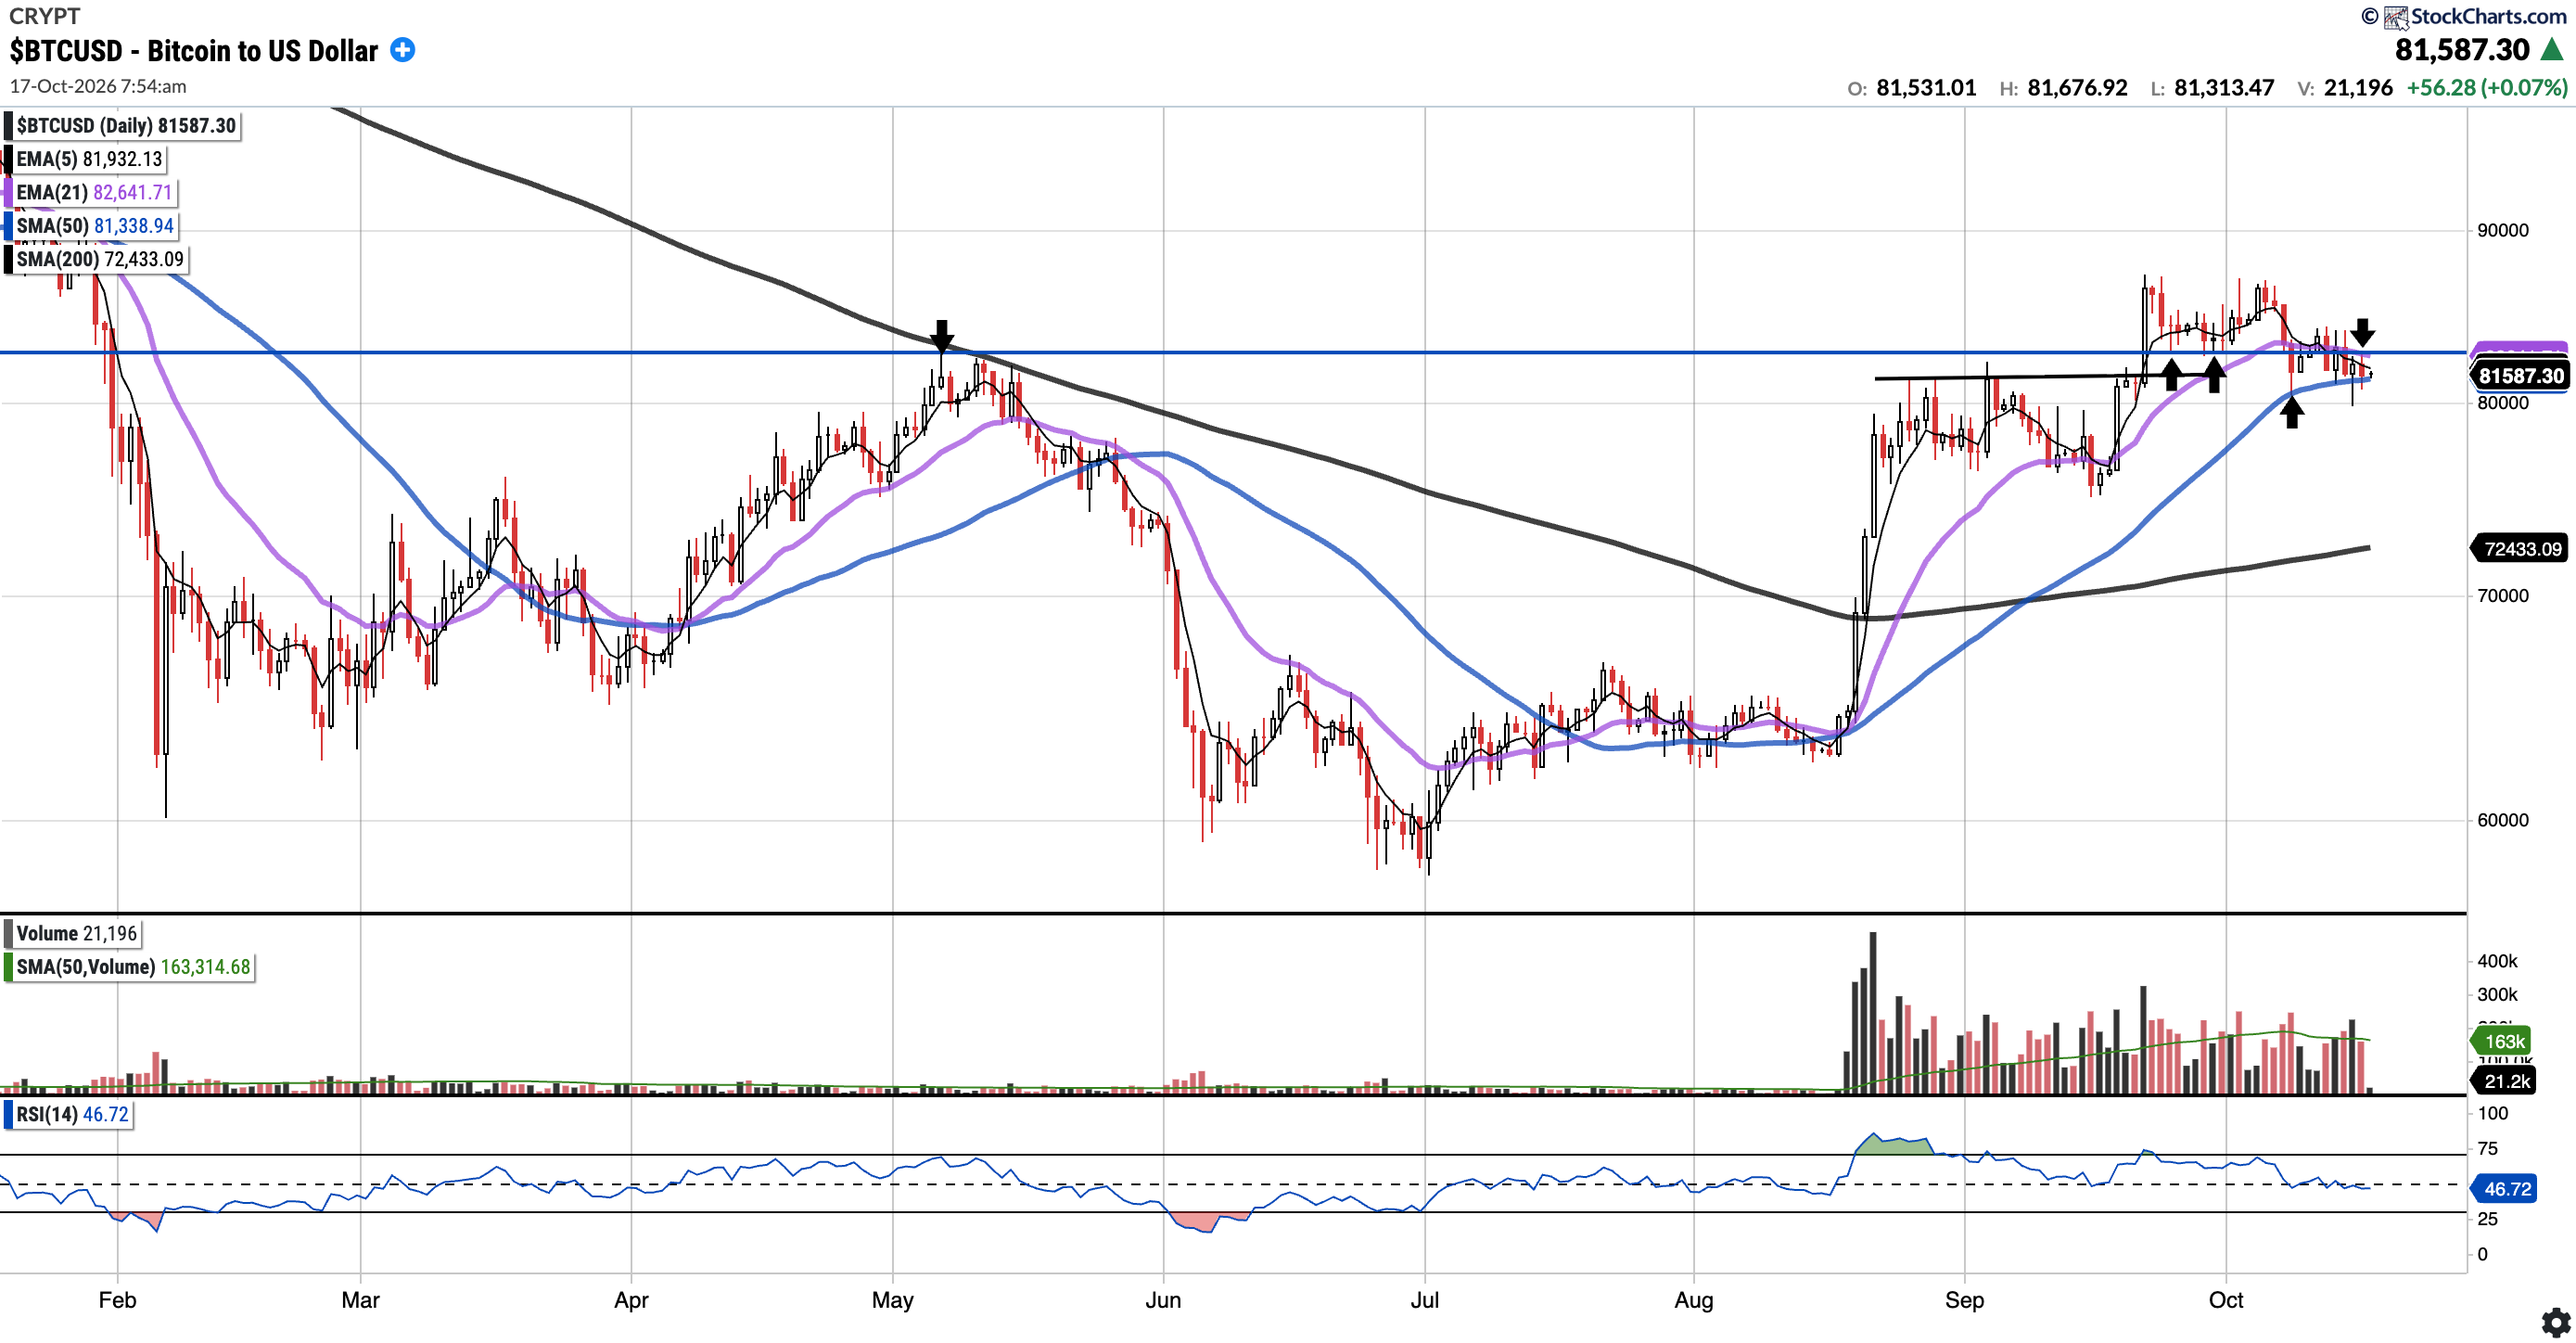
BTC (currently Long)
Currently trades at $81,625.60, 0.37% above the 50SMA and 12.70% above the 200SMA.
RSI 46.72
-6.68% YTD
As of Saturday October 17 at 7:54 am, BTC fell back below the $82-83K level (horizontal blue line, the May high) and was rejected there again (see top arrow). Price has drifted back down to the 50SMA (~$81.3K) which has acted as support this week. Bulls will want to see the 50SMA to hold and $83K reclaimed. A close below the 50SMA would put the $80K support level into focus, with the 200SMA further below.
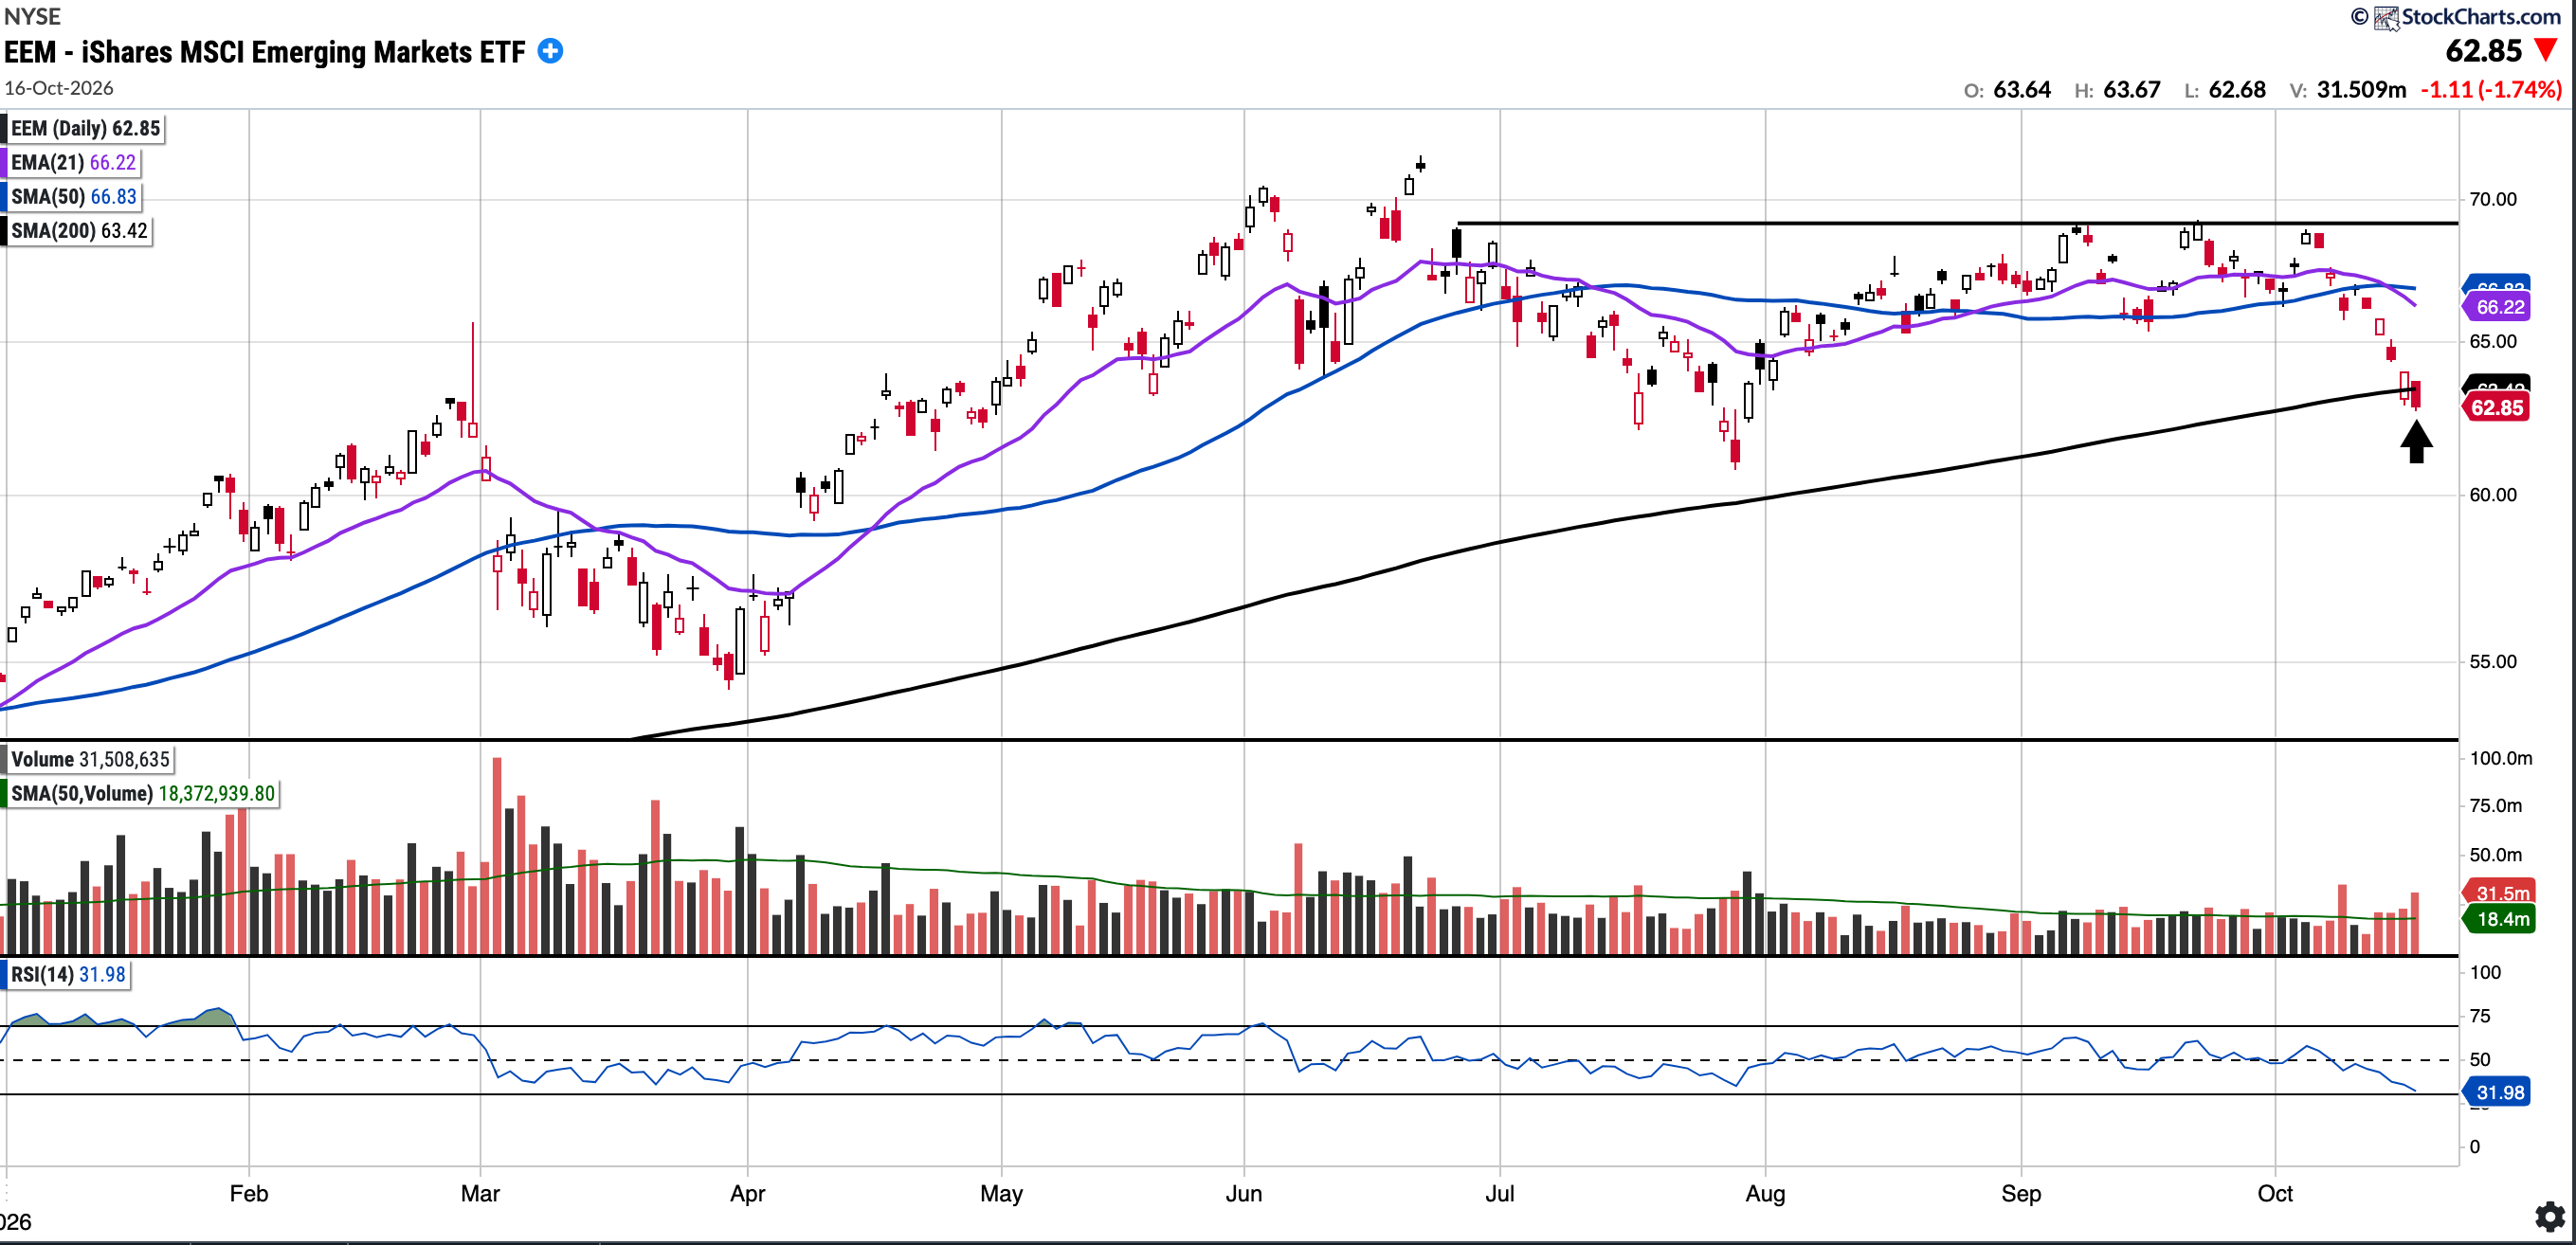
EEM
Currently trades at $62.85, 5.96% below the 50SMA and 0.90% below the 200SMA.
RSI 31.98
12.33% YTD
EEM sold off on above-average volume this week and closed below its 200-day moving average for the first time since April 2025, a notable technical breakdown. Bulls will want to see the 200-day reclaimed sooner rather than later.
Given EEM's heavy weighting in TSMC, SK Hynix, and Samsung, a rebound in those will be important for the ETF to mount a recovery.
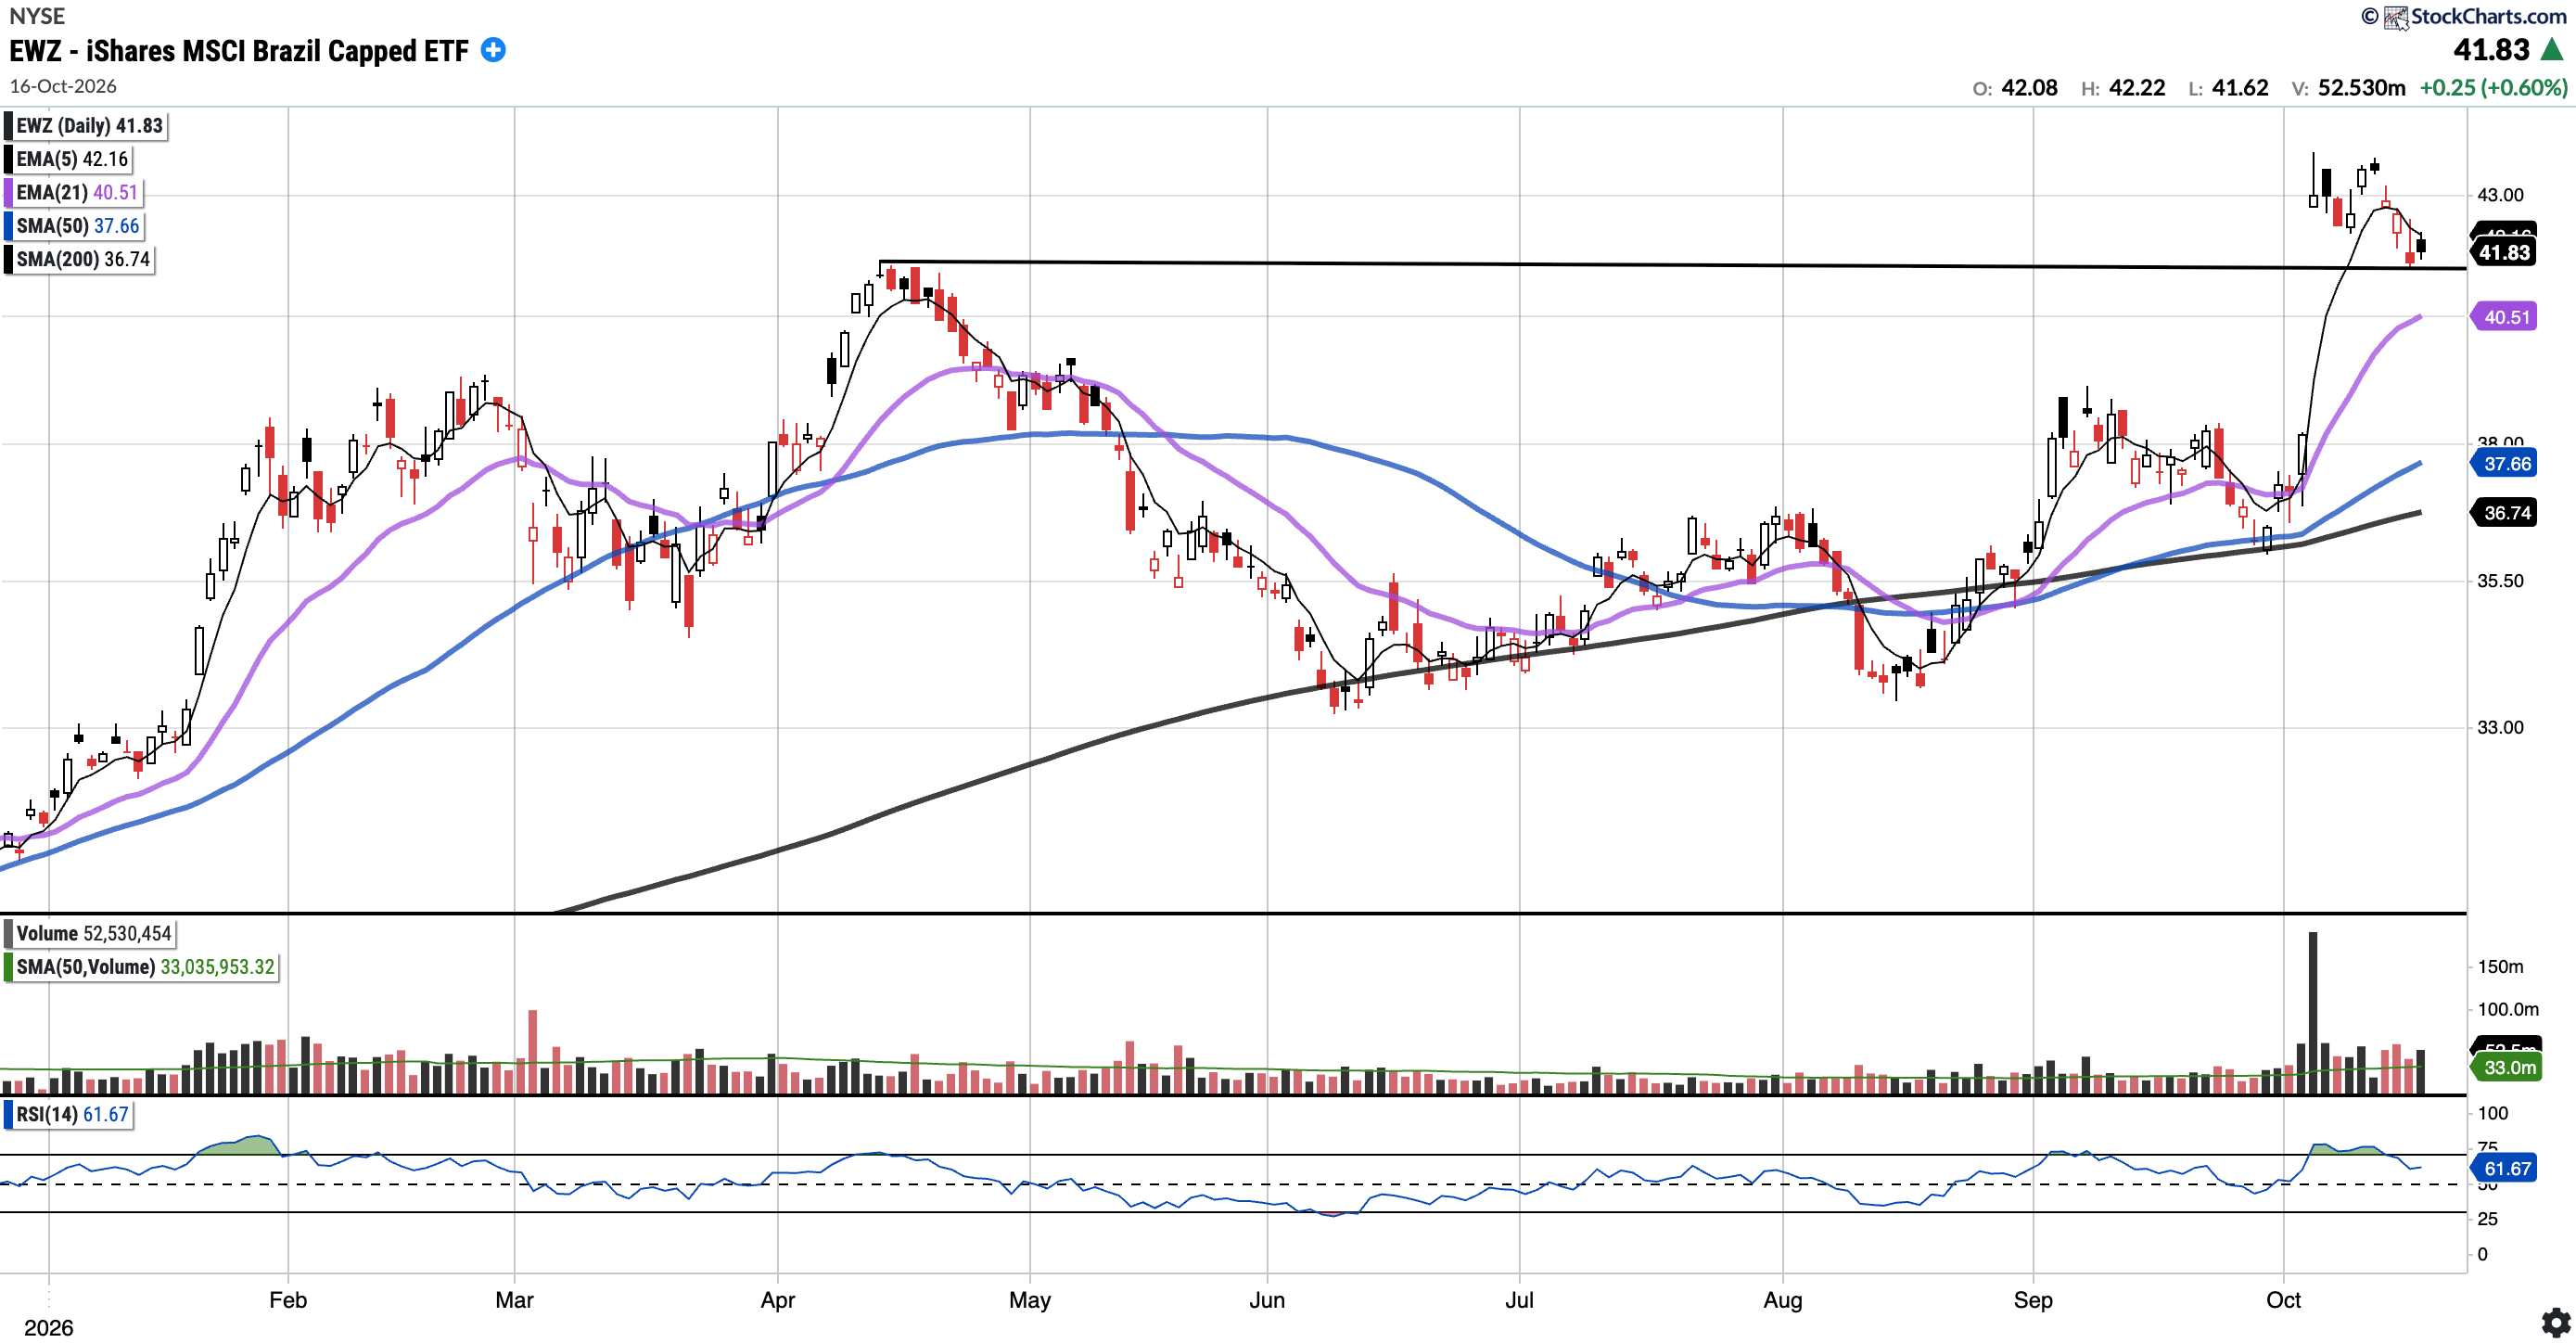
EWZ (Currently Long via IBZL)
Currently trades at $41.83, 11.06% above the 50SMA and 13.85% above the 200SMA.
RSI 61.67
31.14% YTD
EWZ spent the week consolidating after its post-election gap, retesting the April highs (see horizontal line). The level has held so far on Thursday and Friday. Price remains well above its key moving averages.
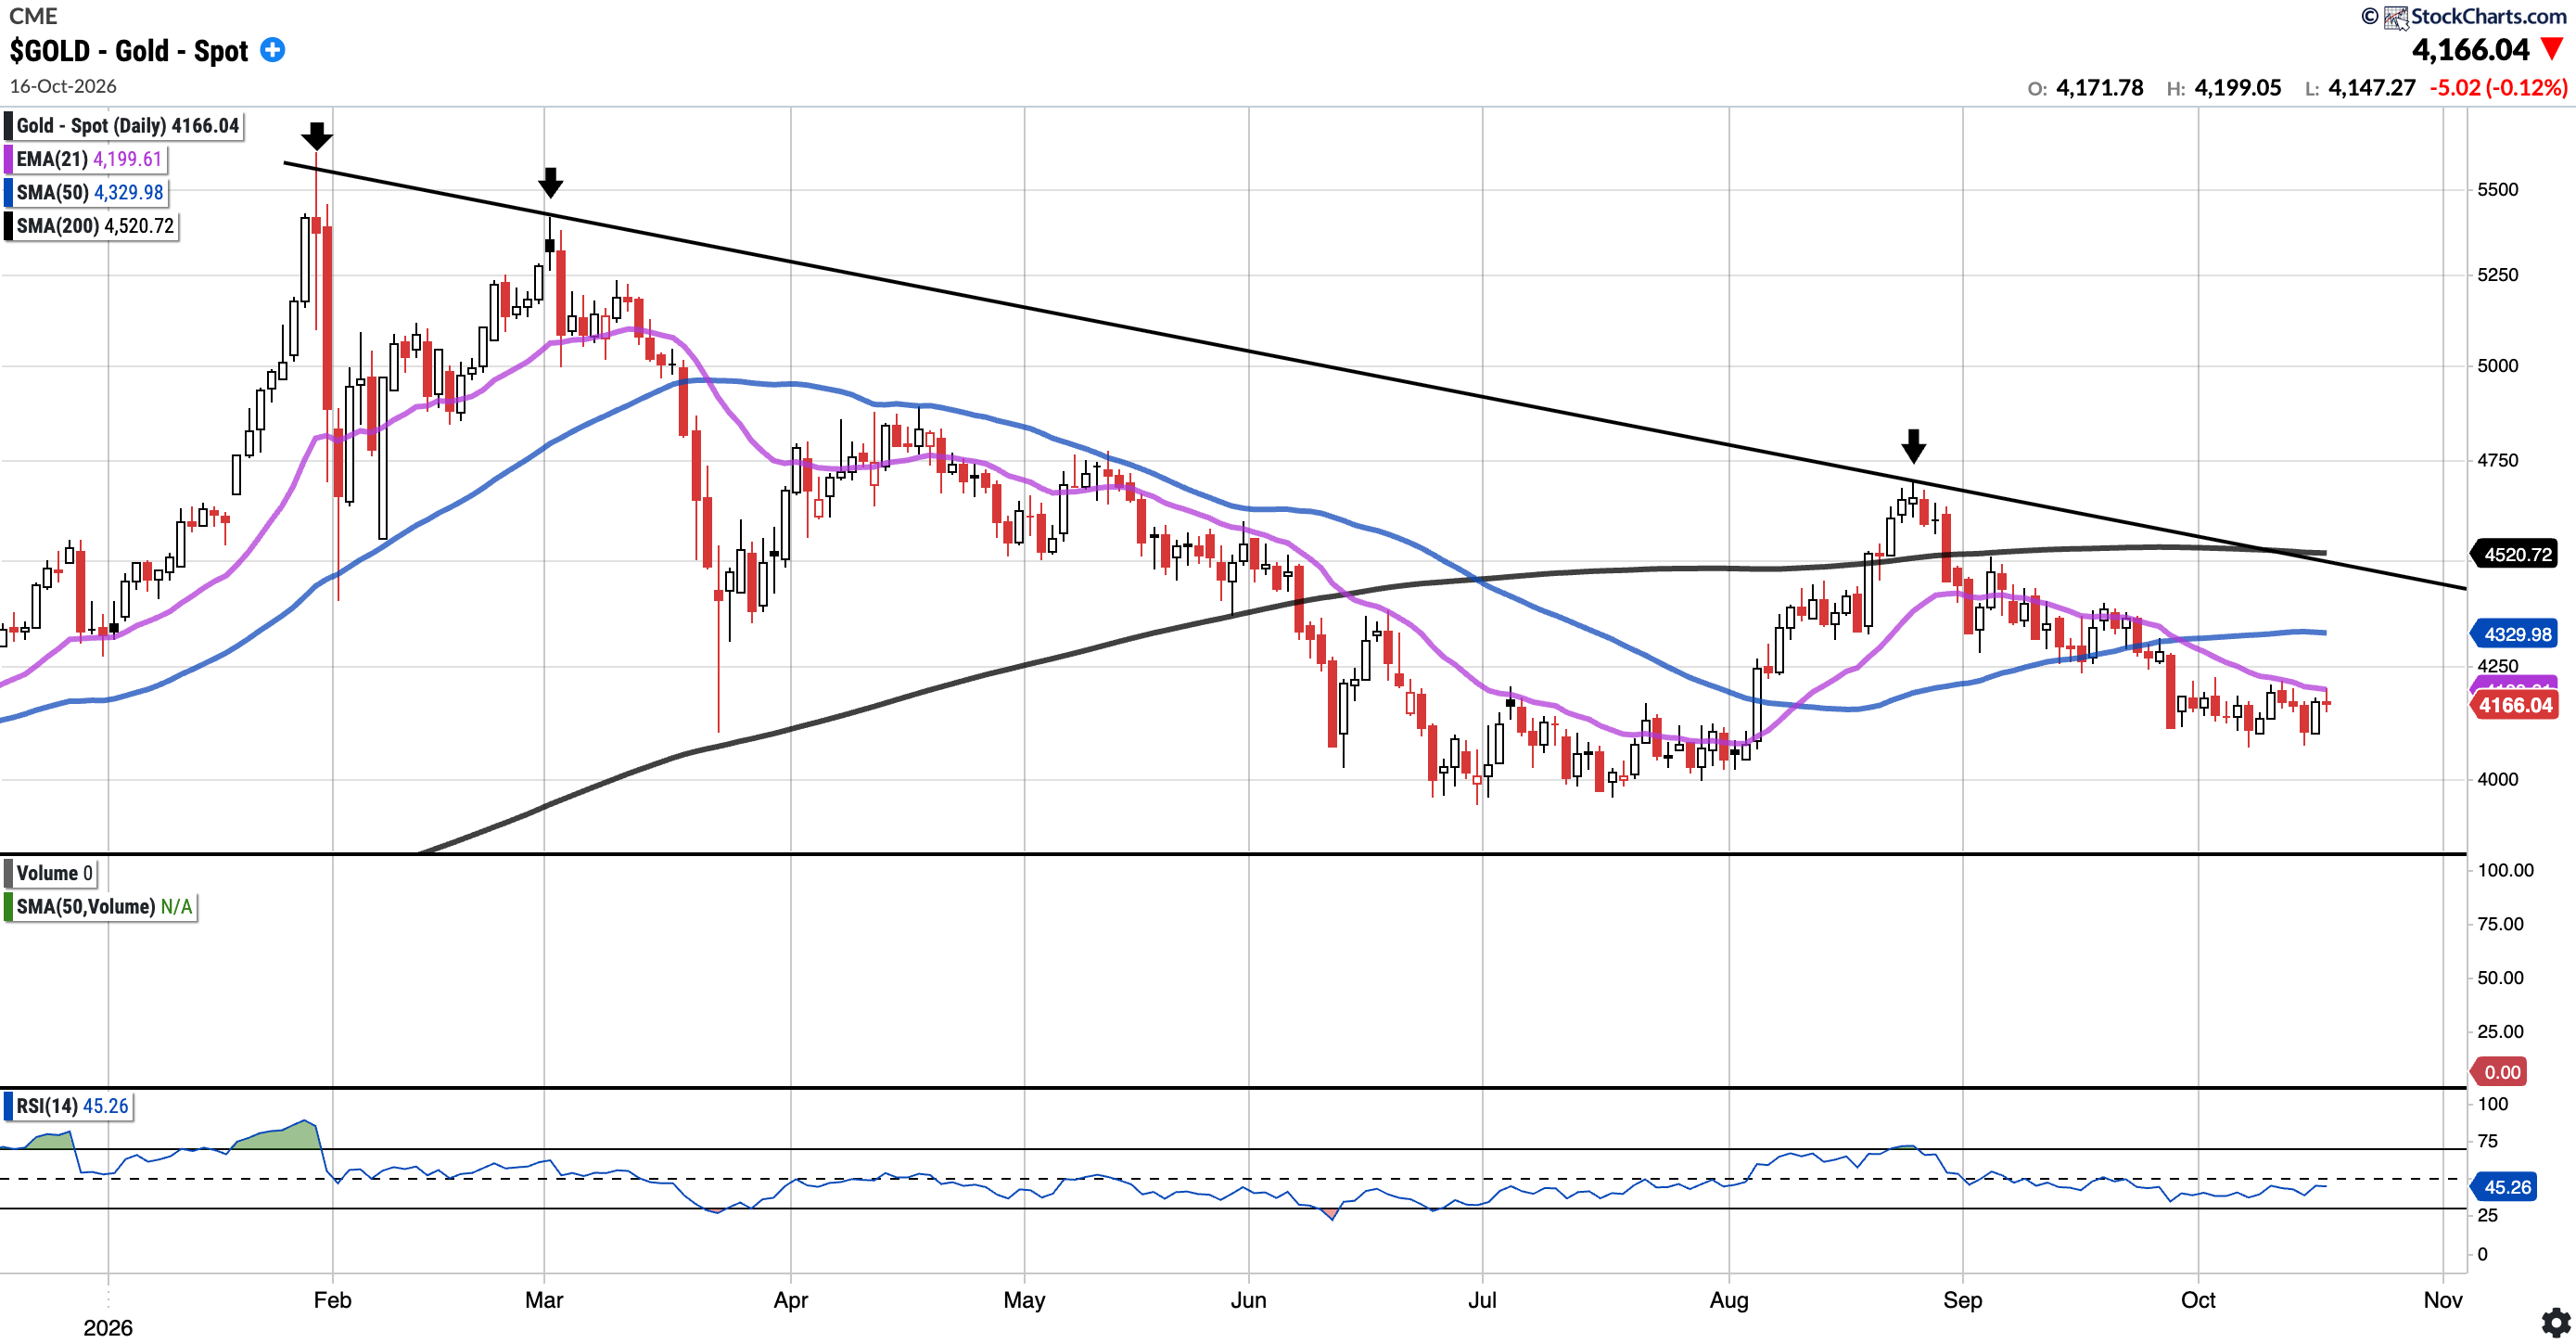
GOLD (Long Physical)
Currently trades at $4,166.04, 3.79% below the 50SMA and 7.85% below the 200SMA.
RSI 45.26
-3.63% YTD
Gold continued to trade below its 21EMA for another week, rejecting it twice. Price remains below the 50SMA, with the 200SMA above it, converging with the January descending trendline. Bulls need to reclaim the 21EMA and 50SMA first, with the $4,100–$4,150 support level to defend.
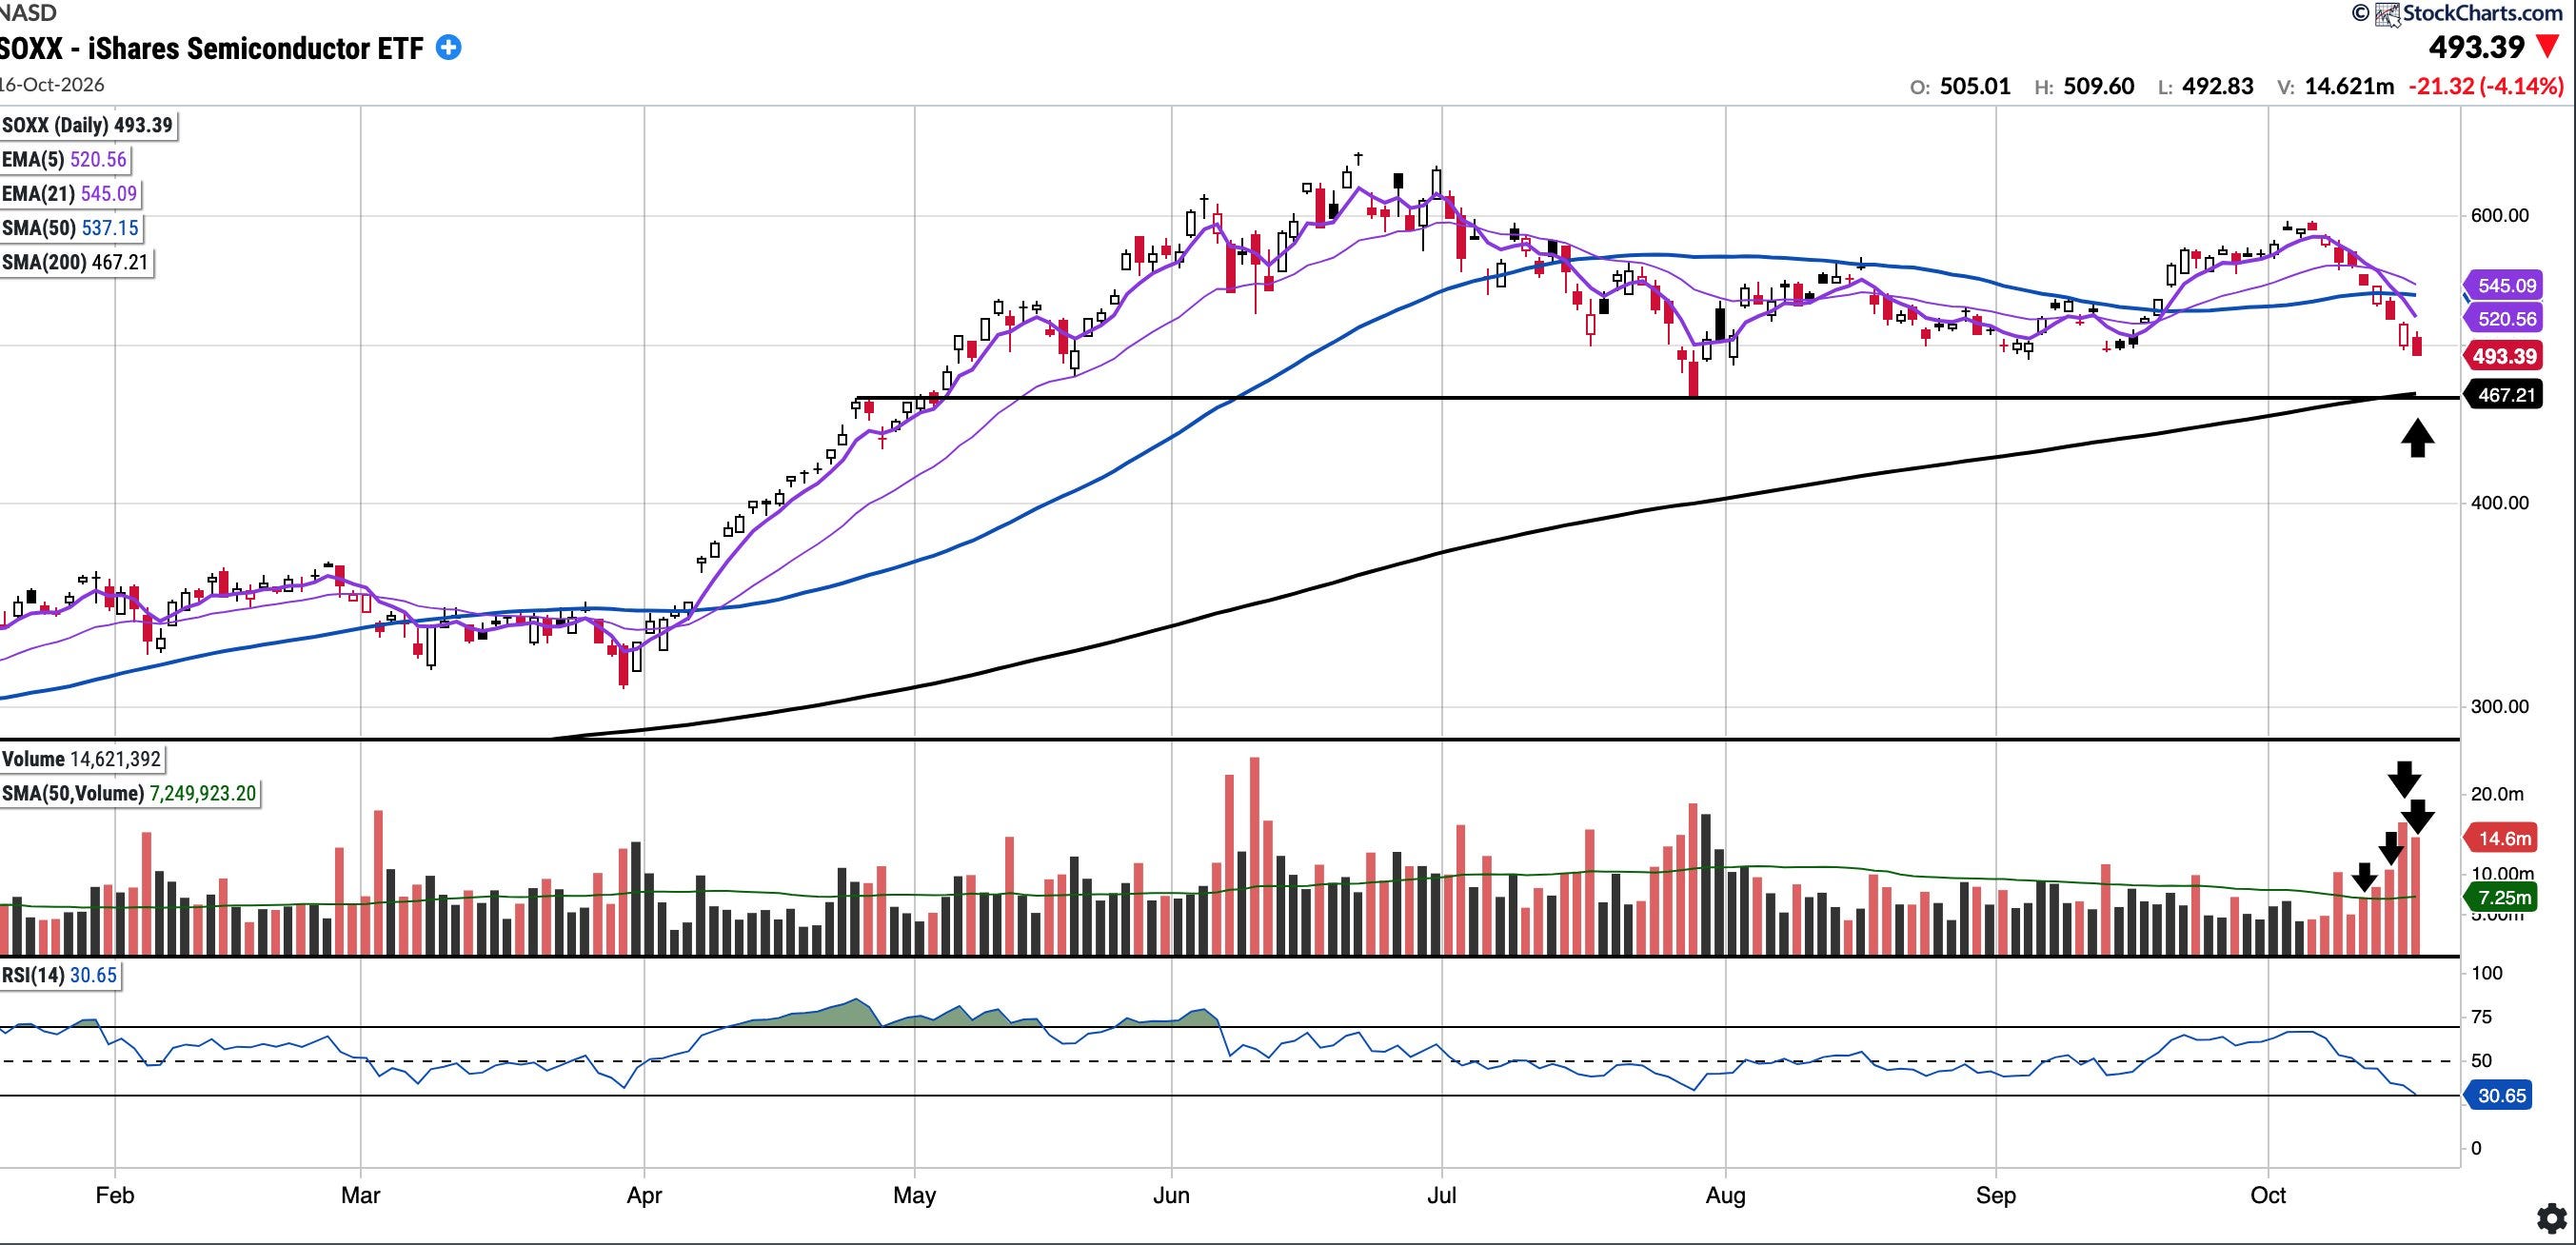
SOXX
Currently trades at $493.39, 8.15% below the 50SMA and 5.60% above the 200SMA.
RSI 30.65
57.56% YTD
The SOXX ETF sold off 12% over the past week on cascading volume. Notably, there were four distribution days, raising clear flags for the sector. To the downside, a test of the 200-day moving average looks probable, which also coincides with the July low (see chart).
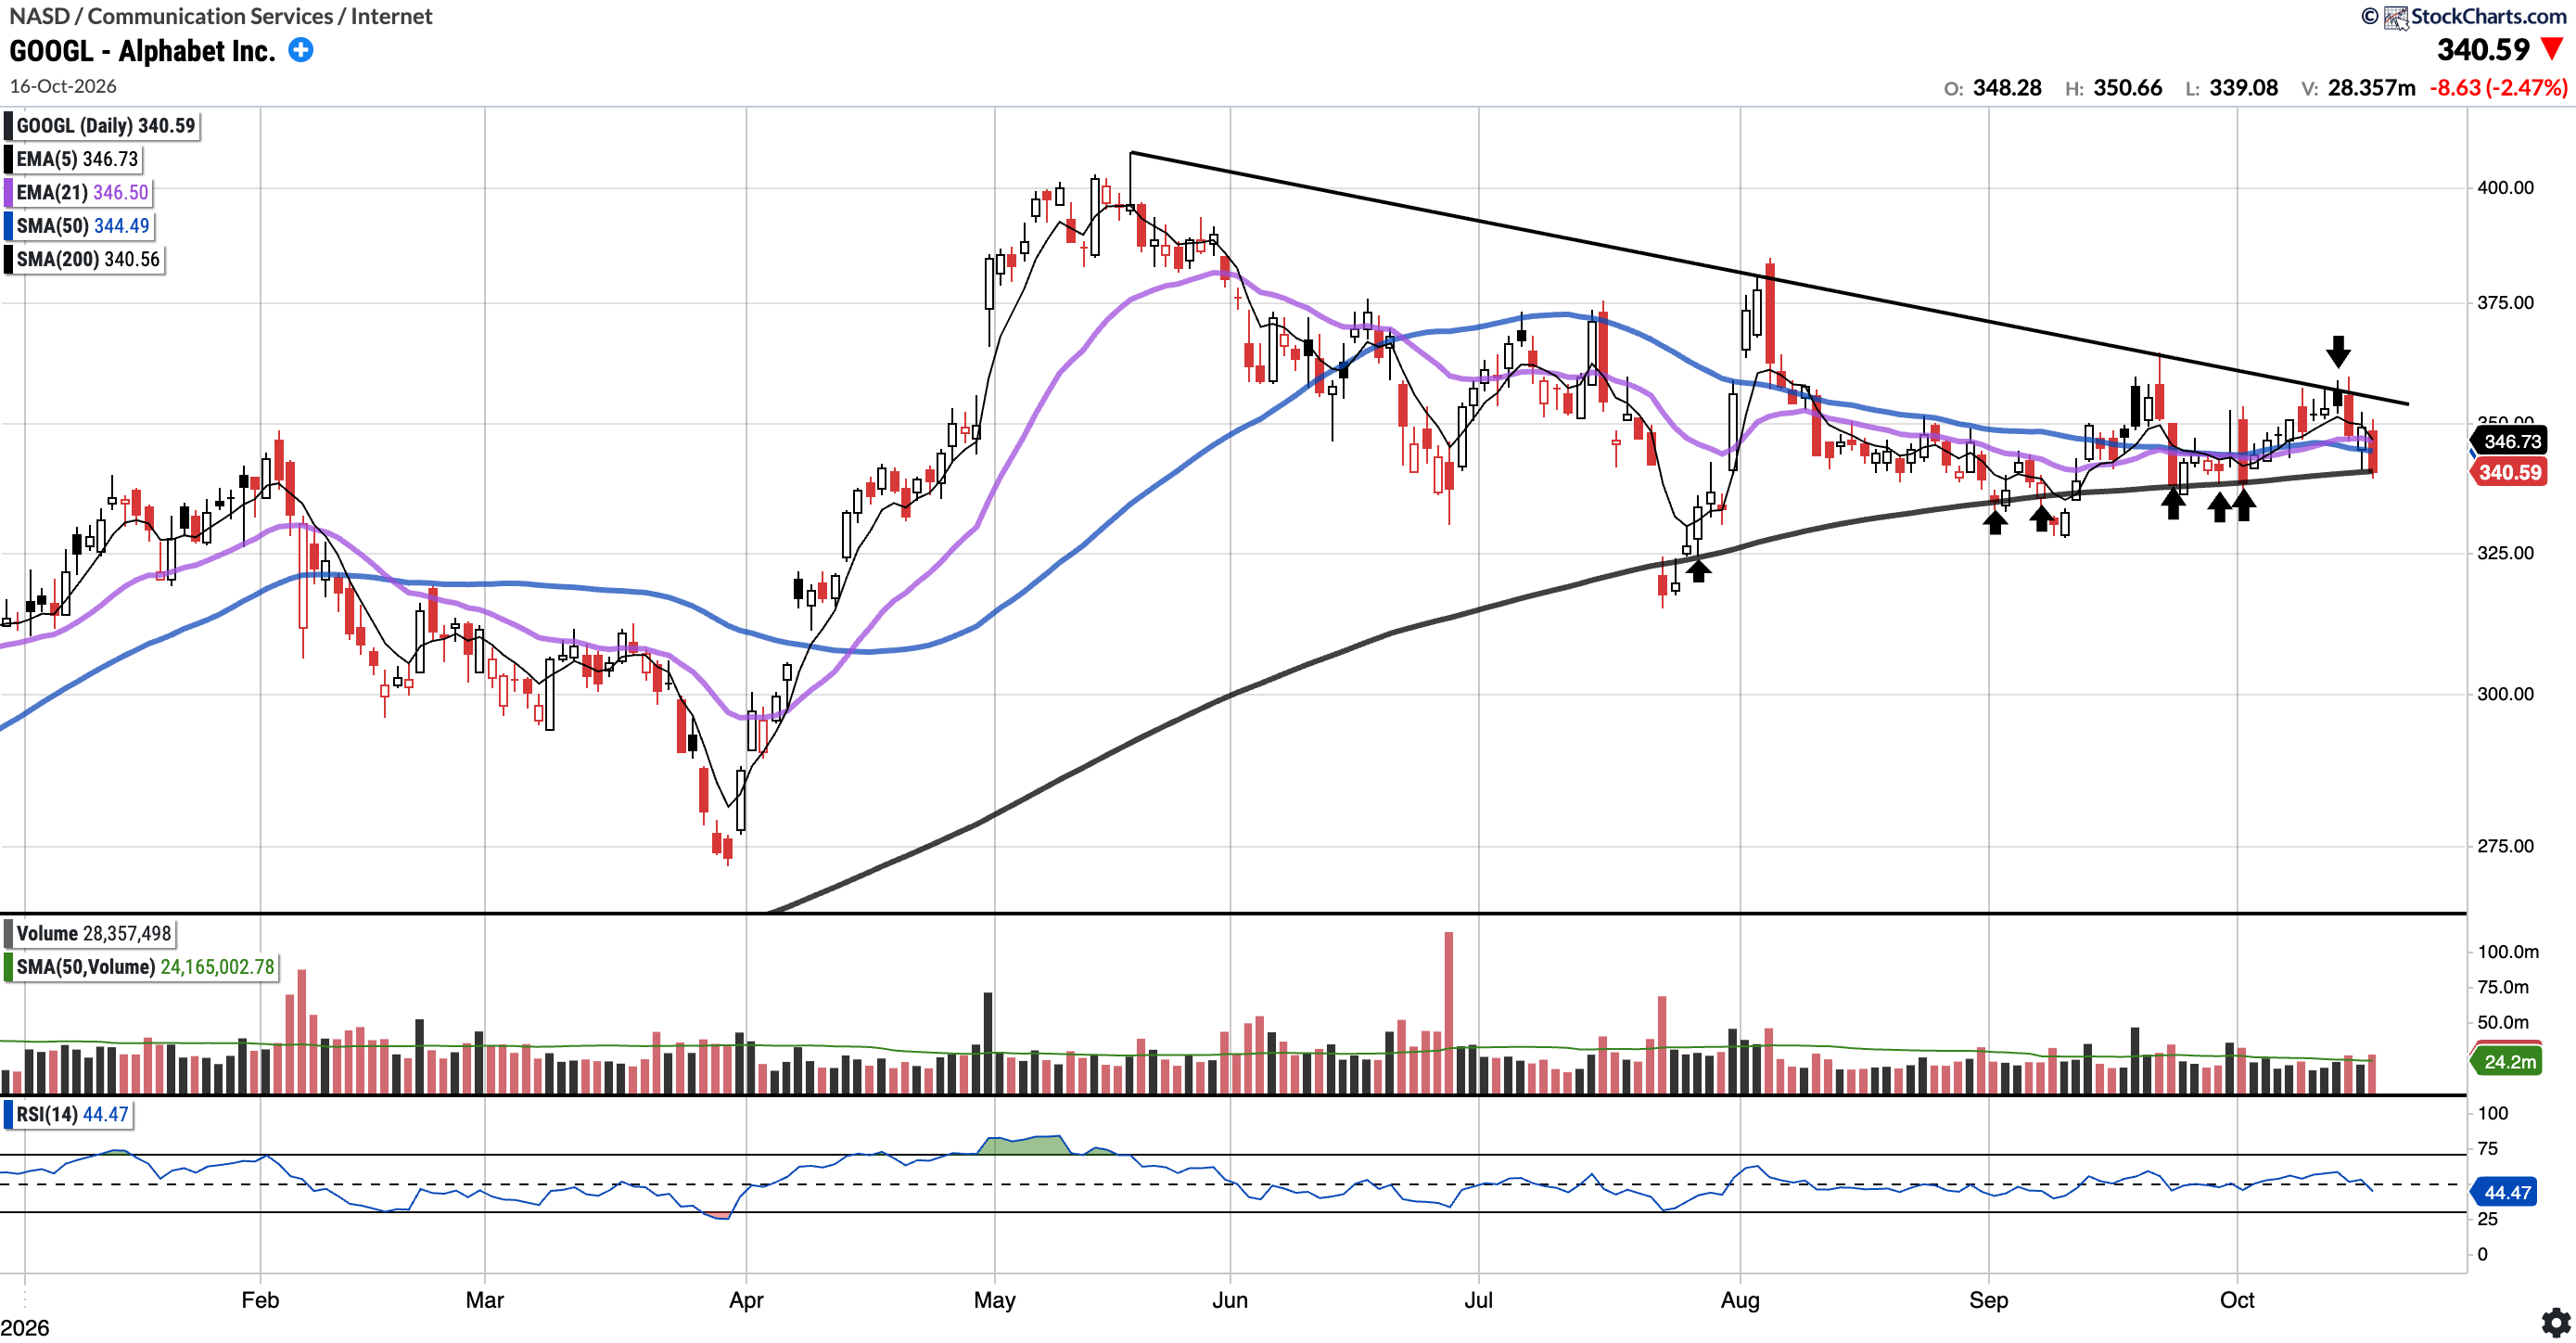
GOOGL (Currently Long)
Currently trades at $340.59, 1.13% below the 50SMA and 0.01% above the 200SMA.
RSI 44.47
8.28% YTD
GOOGL was rejected at the overhead trendline again. The stock closed below both the 21- and 50-day moving averages, landing right on the 200-day. Bulls will want to see that level hold, followed by a clean break above the trendline.
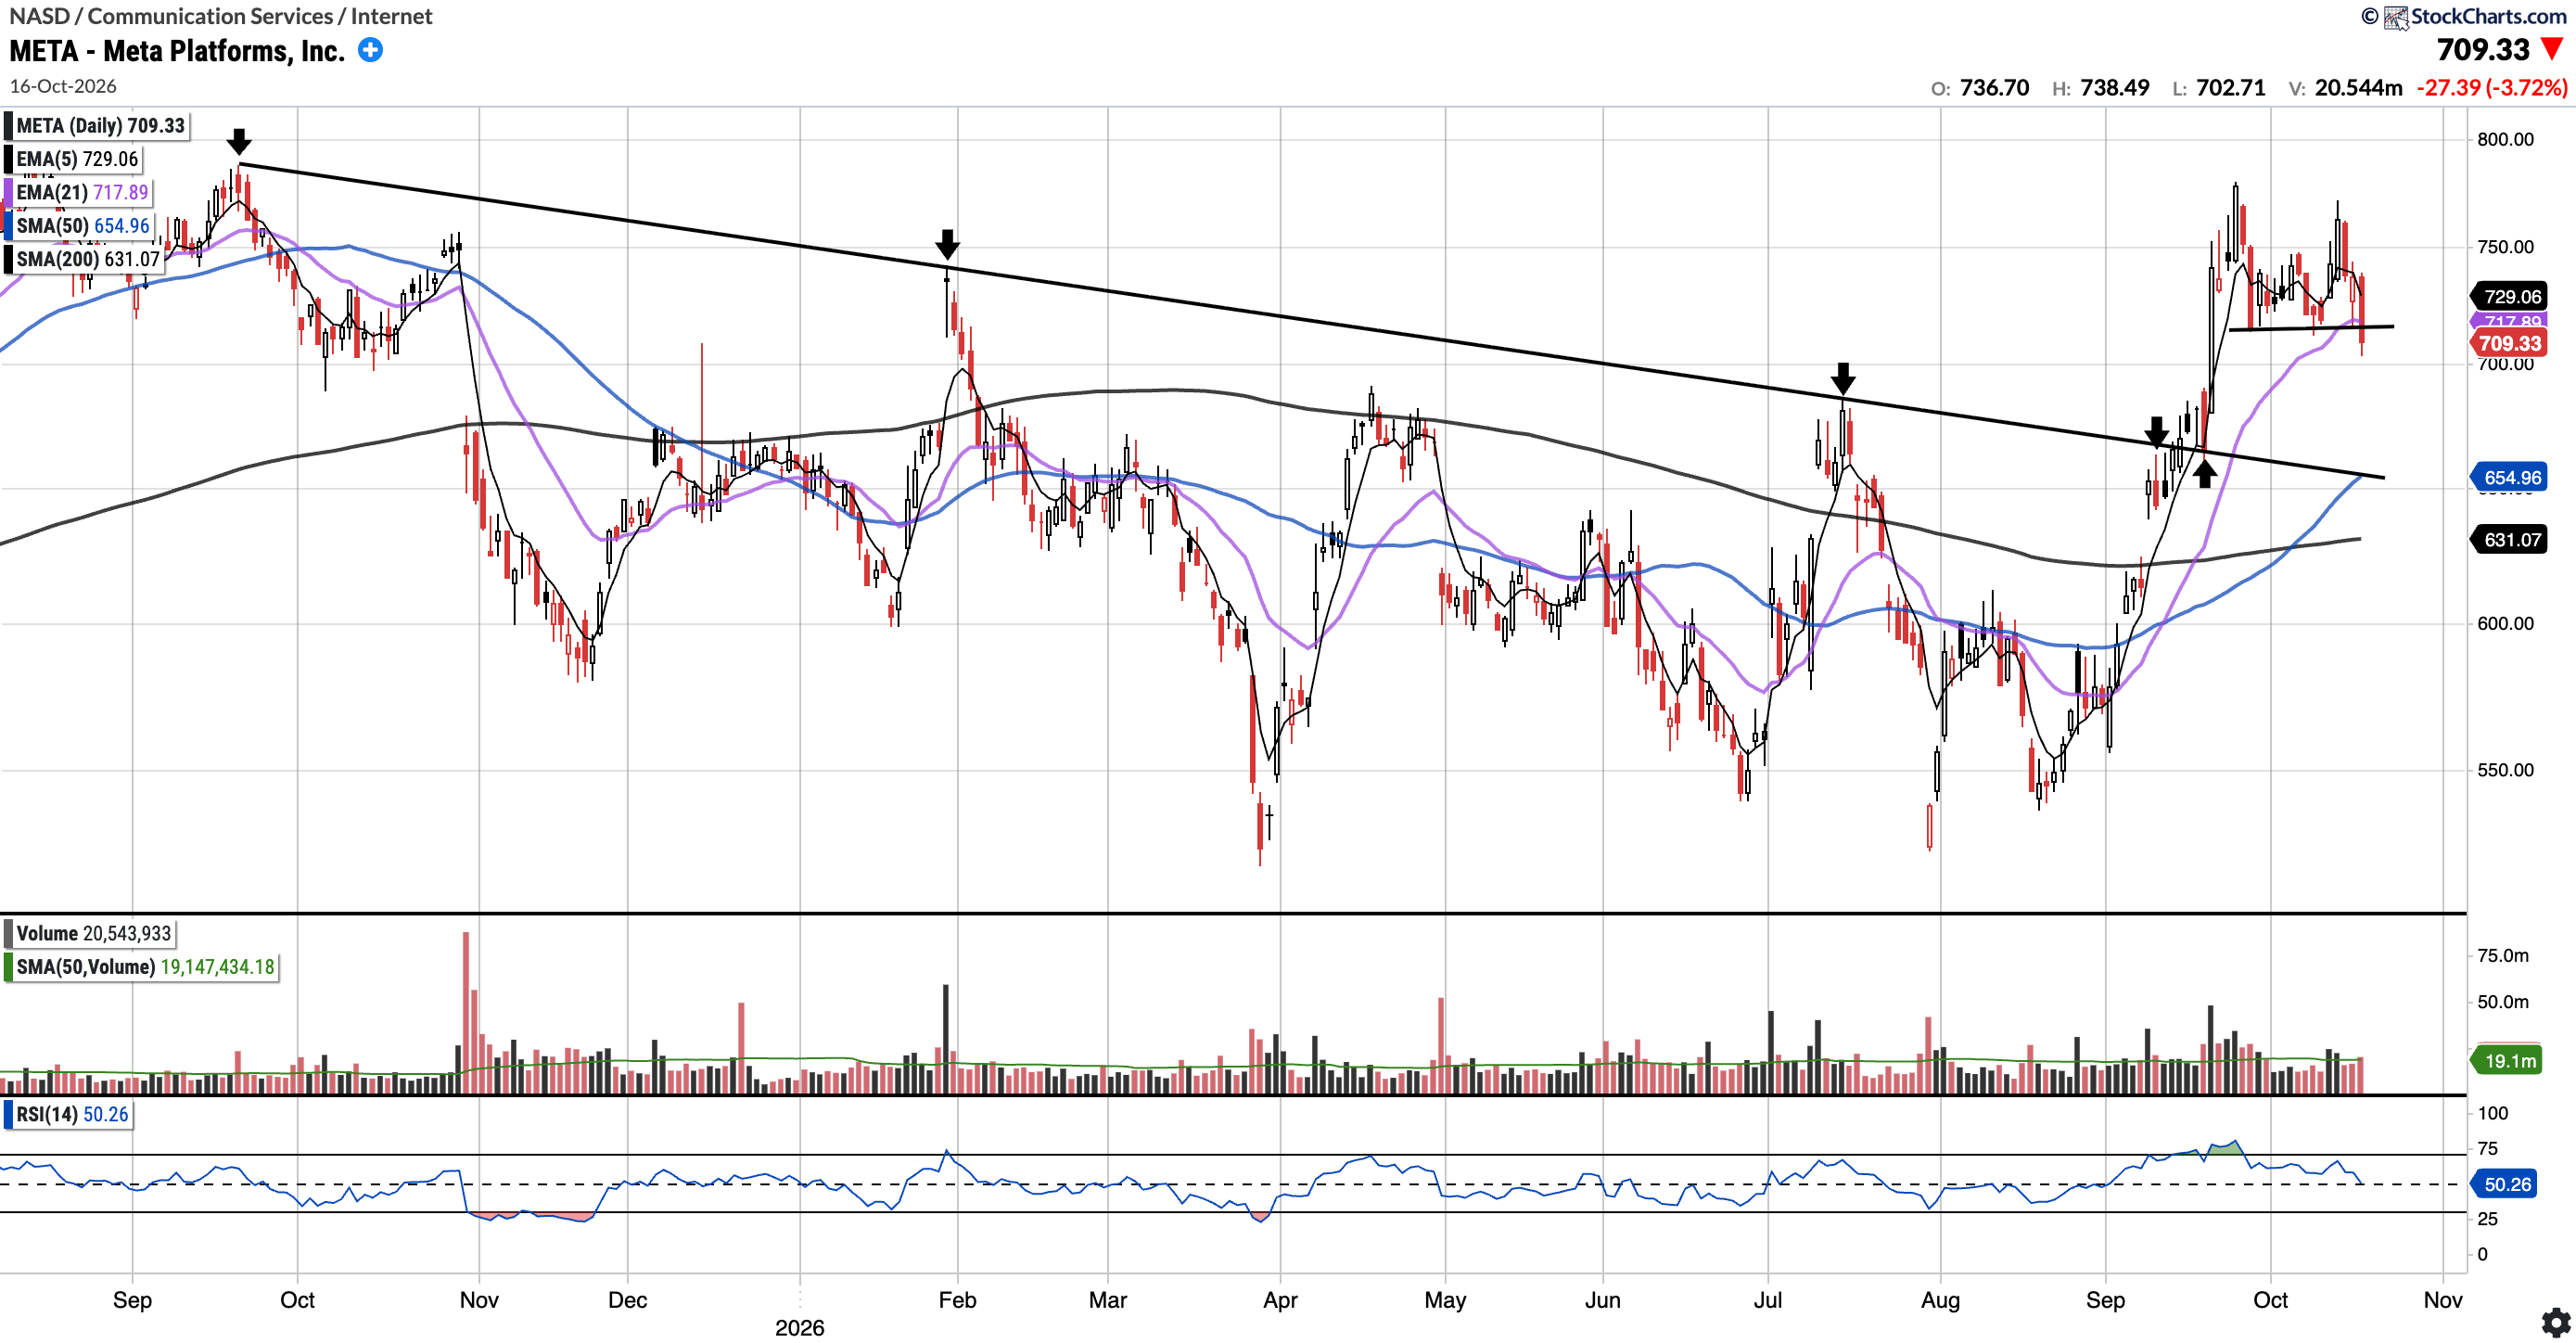
META (Currently Long)
Currently trades at $709.33, 8.30% above the 50SMA and 12.40% above the 200SMA.
RSI 50.26
9.34% YTD
META lost the $710-$715 support level flagged last week (horizontal line) and its 21-day EMA ($717.89) during Friday's selloff, closing at $709.33 below the range held since the September gap higher. The descending trendline, which converges with the 50-day SMA, is the next key area to watch for a retest.
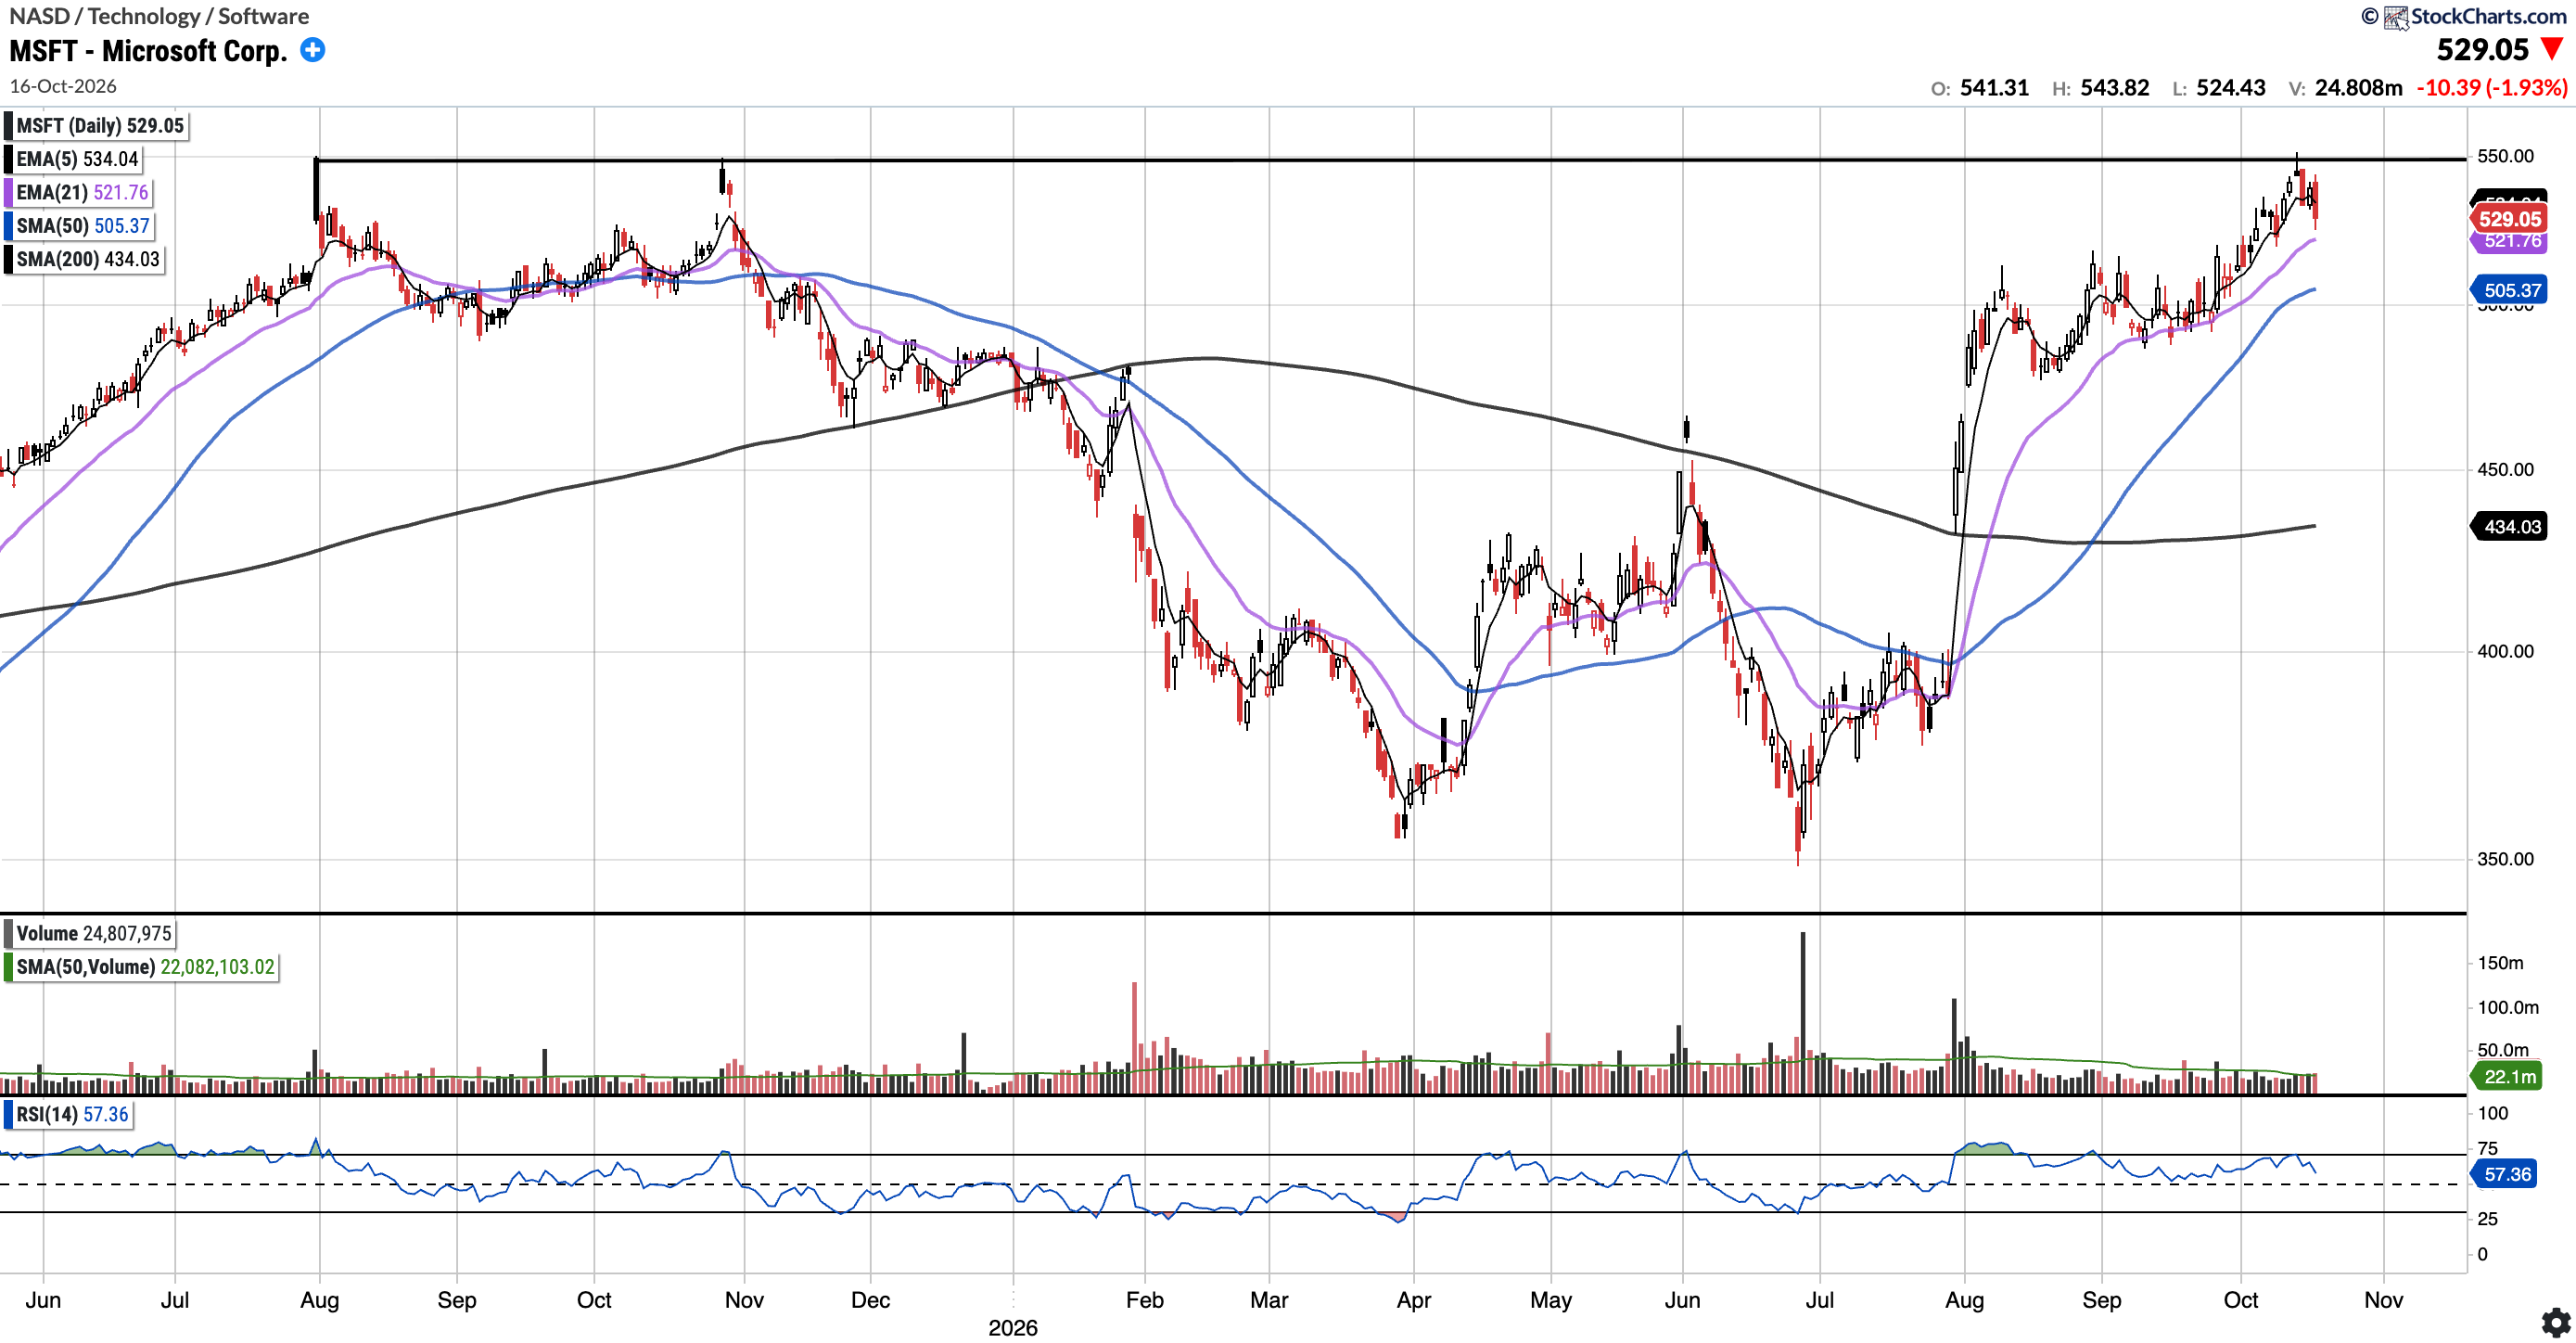
MSFT (Currently Long)
Currently trades at $529.05, 4.69% above the 50SMA and 21.89% above the 200SMA.
RSI 57.36
12.57% YTD
MSFT ran into its 2025 highs near $550 (see horizontal line) early in the week, briefly breaking out intraday before reversing. Price is now below its 5-day EMA ($534.04) but remains above all major moving averages, including the 21-day EMA ($521.76), which has cushioned pullbacks since August. Bulls will want to see the 21-day EMA hold on this dip, accompanied by another attempt at the $550 level. A close below the 21-day EMA would break the short-term uptrend.
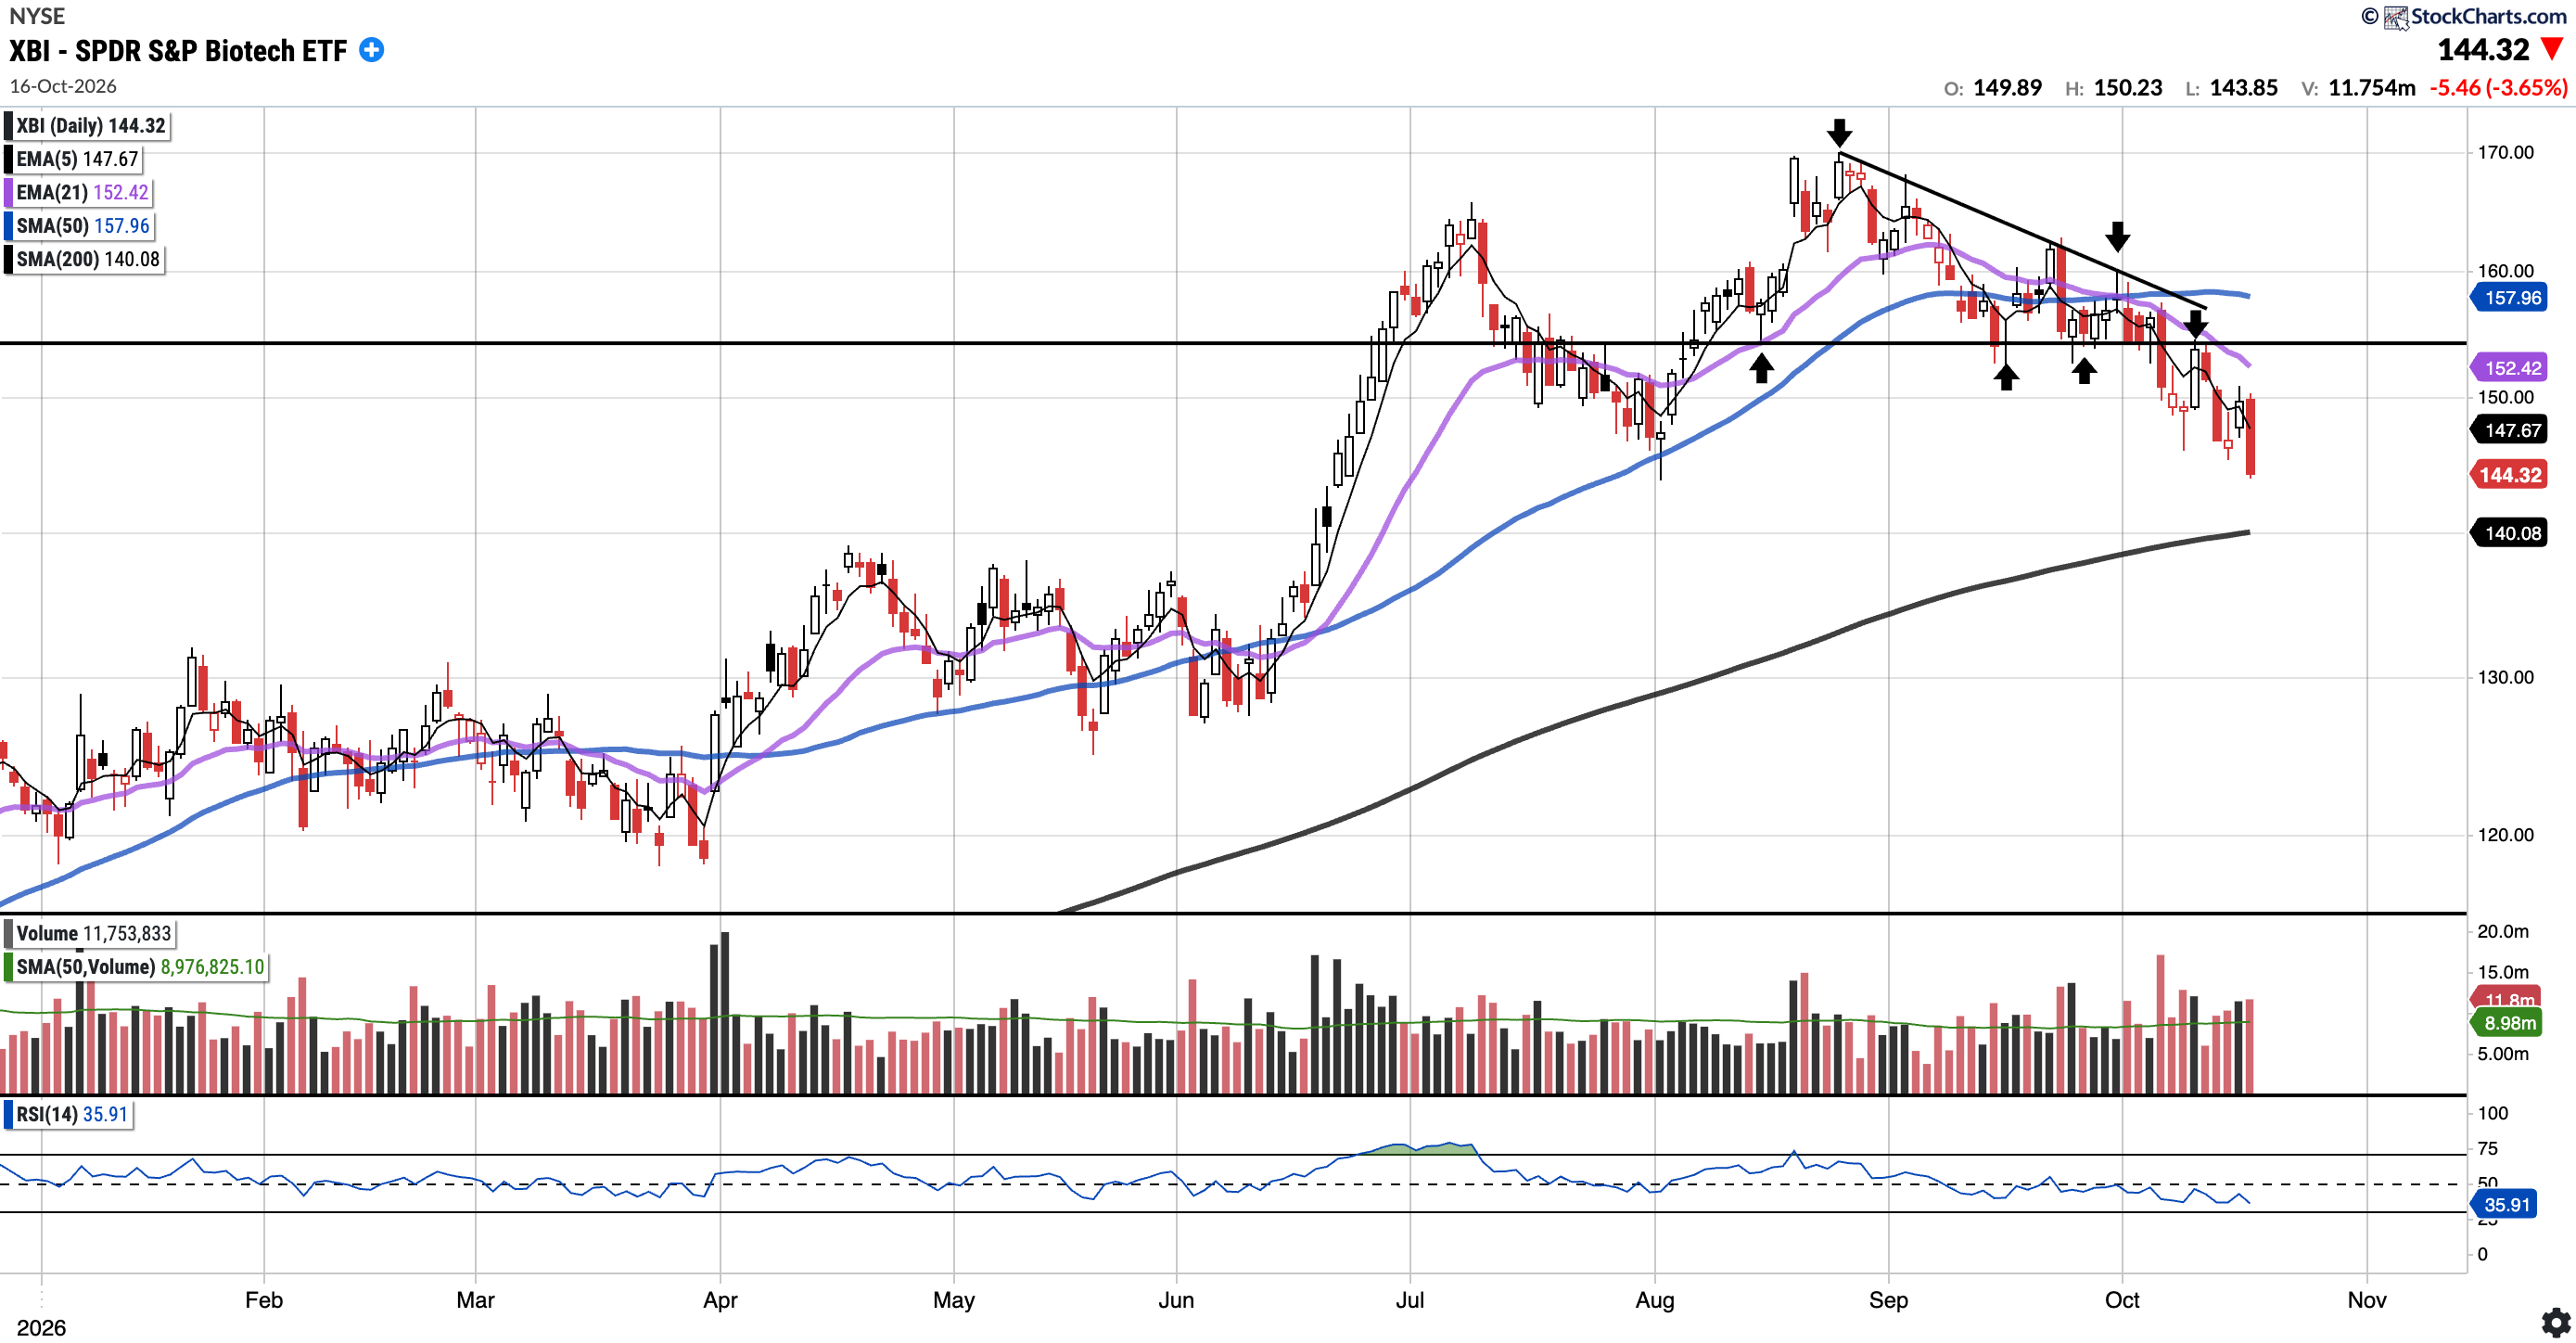
XBI
Currently trades at $144.32, 8.64% below the 50SMA and 3.02% above the 200SMA.
RSI 35.91
18.88% YTD
The failure of the $154 level flagged last week played out. This week, that level acted as resistance before price sold off at the end of this week. Price is now below its 5EMA, 21EMA ($152.42) and 50SMA ($157.96), with the 200SMA ($140.08) the next major moving average support below. Bulls need to reclaim the 21EMA and $154 to restore the uptrend.
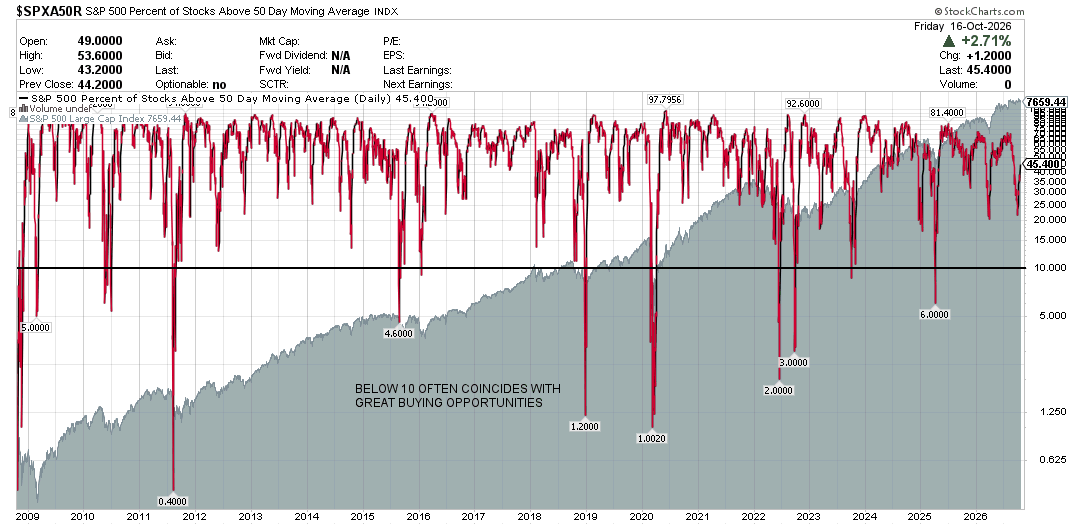
S&P 500 Percentage of Stocks Above the 50 Day Moving Average: Currently 45.40%
Breadth increased decently again this week, with the percentage of stocks above the 50-day moving average now at 45.40% compared to 36.40% last week.
Notable portfolio changes in previous week (all updated live in subscriber channels):
No notable portfolio changes this week.
IMPORTANT: To familiarise yourself with the notification process, please read the following post regarding the notification system.